

Mapping geographical inequalities in oral rehydration therapy coverage in low-income and middle-income countries, 2000-17
- PMID: 32710861
- PMCID: PMC7388204
- DOI: 10.1016/S2214-109X(20)30230-8
Mapping geographical inequalities in oral rehydration therapy coverage in low-income and middle-income countries, 2000-17
Abstract
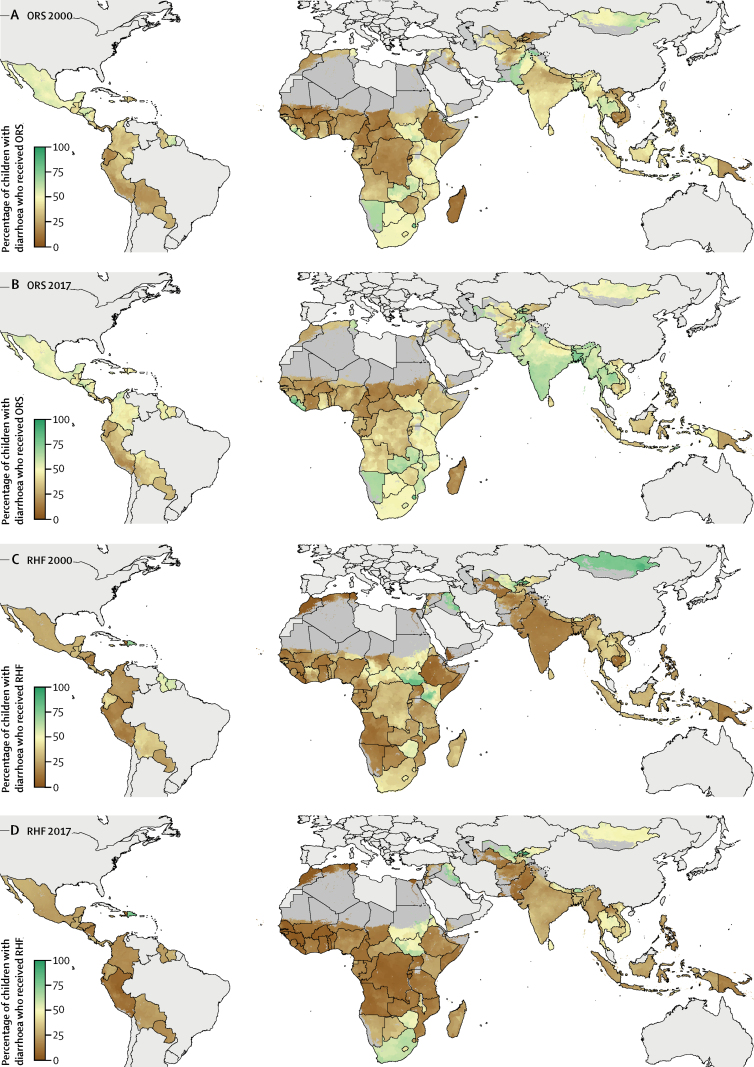
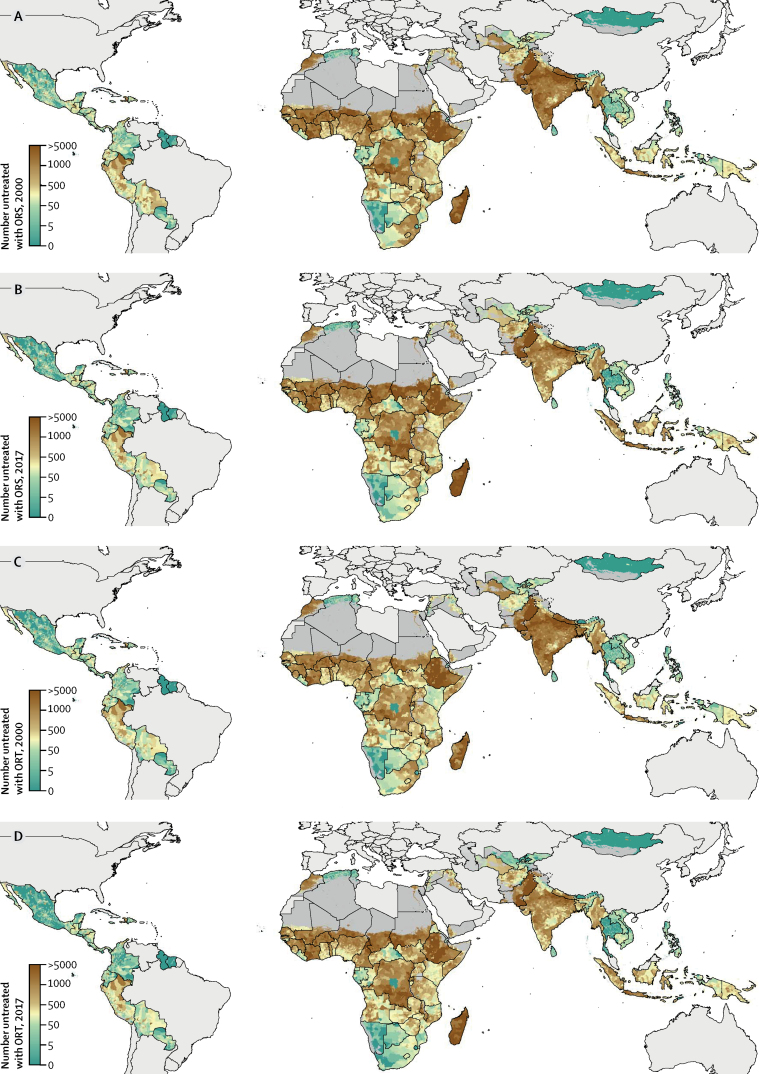
Background: Oral rehydration solution (ORS) is a form of oral rehydration therapy (ORT) for diarrhoea that has the potential to drastically reduce child mortality; yet, according to UNICEF estimates, less than half of children younger than 5 years with diarrhoea in low-income and middle-income countries (LMICs) received ORS in 2016. A variety of recommended home fluids (RHF) exist as alternative forms of ORT; however, it is unclear whether RHF prevent child mortality. Previous studies have shown considerable variation between countries in ORS and RHF use, but subnational variation is unknown. This study aims to produce high-resolution geospatial estimates of relative and absolute coverage of ORS, RHF, and ORT (use of either ORS or RHF) in LMICs.
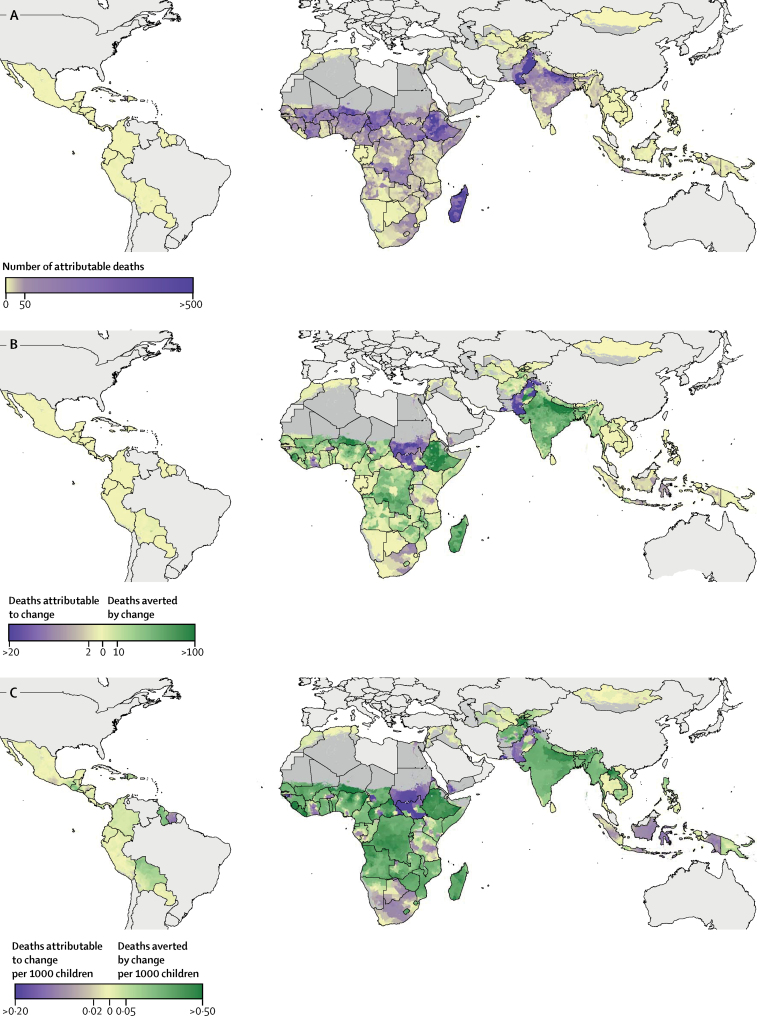
Methods: We used a Bayesian geostatistical model including 15 spatial covariates and data from 385 household surveys across 94 LMICs to estimate annual proportions of children younger than 5 years of age with diarrhoea who received ORS or RHF (or both) on continuous continent-wide surfaces in 2000-17, and aggregated results to policy-relevant administrative units. Additionally, we analysed geographical inequality in coverage across administrative units and estimated the number of diarrhoeal deaths averted by increased coverage over the study period. Uncertainty in the mean coverage estimates was calculated by taking 250 draws from the posterior joint distribution of the model and creating uncertainty intervals (UIs) with the 2·5th and 97·5th percentiles of those 250 draws.
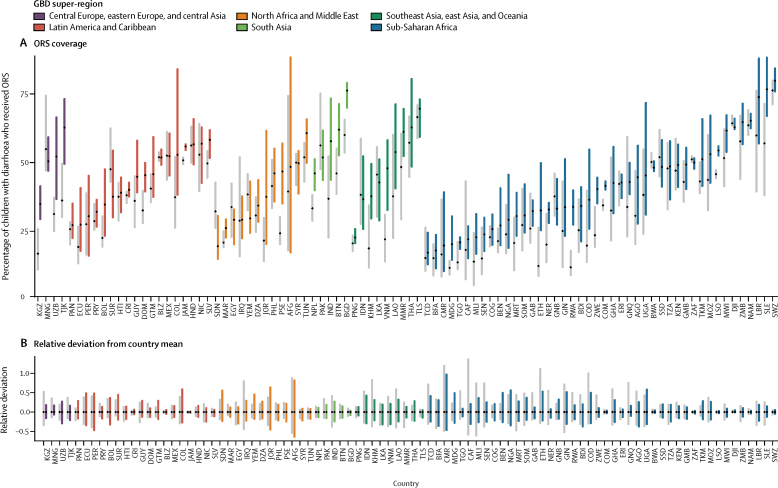
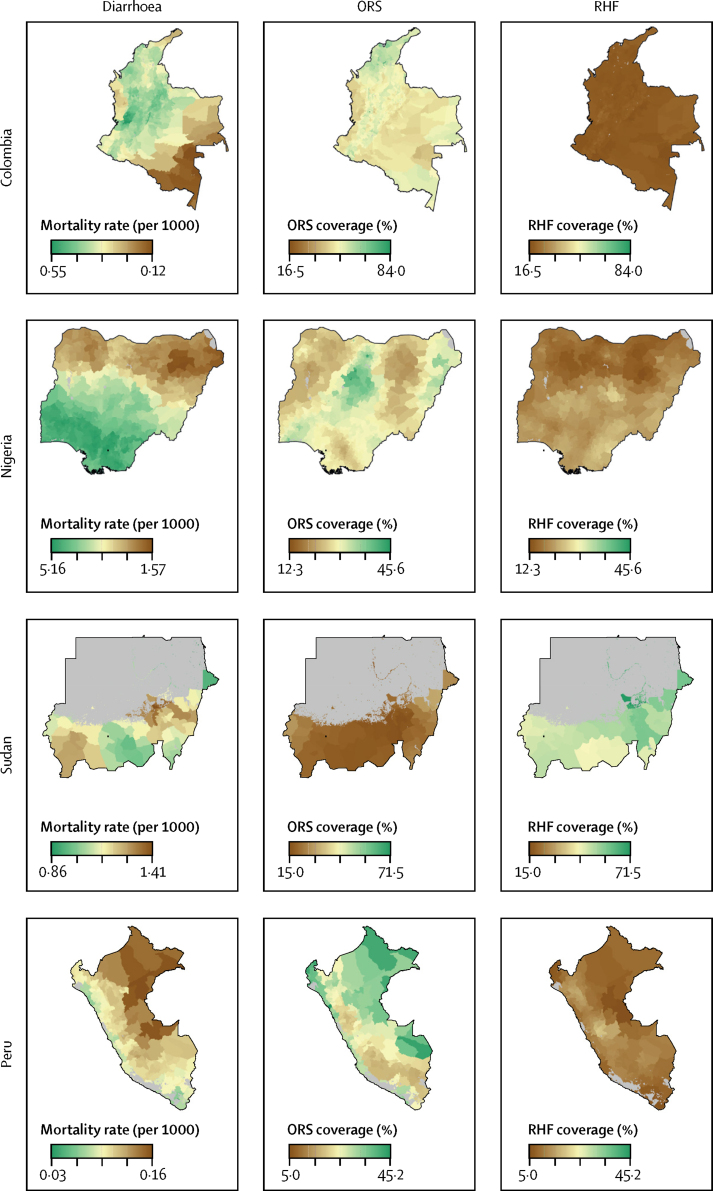
Findings: While ORS use among children with diarrhoea increased in some countries from 2000 to 2017, coverage remained below 50% in the majority (62·6%; 12 417 of 19 823) of second administrative-level units and an estimated 6 519 000 children (95% UI 5 254 000-7 733 000) with diarrhoea were not treated with any form of ORT in 2017. Increases in ORS use corresponded with declines in RHF in many locations, resulting in relatively constant overall ORT coverage from 2000 to 2017. Although ORS was uniformly distributed subnationally in some countries, within-country geographical inequalities persisted in others; 11 countries had at least a 50% difference in one of their units compared with the country mean. Increases in ORS use over time were correlated with declines in RHF use and in diarrhoeal mortality in many locations, and an estimated 52 230 diarrhoeal deaths (36 910-68 860) were averted by scaling up of ORS coverage between 2000 and 2017. Finally, we identified key subnational areas in Colombia, Nigeria, and Sudan as examples of where diarrhoeal mortality remains higher than average, while ORS coverage remains lower than average.
Interpretation: To our knowledge, this study is the first to produce and map subnational estimates of ORS, RHF, and ORT coverage and attributable child diarrhoeal deaths across LMICs from 2000 to 2017, allowing for tracking progress over time. Our novel results, combined with detailed subnational estimates of diarrhoeal morbidity and mortality, can support subnational needs assessments aimed at furthering policy makers' understanding of within-country disparities. Over 50 years after the discovery that led to this simple, cheap, and life-saving therapy, large gains in reducing mortality could still be made by reducing geographical inequalities in ORS coverage.
Funding: Bill & Melinda Gates Foundation.
Copyright © 2020 The Author(s). Published by Elsevier Ltd. This is an Open Access article under the CC BY 4.0 license. Published by Elsevier Ltd.. All rights reserved.
Figures
References
-
- Das JK, Salam RA, Bhutta ZA. Global burden of childhood diarrhea and interventions. Curr Opin Infect Dis. 2014;27:451–458. - PubMed
-
- Nalin DR, Cash RA, Islam R, Molla M, Phillips RA. Oral maintenance therapy for cholera in adults. Lancet. 1968;292:370–372. - PubMed
-
- Pierce NF, Sack BR, Mitra RC. Replacement of water and electrolyte losses in cholera by an oral glucose-electrolyte solution. Ann Intern Med. 1969;70 - PubMed
