. 2020 Sep 4;432(19):5212-5226.
doi: 10.1016/j.jmb.2020.07.009. Epub 2020 Jul 23.

Mutations Strengthened SARS-CoV-2 Infectivity

Affiliations

Mutations Strengthened SARS-CoV-2 Infectivity

Jiahui Chen et al. J Mol Biol. .

Abstract

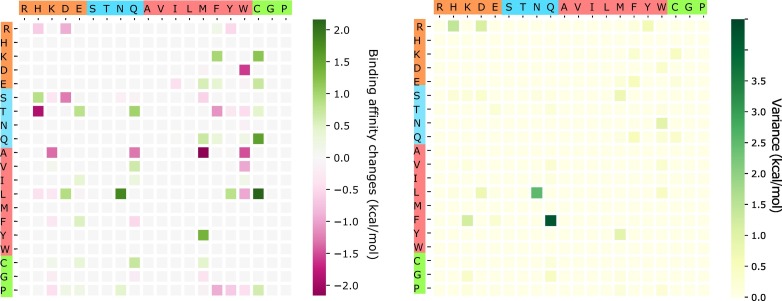
Severe acute respiratory syndrome coronavirus 2 (SARS-CoV-2) infectivity is a major concern in coronavirus disease 2019 (COVID-19) prevention and economic reopening. However, rigorous determination of SARS-CoV-2 infectivity is very difficult owing to its continuous evolution with over 10,000 single nucleotide polymorphisms (SNP) variants in many subtypes. We employ an algebraic topology-based machine learning model to quantitatively evaluate the binding free energy changes of SARS-CoV-2 spike glycoprotein (S protein) and host angiotensin-converting enzyme 2 receptor following mutations. We reveal that the SARS-CoV-2 virus becomes more infectious. Three out of six SARS-CoV-2 subtypes have become slightly more infectious, while the other three subtypes have significantly strengthened their infectivity. We also find that SARS-CoV-2 is slightly more infectious than SARS-CoV according to computed S protein-angiotensin-converting enzyme 2 binding free energy changes. Based on a systematic evaluation of all possible 3686 future mutations on the S protein receptor-binding domain, we show that most likely future mutations will make SARS-CoV-2 more infectious. Combining sequence alignment, probability analysis, and binding free energy calculation, we predict that a few residues on the receptor-binding motif, i.e., 452, 489, 500, 501, and 505, have high chances to mutate into significantly more infectious COVID-19 strains.

Keywords: COVID-19; mutation; protein-protein interaction; spike protein; viral infectivity.


Figures

Unlabelled Image
Graphical abstract
Figure 1
Figure 1
The scatter plot of six distinct clusters in the world. The light blue, dark blue, green, red, pink, and yellow represent Cluster I, Cluster II, Cluster III, Cluster IV, Cluster V, and Cluster VI, respectively. The color of the dominated cluster decides the base color of each country. The world map is generated by the Highcharts.
Figure 2
Figure 2
Overall BFE changes ∆∆G on the RBD. The blue color region marks the BFE changes on the RBM. The height of each bar indicates the predicted ∆∆ G. The color indicates the occurrence frequency in the GISAID genome dataset.
Figure 3
Figure 3
The time evolution of 89 SARS-CoV-2 S protein RBD mutations. The red lines represent the mutations that strengthen the infectivity of SARS-CoV-2 (i.e., ∆∆ G is positive), and the blue lines represent the mutations that weaken the infectivity of SARS-CoV-2 (i.e., ∆∆ G is negative). Many mutations overlap their trajectories. Here, the collection date of each genome sequence that deposited in GISAID is applied.
Figure 4
Figure 4
Cluster I. Left: BFE changes ∆∆G induced by mutations in Cluster I. Right: mutation locations on the SARS-CoV-2 S protein RBD.
Figure 5
Figure 5
Cluster II. Left: BFE changes ∆∆G induced by mutations in Cluster II. Right: mutation locations on the SARS-CoV-2 S protein RBD.
Figure 6
Figure 6
Cluster III. Left: BFE changes ∆∆G induced by mutations in Cluster III. Right: mutation locations on the SARS-CoV-2 S protein RBD.
Figure 7
Figure 7
Cluster IV. Left: BFE changes ∆∆G induced by mutations in Cluster IV. Right: mutation locations on the SARS-CoV-2 S protein RBD.
Figure 8
Figure 8
Cluster V. Left: BFE changes ∆∆G induced by mutations in Cluster V. Right: mutation locations on the SARS-CoV-2 S protein RBD.
Figure 9
Figure 9
Cluster VI. Left: BFE changes ∆∆G induced by mutations in Cluster VI. Right: mutation locations on the SARS-CoV-2 S protein RBD.
Figure 10
Figure 10
Top 20 most likely future mutations that will strengthen the SARS-CoV-2 infectivity. Left: BFE changes ∆∆G. Right: mutations on the RBD. Red color indicates mutations on the RBM and blue color indicates mutations away from the RBM.
Figure 11
Figure 11
An illustration of the average and variance of ∆∆G (kcal/mol) for most likely mutation types on the RBM. y-axes: wild-type residues; x-axes: mutant type residues. Colors on the axes indicate residue types.
Figure 12
Figure 12
An illustration of the average and variance of ∆∆G (kcal/mol) for most likely mutation types away from the RBM. y-axes: wild-type residues; x-axes: mutant type residues. Colors on the axes indicate residue types.
Figure 13
Figure 13
Top 20 likely future mutations that will strengthen the COVID-19 infectivity. Left: BFE changes. ∆∆G. Right: mutations on the RBD. Red color indicates mutations on the RBM and blue color indicates mutations away from the RBM.
Figure 14
Figure 14
An illustration of the average and variance of ∆∆G (kcal/mol) for likely mutation types on the RBM. y-axes: wild-type residues; x-axes: mutant type residues. Colors on the axes indicate residue types.
Figure 15
Figure 15
An illustration of the average and variance of ∆∆G (kcal/mol) for likely mutation types away from the RBM. y-axes: wild-type residues; x-axes: mutant type residues. Colors on the axes indicate residue types.
Figure 16
Figure 16
An illustration of the average and variance of ∆∆G (kcal/mol) for unlikely mutation types on the RBM. y-axes: wild-type residues; x-axes: mutant type residues. Colors on the axes indicate residue types.
Figure 17
Figure 17
An illustration of the average and variance of ∆∆G (kcal/mol) for most likely mutation types away from the RBM. y-axes: wild-type residues; x-axes: mutant type residues. Colors on the axes indicate residue types.
Figure 18
Figure 18
Sequence alignments of SARS-CoV-2 S protein with those of closely related species, including SARS-CoV [32], bat coronavirus RaTG13 [33], bat coronavirus BM48–31 [34], and bat coronavirus CoVZC45 [35]. Detailed numbering is given according to SARS-CoV-2. Residue 364 Ala (A) of bat coronavirus BM48–31 is omitted.
Figure 19
Figure 19
Overall BFE changes ∆∆G on the S protein RBD from SARS-CoV to SARS-CoV-2. The blue color region marks the BFE changes on the RBM. The height of each bar indicates the predicted ∆∆G. Residues are labeled according to PDB ID 3D0G [36].

References

    1. C. Huang, Y. Wang, X. Li, L. Ren, J. Zhao, Y. Hu, L. Zhang, G. Fan, J. Xu, X. Gu, et al. Clinical features of patients infected with 2019 novel coronavirus in Wuhan, China. Lancet, 395(10223):497–506, 2020. - PMC - PubMed
    1. J. F.-W. Chan, S. Yuan, K.-H. Kok, K. K.-W. To, H. Chu, J. Yang, F. Xing, J. Liu, C. C.-Y. Yip, R. W.-S. Poon, et al. A familial cluster of pneumonia associated with the 2019 novel coronavirus indicating person-to-person transmission: a study of a family cluster. Lancet, 395(10223):514–523, 2020. - PMC - PubMed
    1. Gralinski L.E., Menachery V.D. Return of the coronavirus: 2019-nCoV. Viruses. 2020;12(2):135. - PMC - PubMed
    1. Lu R., Zhao X., Li J., Niu P., Yang B., Wu H., Wang W., Song H. Genomic characterisation and epidemiology of 2019 novel coronavirus: implications for virus origins and receptor binding. Lancet. 2020;395(10224):565–574. - PMC - PubMed
    1. Wang R., Hozumi Y., Yin C., Wei G.-W. Decoding SARS-CoV-2 transmission and evolution and ramifications for COVID-19 diagnosis, vaccine, and medicine. J. Chem. Inf. Model. 2020 32530284 in press. - PMC - PubMed

Publication types

MeSH terms