Review
. 2021 Jan:80:100878.
doi: 10.1016/j.preteyeres.2020.100878. Epub 2020 Jul 24.

Plexus-specific retinal vascular anatomy and pathologies as seen by projection-resolved optical coherence tomographic angiography

Affiliations
Review

Plexus-specific retinal vascular anatomy and pathologies as seen by projection-resolved optical coherence tomographic angiography

Tristan T Hormel et al. Prog Retin Eye Res. 2021 Jan.

Abstract

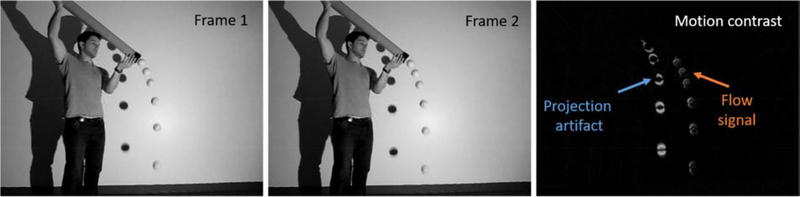
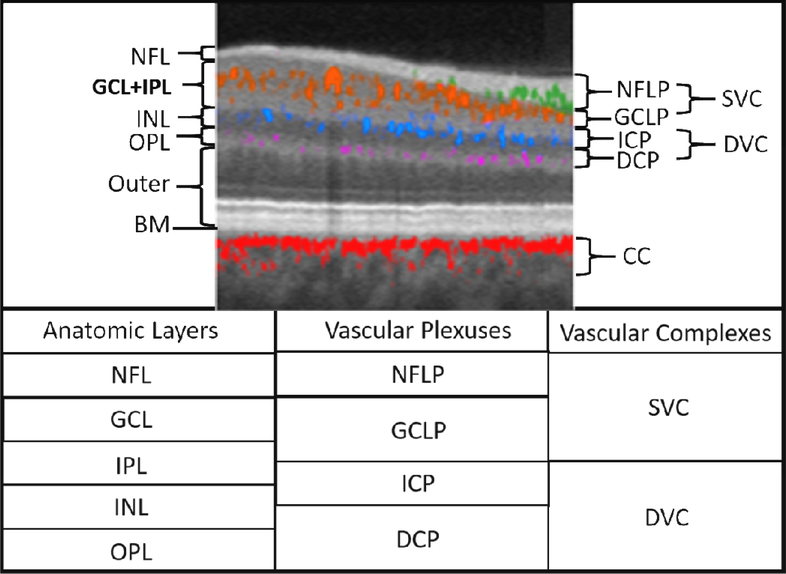
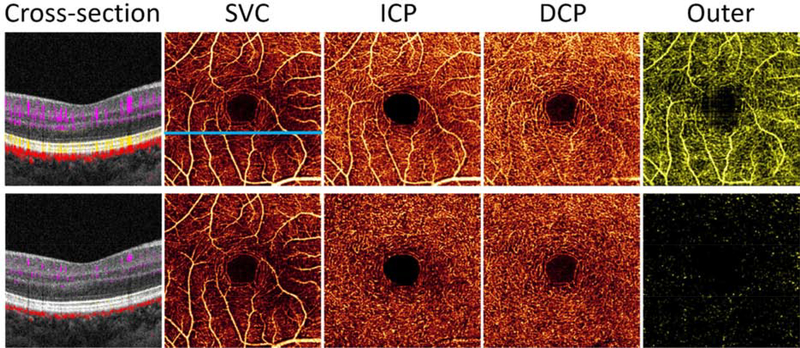
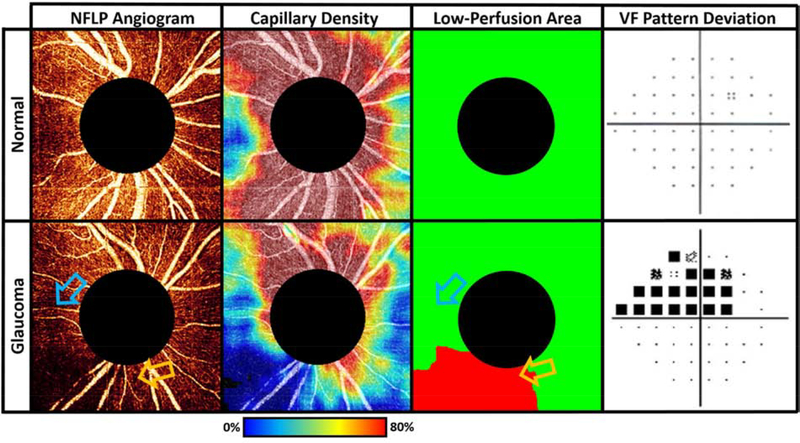
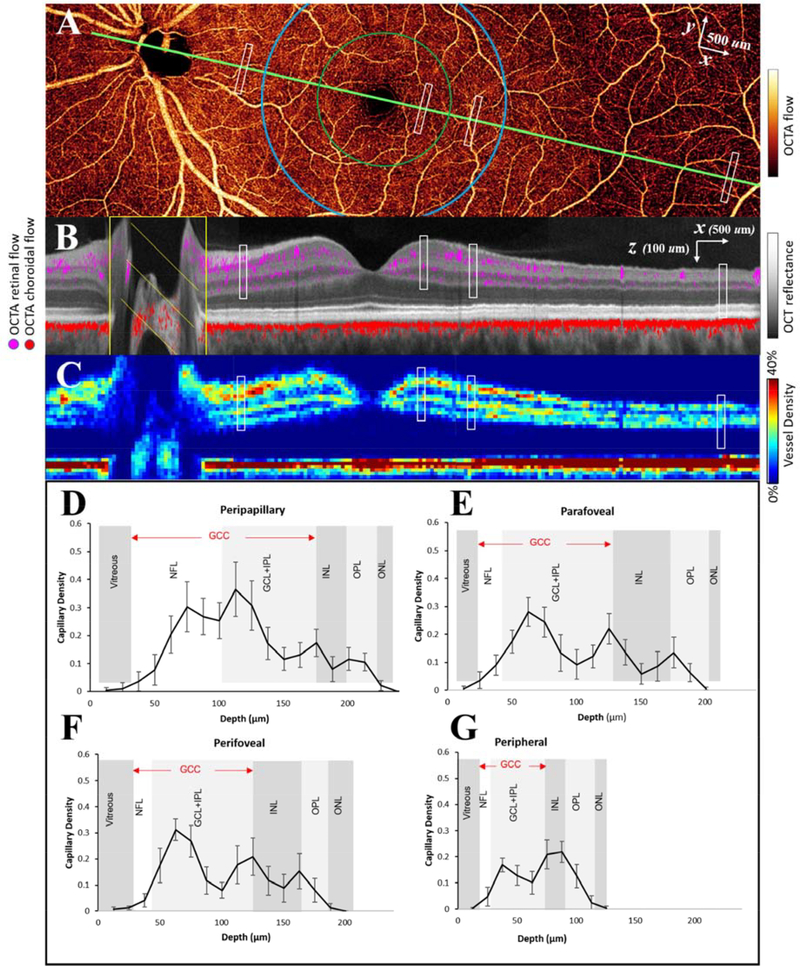
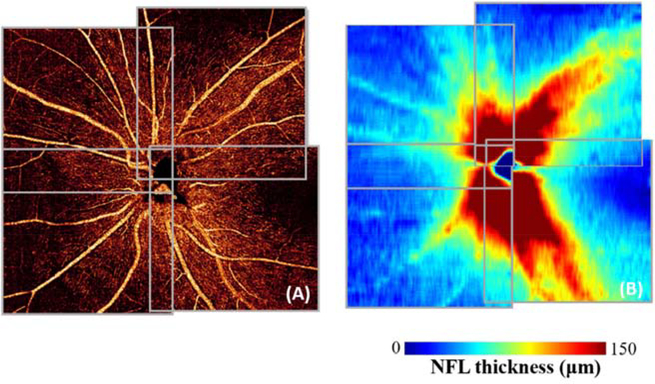
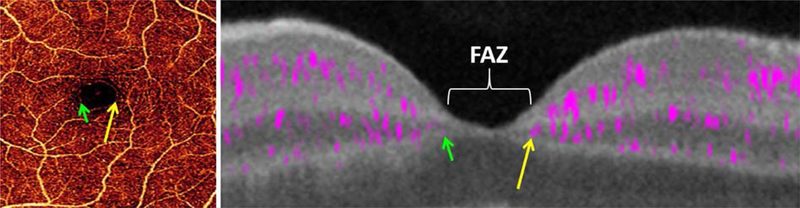
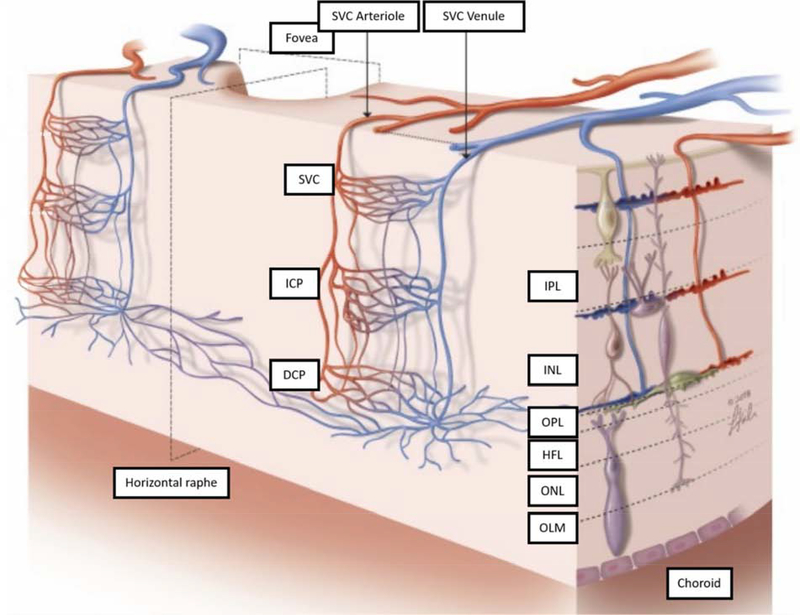
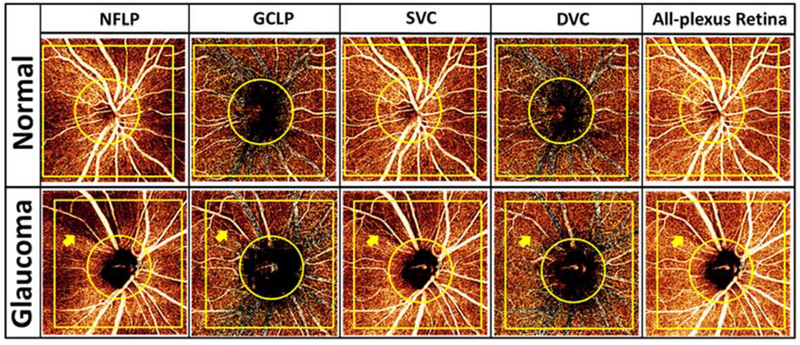
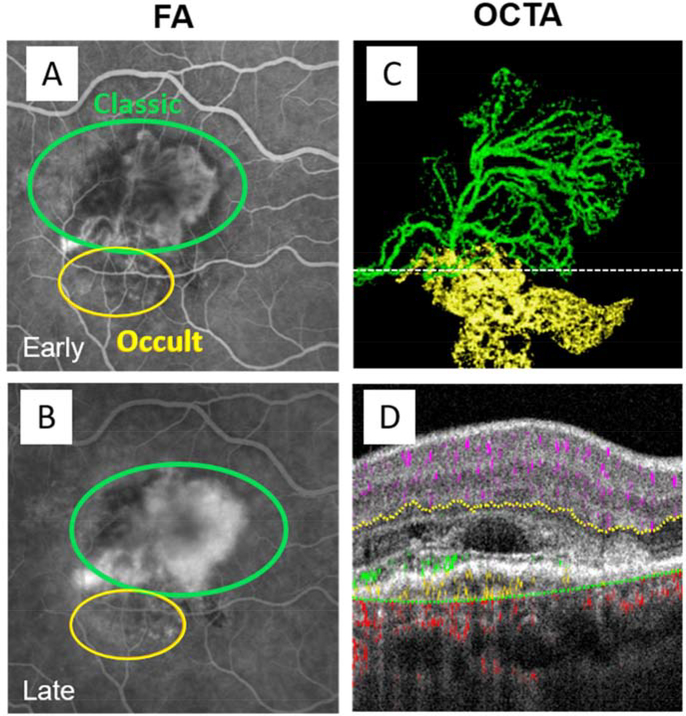
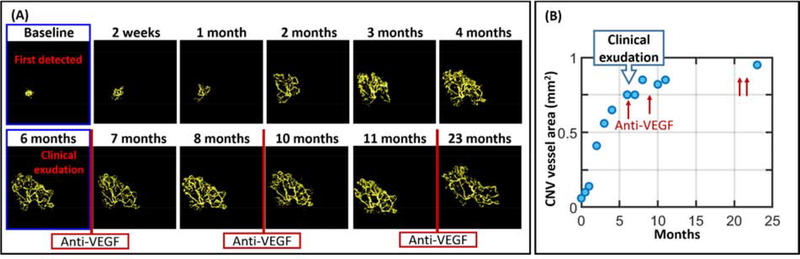
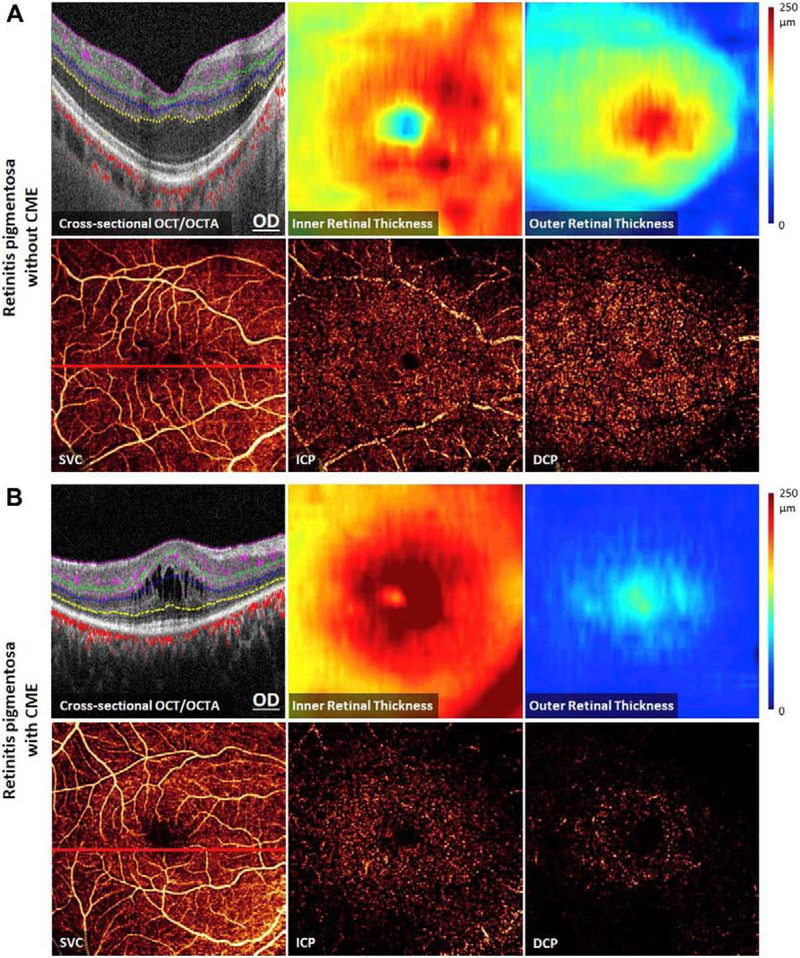
Optical coherence tomographic angiography (OCTA) is a novel technology capable of imaging retinal vasculature three-dimensionally at capillary scale without the need to inject any extrinsic dye contrast. However, projection artifacts cause superficial retinal vascular patterns to be duplicated in deeper layers, thus interfering with the clean visualization of some retinal plexuses and vascular pathologies. Projection-resolved OCTA (PR-OCTA) uses post-processing algorithms to reduce projection artifacts. With PR-OCTA, it is now possible to resolve up to 4 distinct retinal vascular plexuses in the living human eye. The technology also allows us to detect and distinguish between various retinal and optic nerve diseases. For example, optic nerve diseases such as glaucoma primarily reduces the capillary density in the superficial vascular complex, which comprises the nerve fiber layer plexus and the ganglion cell layer plexus. Outer retinal diseases such as retinitis pigmentosa primarily reduce the capillary density in the deep vascular complex, which comprises the intermediate capillary plexus and the deep capillary plexus. Retinal vascular diseases such as diabetic retinopathy and vein occlusion affect all plexuses, but with different patterns of capillary loss and vascular malformations. PR-OCTA is also useful in distinguishing various types of choroidal neovascularization and monitoring their response to anti-angiogenic medications. In retinal angiomatous proliferation and macular telangiectasia type 2, PR-OCTA can trace the pathologic vascular extension into deeper layers as the disease progress through stages. Plexus-specific visualization and measurement of retinal vascular changes are improving our ability to diagnose, stage, monitor, and assess treatment response in a wide variety of optic nerve and retinal diseases. These applications will be further enhanced with the continuing improvement of the speed and resolution of the OCT platforms, as well as the development of software algorithms to reduce artifacts, improve image quality, and make quantitative measurements.


Conflict of interest statement

Disclosures

David Huang, Yali Jia and OHSU have financial interest in Optovue Inc. and Yifan Jian has financial interests in Seymour Vision Inc.

Figures

Figure 1.
Figure 1.
Multimodal imaging of macular circulation in a patient matched with postmortem examination of the same eye: (A) histology, (B) OCT angiography (OCTA). The OCTA image represents a projection of all retinal vascular plexuses. Reprinted with permission from (Balaratnasingam et al., 2019).
Figure 2.
Figure 2.
The principle of motion contrast in optical coherence tomographic angiography (OCTA) is explained using video frames. In frames 1 and 2, tennis balls falling out of a tube represent red blood cells. Motion contrast is generated by subtracting the two frames from each other, which accentuates the moving parts in the image while removing the stationary parts (right). Note both the tennis balls (representing flowing blood) and the shadows they cast on the wall (representing projection artifacts) are highlighted.
Figure 3.
Figure 3.
Relationship between the retinal vascular plexuses and anatomic layers illustrated on a cross-sectional projection-resolved (PR) OCTA of a normal eye. Flow signals are color coded according to plexus and overlaid on a gray-scale reflectance image. Anatomic slabs (labels to the left of the image) are NFL = nerve fiber layer; GCL = ganglion cell complex, IPL = inner plexiform layer; INL = inner nuclear layer; OPL = outer plexiform layer; BM = Bruch’s membrane. Vascular plexuses (labels on the right of the image) are NFLP = nerve fiber layer plexus; GCLP = ganglion cell layer plexus; ICP = intermediate capillary plexus; DCP = deep capillary plexus. The GCLP extends from the NFL 67% of the way through the GCL and IPL. The vascular complexes are SVC = superficial vascular complex (NFLP + GCLP); DVC = deep vascular complex (ICP+DCP); CC = choriocapillaris. The table below gives the relative location of the retinal anatomic layers, vascular plexuses, and vascular complexes. Adapted with permission from (Campbell et al., 2017b).
Figure 4.
Figure 4.
Comparison of retinal OCTA (3×3mm) from a healthy volunteer without projection resolution (row 1), and with PR-OCTA (row 2). The en face OCTAs shown are for the superficial vascular complex (SVC), intermediate capillary plexus (ICP), deep capillary plexus (DCP), and outer retina (outer). Also shown are cross-sectional images from the location of the blue line in the original superficial angiogram. In the original en face OCTA, the projection artifacts are most obvious in the outer retinal slab due to the strongly reflective photoreceptor and RPE layers. Large superficial vessels also project bright flow signal in the ICP slab. These artifacts are cleanly removed in PR-OCTA. The projection artifact appears as bright vertical tails on blood vessels in the original cross-sectional OCTA (upper left). These tails are also removed by the PR-OCTA algorithm, restoring the blood vessels as distinct dots (lower left).
Figure 5.
Figure 5.
Bulk motion artifact removal. In the original OCTA of an eye with diabetic retinopathy (left), background is bright due to the presence of bulk motion artifacts. The bulk motion signal can be removed by subtracting the median signal value from the image, but this approach ignores the dependence of bulk motion signal on tissue reflectance and the nonlinear addition of bulk motion and flow signals. Better artifact compensation is achieved with a regression-based approach (Camino et al., 2017). Areas of capillary dropout are more clearly visualized with the bulk motion noise removed.
Figure 6.
Figure 6.
Shadow artifacts. Shown are 3×3 mm retinal angiograms from the same eye before (A) and after (B) vitrectomy surgery to remove vitreous floaters that caused shadow artifacts. The shadow artifact (blue arrow) caused an area within the angiogram to appear avascular; after vitrectomy, the intact vasculature is apparent. Modified with permission from (Camino et al., 2019).
Figure 7.
Figure 7.
Low-perfusion area (LPA) in the peripapillary NFLP distinguishes glaucomatous eyes from normal. The glaucomatous eye (bottom row) has capillary loss identified in the LPA map. The LPA map identifies areas with significantly lower capillary density than that of the same location in a normal eye, providing a more accurate perfusion loss localization than either the raw angiogram or the capillary density map. In the bottom row, the blue arrow marks a region of low capillary density that is normal, while the orange arrow indicates a region that retains high capillary density but that is nonetheless relatively low in comparison to healthy populations. The orange arrow, but not the blue arrow, therefore indicates a low perfusion area, even though the capillary density is higher at the location of the orange arrow. The LPA locations correlate well with the locations of visual field loss in the glaucomatous eye.
Figure 8.
Figure 8.
Retinal layer co-localization and histologic characteristics of the macular capillary plexuses in the left eye of an 84-year old female. Flat mount (A) and cross-sectional (B) histologic images of a donor eye with no known eye disease, depicting all vascular plexuses, demonstrate the density and complexity of the macular capillary circulation. The region where the cross-sectional image has been attained is represented by a white-fenestrated line on Panel A. On the tissue cross-section, nuclei appear in red stain and the vascular endothelium appears in green stain. The cross-section demonstrates that the superficial vascular complex is predominantly localized to the level of the ganglion cell layer, the intermediate plexus to the inner aspect of the inner nuclear layer and the deep plexus to the outer aspect of the inner nuclear layer. (C – E) Capillary plexuses on histologic flat-mounts have been false-colored blue (superficial complex), yellow (intermediate plexus) and red (deep plexus). Reprinted with permission from (Balaratnasingam et al., 2019).
Figure 9.
Figure 9.
Vascular anatomy of a healthy retina as imaged by OCTA. (A) Montaged high-definition en face OCTA of the inner retina. The green line shows the maculopapillary axis and the green and blue circles demarcate the parafovea and perifovea, respectively. (B) Cross-sectional view along the maculopapillary axis. Retinal (violet) and choroidal (red) flow signal are overlaid on the structural OCT image (reflectance in grayscale). (C) Cross-sectional image showing color-coded vascular density. (E-G) Capillary density by depth in 4 distinct regions, marked by the white rectangles in (A-C), support the existence of 4 distinct plexuses in some parts of the retina. NFL: nerve fiber layer; GCL: ganglion cell layer; IPL: inner plexiform layer; OPL: outer plexiform layer; ONL: outer nuclear layer. Adapted with permission from Campbell et al. (Campbell et al., 2017b).
Figure 10.
Figure 10.
Nerve fiber layer plexus (NFLP) angiogram (A) and nerve fiber layer (NFL) thickness map (B). Vessel density is proportional to NFL thickness. The capillaries are mostly parallel to nerve fiber trajectory, which is radial next to the optic disc and arcuate along the superior and inferior nerve fiber bundles. Reprinted with permission from (Jia et al., 2017).
Figure 11.
Figure 11.
En face retinal OCTA (left) and cross-sectional (right) PR-OCTA of the fovea. The retinal plexuses merge into a single ring of capillaries (green and yellow arrows) around the foveal avascular zone (FAZ). Adapted with permission from (Campbell et al., 2017b).
Figure 12.
Figure 12.
Schematic depiction of the retinal circulation. The ICP and DCP receive arteriolar supply (red) from SVC arterioles, and drain (blue) to SVC venules. Direct anastomotic connections between each of these layers are seen on both the arteriolar and venular sides of the capillary beds. The DCP includes vortices that drain centrally into a venule, and also connect to other venules and arterioles through radially oriented capillaries. The DCP contains channels that traverse the horizontal raphe. HFL, Henle fiber layer; OLM, outer limiting membrane; ONL, outer nuclear layer; IPL, inner plexiform layer. Reprinted with permission from (Nesper and Fawzi, 2018).
Figure 13.
Figure 13.
Comparison between a normal and glaucomatous eye imaged with PR-OCTA. Row 1: 4.5×4.5-mm en face projections of a healthy eye; row 2: equivalent views for an eye with glaucoma. The focal capillary dropout in the glaucomatous eye (arrow) is most easily observed in the nerve fiber layer plexus (NFLP). The deep vascular complex (DVC) appears unaffected. GCLP: ganglion cell layer plexus; SVC: superficial vascular complex. Reprinted with permission from Liu et al. (Liu et al., 2019).
Figure 14.
Figure 14.
Projection-resolved OCTA allows depth-resolved discrimination of CNV components in mixed type CNV. (A) Fluorescein angiography shortly after injection (A) and after dye leakage (B). (C) En face OCTA, with type 1 CNV flow shown in green and type 2 in yellow. (D) Cross-sectional OCT located at the dotted line in (C) with OCTA flow signal overlaid, with type 1 CNV with flow signal below the RPE and type 2 CNV with flow signal above the RPE colored as in (C), and normal retinal and choroidal flow shown in violet and yellow, respectively. Type 1 CNV corresponds to occult CNV (yellow circles) in the FA images, and type 2 CNV corresponds classic CNV (green circles).
Figure 15.
Figure 15.
Serial projection-resolved OCTA images demonstrating evolution of a type 3 choroidal neovascularization (CNV), or retinal angiomatous proliferation (RAP), imaged with PR-OCTA. Top row: en face projection of the deep capillary plexus (DCP) showing dilated vessels (blue circles) at the origin of the RAP lesion. Middle row: Pathologic vessels from RAP lesion are visible with en face outer retinal angiogram. Bottom row: cross-sectional PR-OCTA with inner retinal (violet), choroidal (red), and pathological neovascular (yellow) flow overlaid, revealing vascular extension of the RAP lesion to the sub-RPE space and the choroid. Flow signal from several adjacent B-frames was combined by maximum projection to create these images in order to enhance the visibility of RAP features. The RAP lesion (blue circles, top row) began its outward extension (yellow flow signal in outer retina, bottom row) 5 months prior to clinical diagnosis, by which time it has extended into the subretinal space. Reprinted with permission from Bhavsar et al. (Bhavsar et al., 2017).
Figure 16.
Figure 16.
Serial OCTA of a 71-year old eye with non-exudative CNV revealing rapid growth and leading to exudation after 6 months. (A) Time series of OCTA images over almost 2 years, and (B) corresponding measurements of CNV vessel area. Treatment with anti-vascular endothelial growth factor on an as needed basis slowed CNV growth rate.
Figure 17.
Figure 17.
60-year old white man with type 2 diabetes mellitus. (A): Wide-field optical coherence tomography angiography (OCTA) revealed a small 0.26 mm2 patch of retinal neovascularization (arrow) in the vitreous slab (yellow). Color coding allows the viewer to locate the neovascularization relative to the retinal vasculature (purple inner retinal slab) along the inferior arcade. (B): In color fundus photo the retinal neovascularization (arrow) appeared as a retinal hemorrhage; the neovascularization was overlooked clinically. Adapted with permission from (You et al., 2019).
Figure 18.
Figure 18.
Avascular area (blue overlay) is best visualized in individual plexuses. Shown are sample en face images from four different DR severities, including a healthy control, diabetes without DR, mild/moderate NPDR, and severe NPDR or PDR.
Figure 19.
Figure 19.
An eye with branch retinal vein occlusion (BRVO) showing capillary dropout. The deep capillary plexus (DCP) is most severely affected. Dilated capillaries, most likely collaterals, are most prominent in the intermediate and deep capillary plexuses near the edge of the affected territory. The cross-sectional OCTA is taken at the location of the blue line in the SVC image. SVC: superficial vascular complex; ICP: intermediate capillary plexus.
Figure 20.
Figure 20.
Macular telangiectasia type 2 in the left eye of a 55-year-old woman. (A) Fluorescein angiography (FA) reveals leakage temporal to the fovea. The green box indicates a 3 × 3-mm region imaged by OCTA, and the yellow line corresponds to the location of the cross-section shown. (B) Cross-sectional uncorrected OCTA shows projection artifacts that are difficult to distinguish from the outer retinal pathology. The flow signal is color coded according to slab: inner retina (violet), outer retina (yellow), choriocapillaris (red). (C) Cross-sectional PR-OCTA shows neovascularization in the outer retina associated with focal inner retinal capillary loss. Note that the neovascularization is limited to its anatomic location in (C), while in (B) spurious flow signal appears outside of the afflicted region. Some disorganization of retinal layers can be seen to in the structural OCT at this same location. (D) En face PR-OCTA of the outer retinal slab shows the extent of the subretinal neovascular complex. (E-G) PR-OCTA of the individual retinal plexuses reveals vascular rarefication temporal to the fovea and a diving venule (white arrow in E). Reprinted with permission from Patel et al. (Patel et al., 2018b).
Figure 21.
Figure 21.
Structural OCT and OCTA (6×6-mm) in eyes with retinitis pigmentosa (RP). The cross-sectional OCTA images showed segmentations for the superficial vascular complex (SVC, between magenta and green lines), intermediate capillary plexus (ICP, between the green and blue lines), and the deep capillary plexus (DCP, between the blue and yellow lines). Outer retinal thickness was calculated between the outer boundary of the outer plexiform layer (OPL) and Bruch’s membrane (BM). Inner retinal thickness was measured from the inner limiting membrane to the outer boundary of the OPL. (A) A 26 -year old with mild RP and no cystoid macular edema (CME). OCT showed outer retinal thinning in some perifoveal areas. OCTA showed DCP capillary dropout in some perifoveal areas. The parafovea and the ICP were minimally involved. The inner retina and the SVC appeared normal. (B) A 59-year old with moderate RP including CME. OCT showed severe perifoveal and parafoveal outer retinal thinning, with sparing of the photoreceptor ellipsoidal zone only in the fovea. OCTA showed severe perifoveal and moderate parafoveal capillary dropout in the DCP, with milder loss in the ICP. The inner retina and SVC appeared normal except in the foveal area affected by CME. Reprinted with permission from Hagag et al. (Hagag et al., 2019).
Figure 22.
Figure 22.
Visualization of the inner retinal vascular plexuses with a sensorless adaptive optics (SAO) OCT system with 6 μm transverse resolution and 3 μm axial resolution. Convergence of five low order Zernike modes (defocus, vertical and oblique astigmatism, and vertical and horizontal coma) was achieved by a hill-climbing algorithm. The 1.5×1.5 mm OCTA scan was obtained from a normal eye in a healthy human volunteer, and the aberration optimization took 2.8 seconds after which the subject was allowed to blink, and acquisition of OCTA images took 3 seconds. (A) Depth-resolved reflectance intensity and flow profile obtained by averaging B-frames located between the fovea and optic disc after the pixels are aligned at the inner retinal surface. (B) Cross-sectional structural OCT and (C) cross-sectional OCTA are taken at the same location between the fovea and optic disc. (D) En face OCTA and (E) en face OCT. Reflectance is highest in the nerve fiber layer (NFL), inner plexiform layer (IPL) and outer plexiform layer (OPL). Due to the high axial resolution, the trilaminar (3 reflectance peaks) structure of the IPL could be observed. The nuclear layers, ganglion cell layer (GCL) and inner nuclear layer (INL), have low internal reflectivity. Because the NFL is thin at this location, the flow density is lower in the nerve fiber layer plexus (NFLP) relative to the ganglion cell layer plexus (GCLP). The intermediate capillary plexus (ICP) and deep capillary plexus (DCP) show distinct flow signal peaks compared to the low level of flow in the IPL and INL. The higher resolution of the SAO OCT system suppressed projection artifacts so it was not necessary to apply the PR-OCTA algorithm to visualize the distinct capillary patterns in the ICP and DCP. The capillary patterns are also visible on the en face OCT images with much better contrast than standard OCT. More details of this work can be found in (Camino et al., 2020).

References

    1. Ahmed J, Braun RD, Dunn RJ, Linsenmeier RA, 1993. Oxygen distribution in the macaque retina. Investigative Ophthalmology and Visual Science 34, 516–521. - PubMed
    1. Ajtony C, Balla Z, Somoskeoy S, Kovacs B, 2007. Relationship between visual field sensitivity and retinal nerve fiber layer thickness as measured by optical coherence tomography. Investigative Ophthalmology and Visual Science 48, 258–263. - PubMed
    1. Akil H, Huang AS, Francis BA, Sadda SR, Chopra V, 2017. Retinal vessel density from optical coherence tomography angiography to differentiate early glaucoma, pre-perimetric glaucoma and normal eyes. PLoS ONE 12, 1–12. - PMC - PubMed
    1. Al-sheikh M, Sadda SR, Sarraf D, lafe NA, Phasukkijwatana N, Sadda SR, Sarraf D, 2018. Biomarkers of Neovascular Activity in Age-Related Macular Degeneration Using Optical Coherence Tomography Angiography. Retina 0, 1–11. - PubMed
    1. Al-sheikh M, Tepelus TC, Nazikyan T, Sadda SRVR, 2017. Repeatability of automated vessel density measurements using optical coherence tomography angiography. British Journal of Ophthalmology 101, 449–452. - PubMed

Publication types

MeSH terms