. 2020 Jul 26;12(14):13939-13957.
doi: 10.18632/aging.103802. Epub 2020 Jul 26.

Both ghrelin deletion and unacylated ghrelin overexpression preserve muscles in aging mice

Affiliations

Both ghrelin deletion and unacylated ghrelin overexpression preserve muscles in aging mice

Emanuela Agosti et al. Aging (Albany NY). .

Abstract

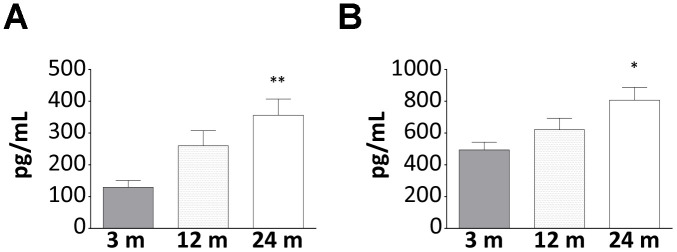
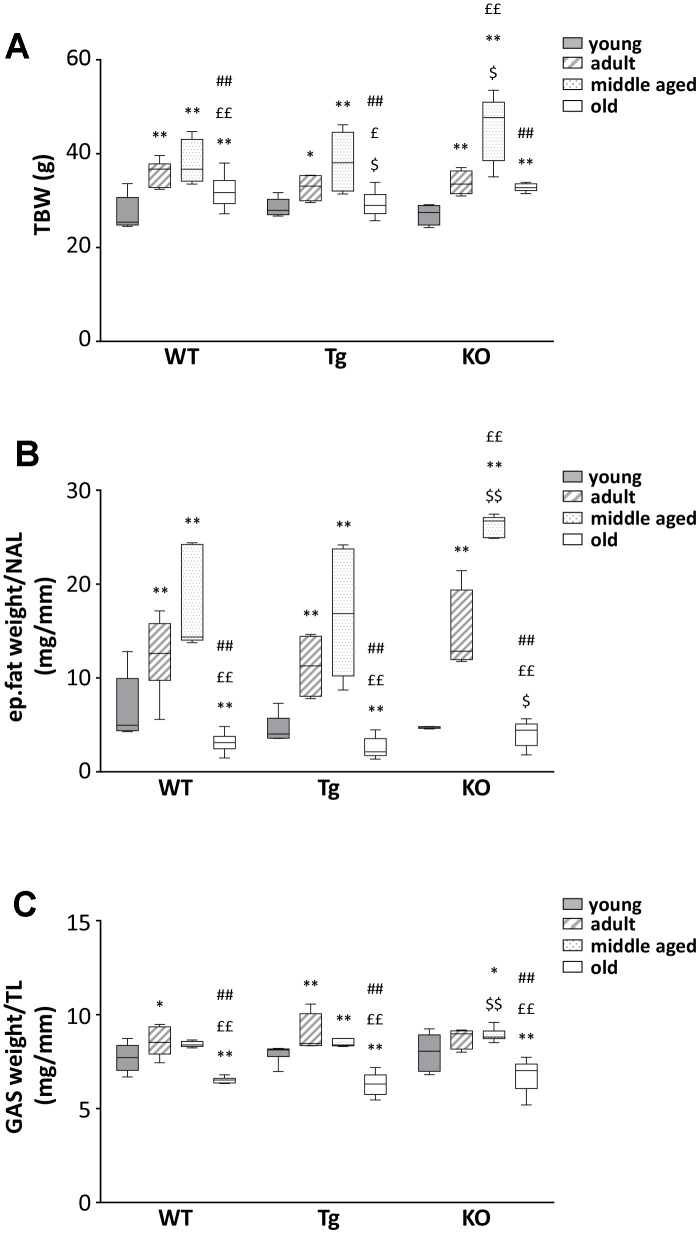
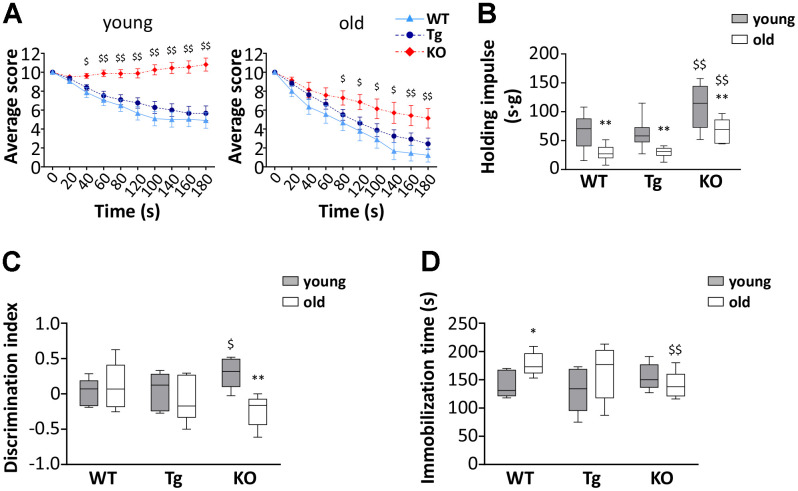
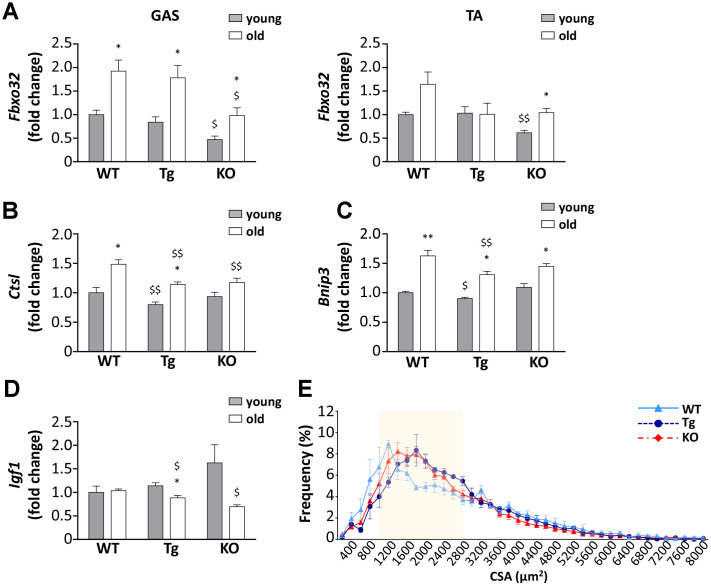
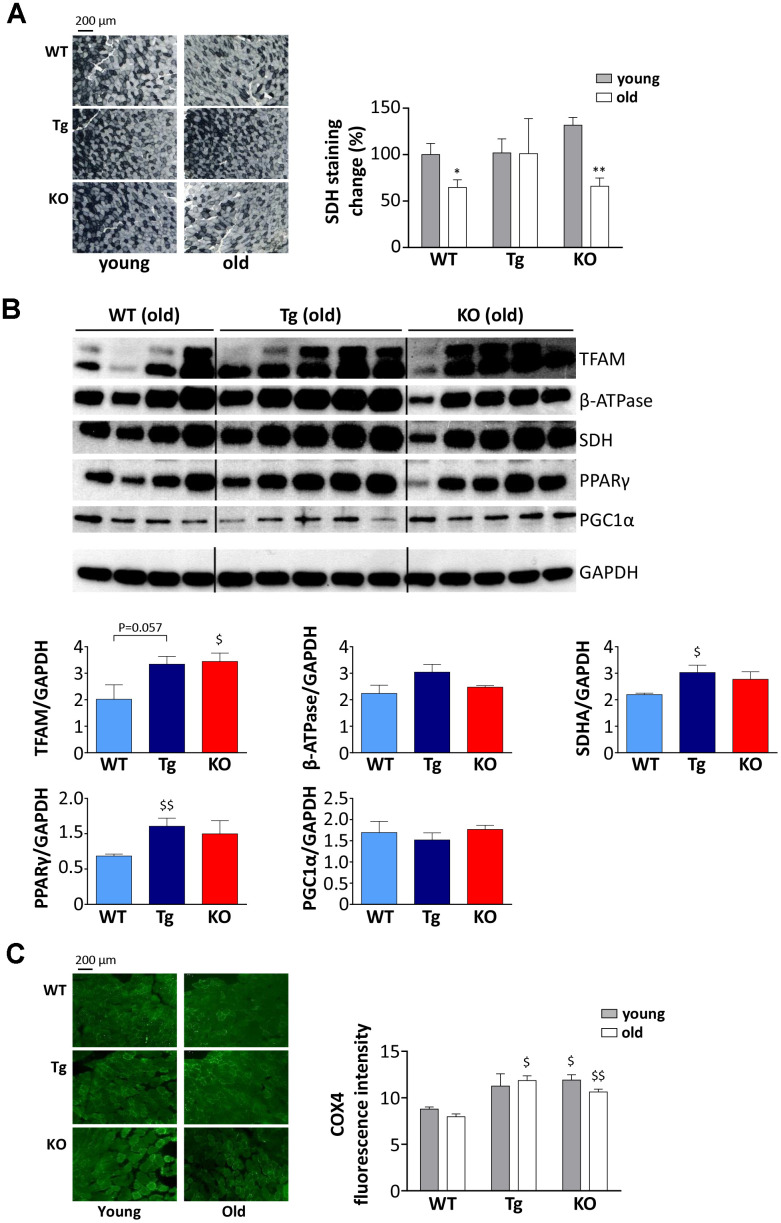
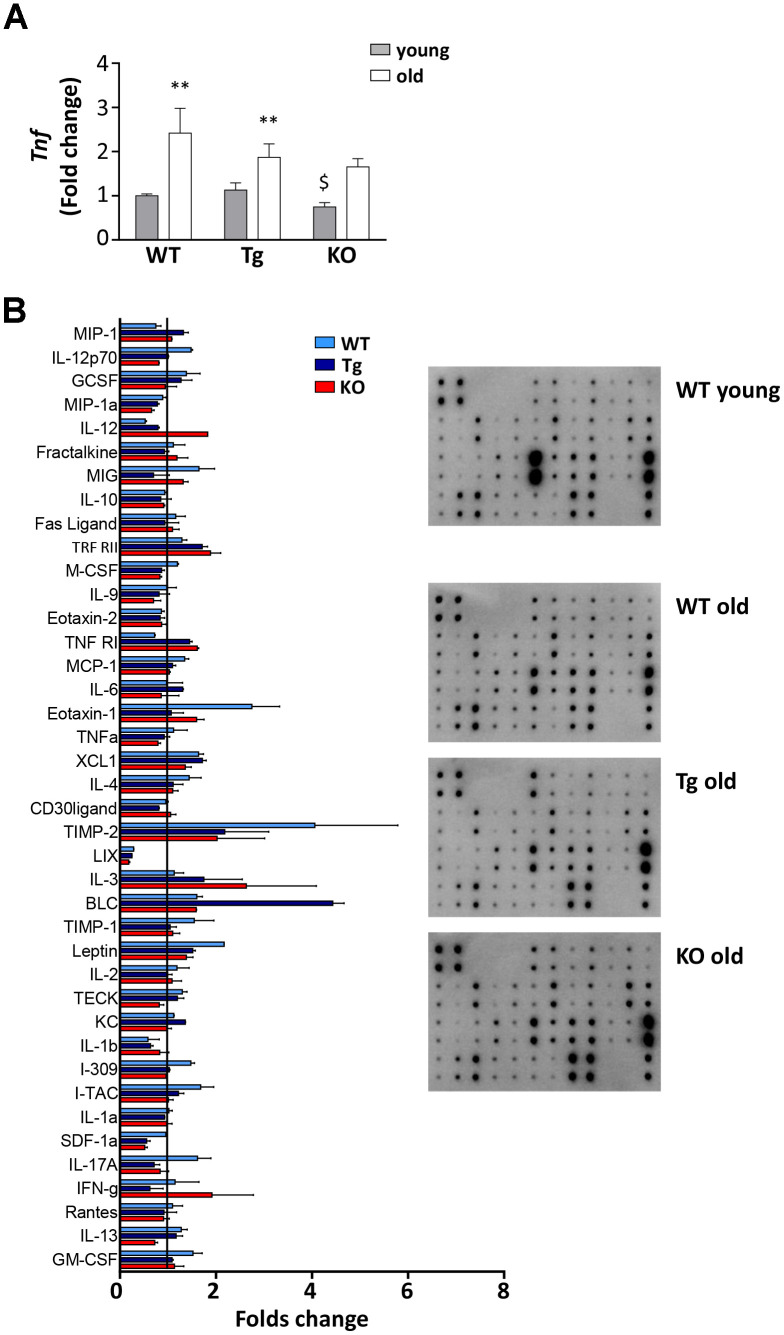
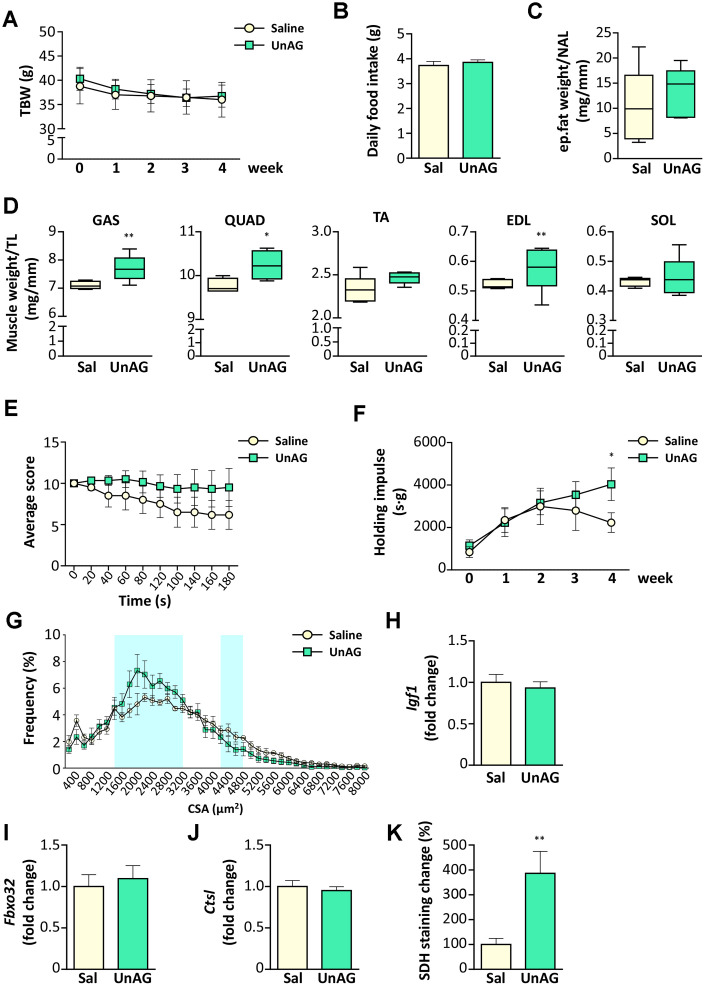
Sarcopenia, the decline in muscle mass and functionality during aging, might arise from age-associated endocrine dysfunction. Ghrelin is a hormone circulating in both acylated (AG) and unacylated (UnAG) forms with anti-atrophic activity on skeletal muscle. Here, we show that not only lifelong overexpression of UnAG (Tg) in mice, but also the deletion of ghrelin gene (Ghrl KO) attenuated the age-associated muscle atrophy and functionality decline, as well as systemic inflammation. Yet, the aging of Tg and Ghrl KO mice occurs with different dynamics: while old Tg mice seem to preserve the characteristics of young animals, Ghrl KO mice features deteriorate with aging. However, young Ghrl KO mice show more favorable traits compared to WT animals that result, on the whole, in better performances in aged Ghrl KO animals. Treatment with pharmacological doses of UnAG improved muscle performance in old mice without modifying the feeding behavior, body weight, and adipose tissue mass. The antiatrophic effect on muscle mass did not correlate with modifications of protein catabolism. However, UnAG treatment induced a strong shift towards oxidative metabolism in muscle. Altogether, these data confirmed and expanded some of the previously reported findings and advocate for the design of UnAG analogs to treat sarcopenia.

Keywords: growth hormone secretagogue receptor; inflammaging; sarcobesity; sarcopenia; skeletal muscle atrophy.


Conflict of interest statement

CONFLICTS OF INTEREST: The authors declare no conflicts of interest.

Figures

Figure 1
Figure 1
Increase of AG and UnAG plasmatic levels during aging in WT mice. Plasmatic levels of AG (A) and UnAG (B) in 3-, 12-, and 24-month-old mice determined by EIA; 3-month-old mice: N = 5, 12-month-old mice N = 8, 24-month-old mice N = 6. Data in bar graph are presented as mean ± SEM. *p<0.05 and **p<0.01 vs. 3-month-old mice.
Figure 2
Figure 2
Body mass composition in young and old WT, Tg, and Ghrl KO mice. (A) Total body weight in 3-month old (young), 6-month old (adult), 12-month old (middle aged), and 24-month old (old) mice. (B) Epidydimal fat mass normalized to nose-to-anus length (NAL) and (C) gastrocnemius weight normalized to the tibial length (TL). Young mice: WT = 6, Tg = 7, Ghrl KO = 5; adult mice: WT = 7, Tg = 4, Ghrl KO = 5; middle aged: WT = 5, Tg = 6, Ghrl KO = 9; old mice: WT= 13, Tg= 14, Ghrl KO = 11. Data in bar graphs are presented as mean ± SEM. For each box plot, the lower and up boundaries denote the 25th and the 75th percentile of each data set, respectively, the horizontal line represents the median, and the whiskers represent the min and max of values. *p<0.05 and **p<0.01 vs. young mice; £p<0.05 and ££p<0.01 vs. adult mice; #p<0.05 and ##p<0.01 vs. middle aged mice; $p<0.05 and $$p<0.01 Tg and Ghrl KO vs. WT.
Figure 3
Figure 3
Muscle functionality and behavior in young and old WT, Tg, and Ghrl KO mice. (A) Average score trend in hanging wire test of 3-month old (young) and 24-month old (old) WT, Tg, and Ghrl KO mice and (B) average holding impulse in the same test. Young mice: WT = 21, Tg = 21, Ghrl KO = 27; old mice: WT = 9, Tg = 16, Ghrl KO = 7. *p<0.05 and **p<0.01 vs WT. (C) Memory was evaluated through the object recognition test and expressed as a discrimination index between a familiar and a novel object (seconds on novel – seconds on familiar)/(seconds on novel + seconds on familiar). (D) Anxiety was assessed as the time spent immobile during 6 minutes of tail suspension. Young mice: WT = 5, Tg = 5, Ghrl KO = 6; old mice: WT = 6, Tg = 7, Ghrl KO = 6. For each box plot, the lower and up boundaries denote the 25th and the 75th percentile of each data set, respectively, the horizontal line represents the median, and the whiskers represent the min and max of values. *p<0.05 and **p<0.01 old vs. young; $p<0.05 and $$p<0.01 Tg and Ghrl KO vs. WT.
Figure 4
Figure 4
Ghrelin peptides effects on sarcopenia-dependent atrophy. (A) Atrogin-1 (Fbxo32) expression in gastrocnemius (GAS) and tibialis anterior (TA) of 3-month old (young) and 24-month old (old) mice determined by real-time RT-PCR. In GAS, young mice: WT = 4, Tg = 4, Ghrl KO = 4; old mice: WT = 4, Tg = 3, Ghrl KO = 4. In TA, young mice: WT = 4, Tg = 3, Ghrl KO = 4; old mice: WT = 8, Tg = 6, Ghrl KO = 5. (B) Cathepsin-L (Ctsl), (C) Bnip-3 (Bnip3), and (D) IGF-1 (Igf1) expression in gastrocnemius of 3-month old (young) and 24-month old (old) mice determined by real-time RT-PCR. Young mice: WT = 3, Tg = 3, Ghrl KO = 4; old mice: WT = 7, Tg = 9, Ghrl KO = 5. (E) Cross-sectional area (CSA) frequency distribution of myofibers in GAS of old WT, Tg, and Ghrl KO mice. WT= 4, Tg= 3, Ghrl KO= 5. The shadowed area of the graph represents the section of statistically significant differences among curves. Data are presented as mean ± SEM. *p<0.05 and **p<0.01 old vs. young; $p<0.05 and $$p<0.01 Tg and Ghrl KO vs. WT.
Figure 5
Figure 5
Metabolic shift in TA muscles of WT, Tg, and Ghrl KO mice. (A) Representative images of succinate dehydrogenase (SDH) staining (scale bars: 200 μm) representing the oxidative capacity of TA muscles of 3-month old (young) and 24-month old (old) mice and quantification of SDH-positive fibers in TA muscle presented as the percentage of SDH-positive area above the total muscle surface. Young mice: WT= 5, Tg= 4, Ghrl KO= 5; old mice: WT= 4, Tg= 3, Ghrl KO= 5. (B) Representative Western blots images and protein densitometry quantification for mitochondrial transcription factor A (TFAM), ATP-synthase β-subunit (β-ATPase), succinate-dehydrogenase complex subunit-A (SDHA), peroxisome proliferator-activated receptor gamma (PPARγ), and PPARγ-coactivator-1-α (PGC1α) protein levels. Protein levels were probed in gastrocnemii of old mice, WT= 4, Tg= 5, Ghrl KO= 5. (C) Representative images of cytochrome c oxidase subunit 4 (COX4) immunofluorescence (scale bars: 200 μm) and quantification. Young mice: WT = 3, Tg = 3, Ghrl KO = 3; old mice: WT = 4, Tg = 4, Ghrl KO = 4. Data are presented as mean ± SEM. *p<0.05 and **p<0.01, old vs. young; $p<0.05 and $$p<0.01, Tg and Ghrl KO vs. WT.
Figure 6
Figure 6
Inflammatory response in old WT, Tg, and Ghrl KO mice. (A) TNF-α (Tnf) expression in epididymal fat of 3-month old (young) and 24-month old (old) WT, Tg, and Ghrl KO mice, determined by real-time RT-PCR. Data in bar graph are presented as mean ± SEM. Young mice: WT= 3, Tg= 4, Ghrl KO = 4; old mice: WT= 5, Tg= 7, Ghrl KO = 5. (B) Serum biomarkers involved in systemic inflammation normalized on the levels in young WT mice (reference line). Young mice WT=4; old mice: WT= 4, Tg= 4, Ghrl KO = 4 pulled into two groups. Data in bar graph are presented as mean ± SD. *p<0.05 and **p<0.01, old vs. young; $p<0.05 Tg and Ghrl KO vs. WT.
Figure 7
Figure 7
Exogenous administration of UnAG in old WT mice attenuates age-related muscle decline. UnAG 100 μg/Kg was injected daily i.p. for 28 days to 18-month-old mice (N = 6). Age- and weight-matched controls were injected with saline (N =6). (A) Total body weight; (B) daily food intake; (C) change in epidydimal fat mass normalized to nose-to-anus length (NAL) and in (D) muscle mass normalized to the tibial length (TL). GAS: gastrocnemius, SOL: soleus, QUAD: quadriceps, TA: tibialis anterior, EDL: extensor digitorum longus. (E) Average score trend in hanging wire test and (F) average holding impulse. (G) Cross-sectional area (CSA) frequency distribution of myofibers in GAS. The shadowed areas of the graph represent the sections of statistically significant differences among curves. (H) IGF-1 (Igf1), (I) Atrogin-1 (Fbxo32), and (J) Cathepsin-L (Ctsl) expression in gastrocnemius determined by real-time RT-PCR. (K) Quantification of SDH staining in TA muscle presented as the percentage of SDH-positive area above the total muscle surface. Data in bar graph are presented as mean ± SEM. For box plots, the lower and up boundaries denote the 25th and the 75th percentile of each data set, respectively, the horizontal line represents the median, and the whiskers represent the min and max of values. *p<0.05 and **p<0.01 vs. saline-treated controls.

References

    1. Wang H, Hai S, Cao L, Zhou J, Liu P, Dong BR. Estimation of prevalence of sarcopenia by using a new bioelectrical impedance analysis in Chinese community-dwelling elderly people. BMC Geriatr. 2016; 16:216. 10.1186/s12877-016-0386-z - DOI - PMC - PubMed
    1. Landi F, Liperoti R, Russo A, Giovannini S, Tosato M, Capoluongo E, Bernabei R, Onder G. Sarcopenia as a risk factor for falls in elderly individuals: results from the ilSIRENTE study. Clin Nutr. 2012; 31:652–58. 10.1016/j.clnu.2012.02.007 - DOI - PubMed
    1. Bokshan SL, DePasse JM, Daniels AH. Sarcopenia in orthopedic surgery. Orthopedics. 2016; 39:e295–300. 10.3928/01477447-20160222-02 - DOI - PubMed
    1. Chung HY, Kim DH, Lee EK, Chung KW, Chung S, Lee B, Seo AY, Chung JH, Jung YS, Im E, Lee J, Kim ND, Choi YJ, et al.. Redefining chronic inflammation in aging and age-related diseases: proposal of the senoinflammation concept. Aging Dis. 2019; 10:367–82. 10.14336/AD.2018.0324 - DOI - PMC - PubMed
    1. Kojima M, Hosoda H, Date Y, Nakazato M, Matsuo H, Kangawa K. Ghrelin is a growth-hormone-releasing acylated peptide from stomach. Nature. 1999; 402:656–60. 10.1038/45230 - DOI - PubMed

Publication types

MeSH terms