

Medication utilization in patients in New York hospitals during the COVID-19 pandemic
- PMID: 32712675
- PMCID: PMC7454318
- DOI: 10.1093/ajhp/zxaa251
Medication utilization in patients in New York hospitals during the COVID-19 pandemic
Abstract
Purpose: Utilization of hydroxychloroquine, chloroquine, and supportive therapy drugs in hospitals in New York during the early weeks of the coronavirus disease 2019 (COVID-19) pandemic was analyzed.
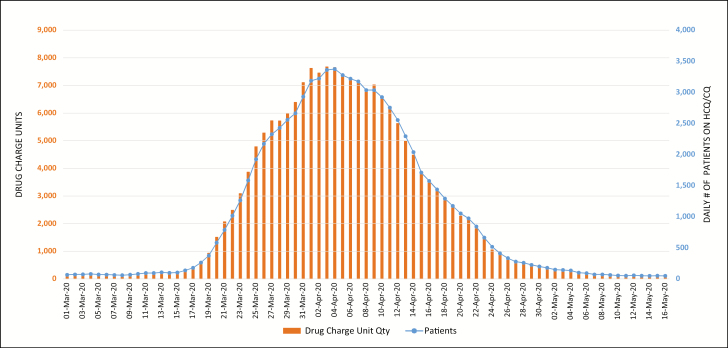
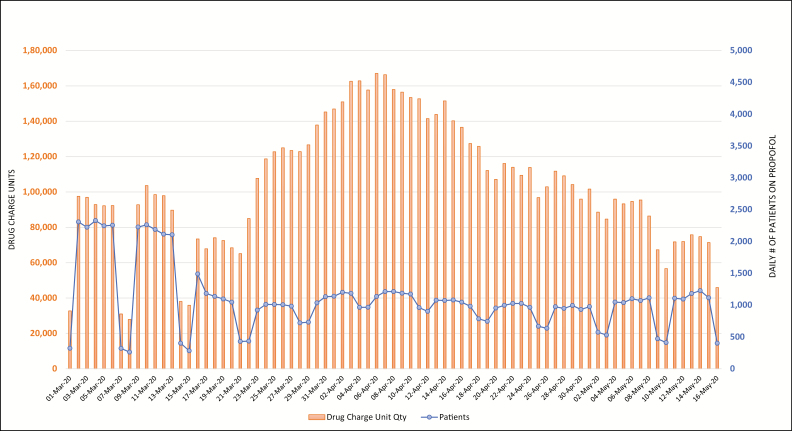
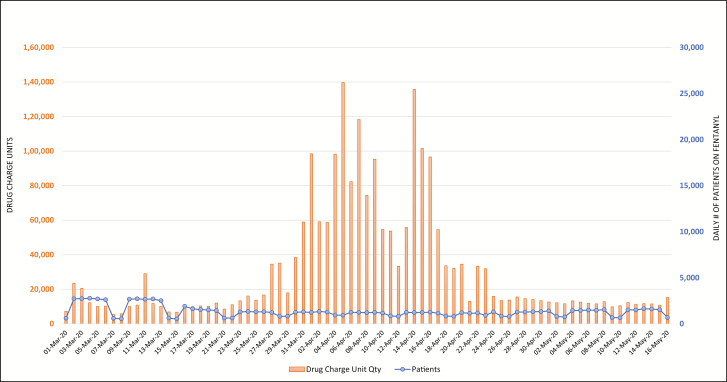
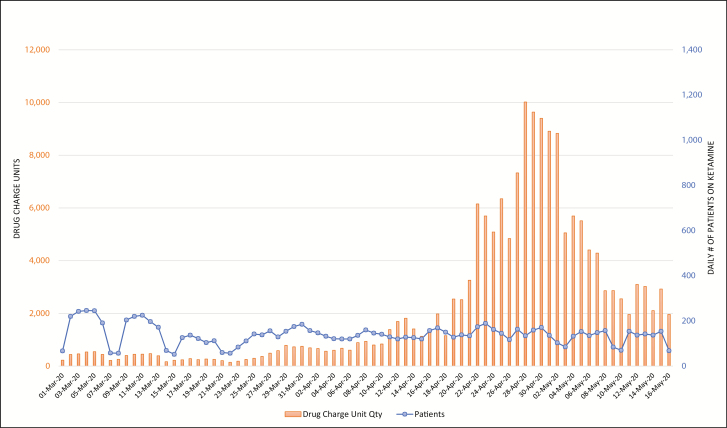
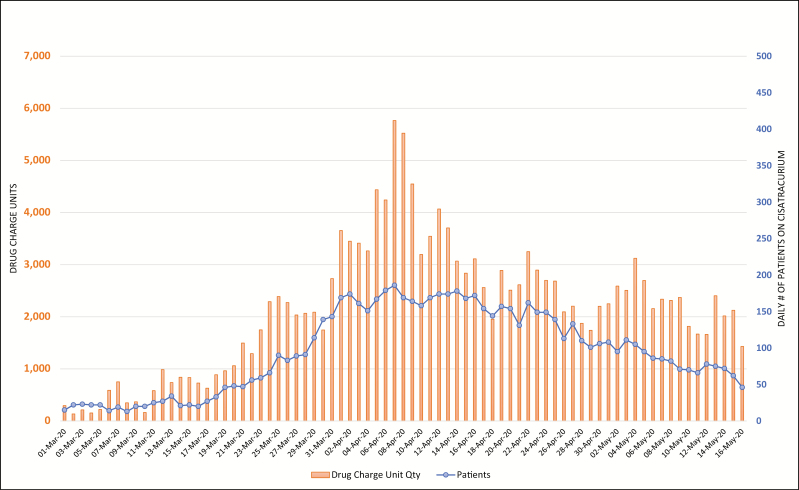
Summary: Drug utilization trends for 7 medications used to treat patients with suspected or confirmed COVID-19 at 47 New York hospitals were identified. The data demonstrated sharp increases in aggregate utilization of hydroxychloroquine and chloroquine and the number of patients receiving either drug beginning on March 15, with a notable 20% median increase per day through March 31. The net quantity of drug charge units per day for midazolam, propofol, ketamine, cisatracurium, and fentanyl also increased during the study period. Following peak utilization, use of all study drugs decreased at different times throughout April 2020. The data were used to provide information to various stakeholders in the drug supply chain during the initial surge of the pandemic.
Conclusion: This analysis describes the increased use, beginning in mid-March 2020, of hydroxychloroquine, chloroquine, midazolam, propofol, ketamine, cisatracurium, and fentanyl in 47 hospitals in New York State. The increased utilization of supportive therapy drugs was consistent with the surge in patients with presumed or confirmed COVID-19 during the study period. These data and observations can help clinicians, health-system leaders, manufacturers, wholesalers, and policymakers understand the impact of current and future pandemics on the drug supply chain.
Keywords: COVID-19; SARS-COV-2; coronavirus; hydroxychloroquine; pandemic; real-world data.
© American Society of Health-System Pharmacists 2020. All rights reserved. For permissions, please e-mail: journals.permissions@oup.com.
Figures

References
-
- World Health Organization. Statement on the second meeting of the International Health Regulations (2005) Emergency Committee regarding the outbreak of novel coronavirus (2019-nCoV) https://www.who.int/news-room/detail/30-01-2020-statement-on-the-second-...). Accessed April 13, 2020.
-
- Johns Hopkins University & Medicine. Coronavirus resource center https://coronavirus.jhu.edu/map.html. Accessed April 13, 2020.
-
- Centers for Disease Control and Prevention. Geographic differences in COVID-19 cases, deaths, and incidence — United States, February 12–April 7, 2020 https://www.cdc.gov/mmwr/volumes/69/wr/mm6915e4.htm. Accessed April 18, 2020. - PMC - PubMed
-
- Centers for Disease Control and Prevention. Situation summary https://www.cdc.gov/coronavirus/2019-ncov/cases-updates/summary.html#cov.... Accessed April 13, 2020.
MeSH terms
Substances
LinkOut - more resources
Full Text Sources
Medical
Miscellaneous
