. 2021 Feb;78(4):1655-1688.
doi: 10.1007/s00018-020-03603-x. Epub 2020 Jul 25.

Understanding COVID-19 via comparative analysis of dark proteomes of SARS-CoV-2, human SARS and bat SARS-like coronaviruses

Affiliations

Understanding COVID-19 via comparative analysis of dark proteomes of SARS-CoV-2, human SARS and bat SARS-like coronaviruses

Rajanish Giri et al. Cell Mol Life Sci. 2021 Feb.

Abstract

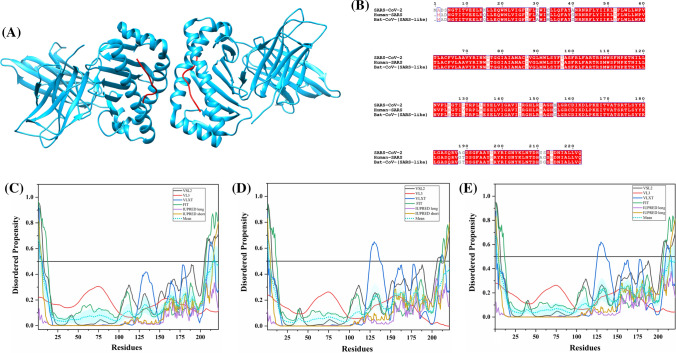
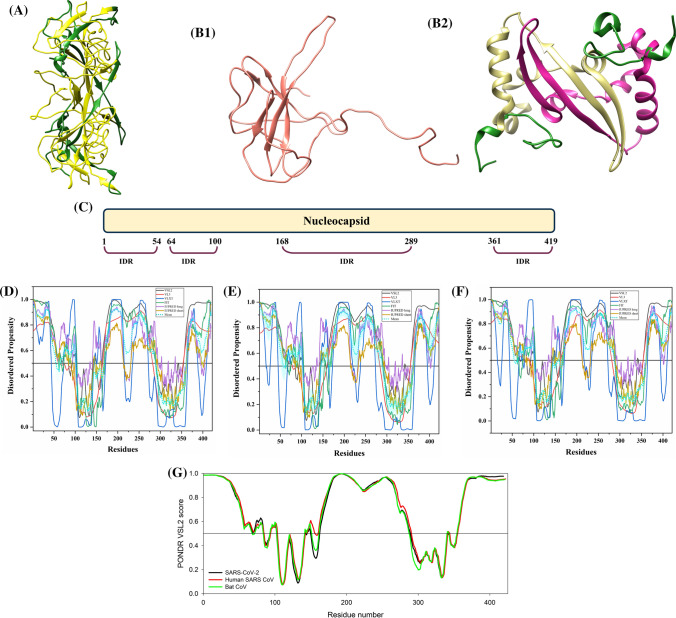
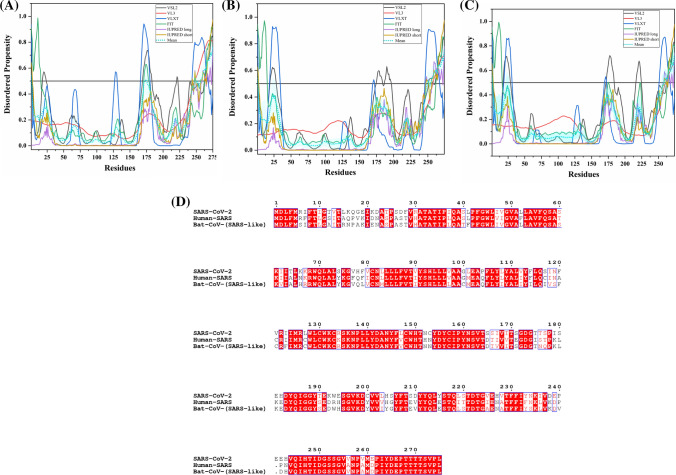
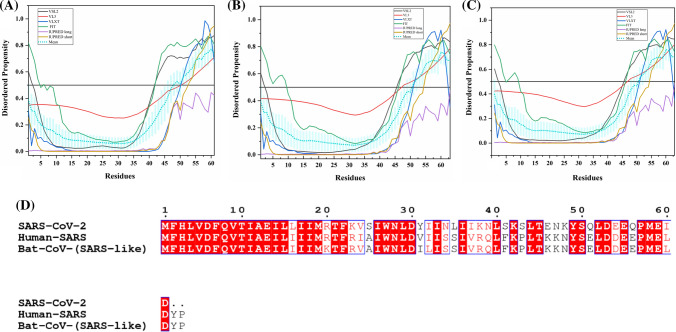
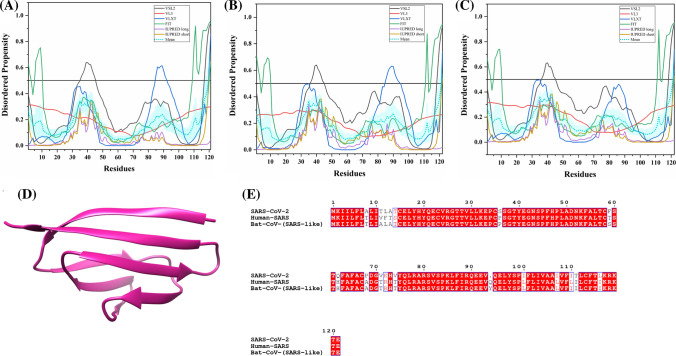
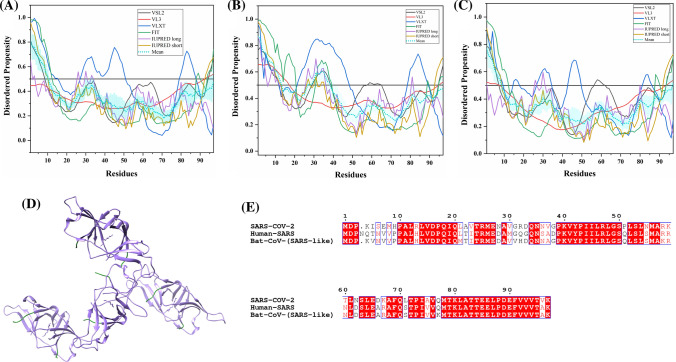
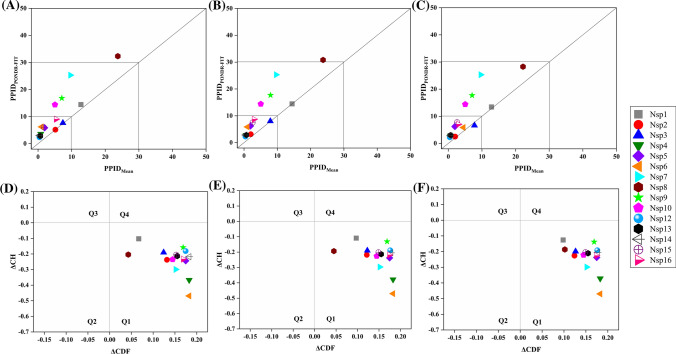
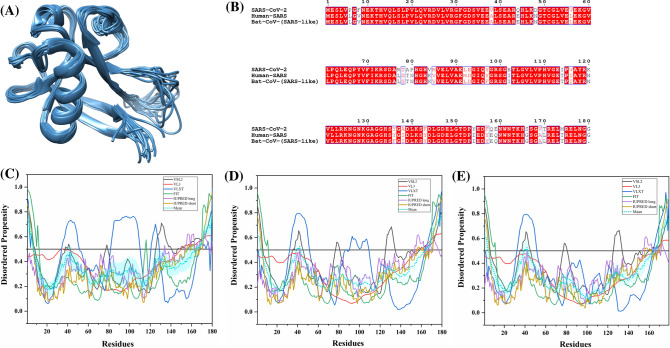
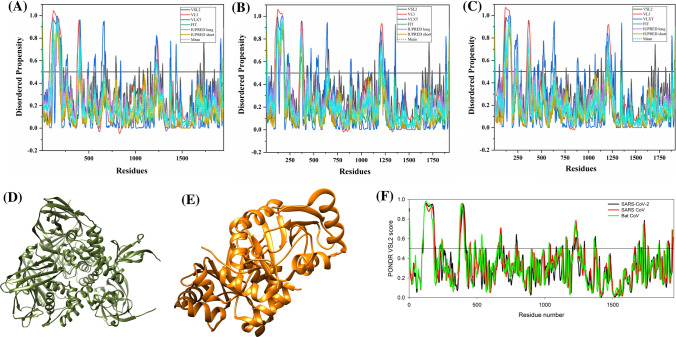
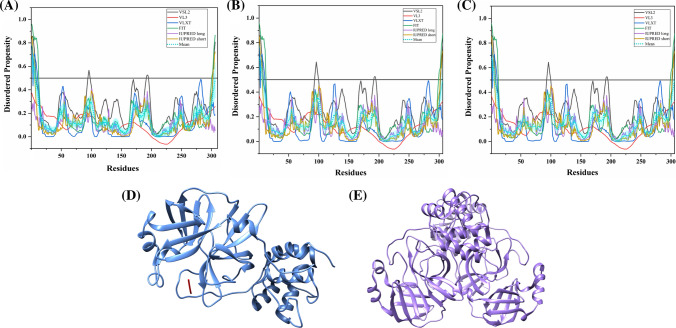
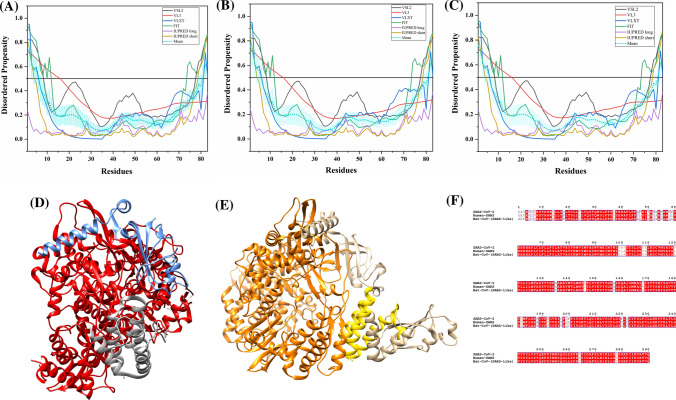
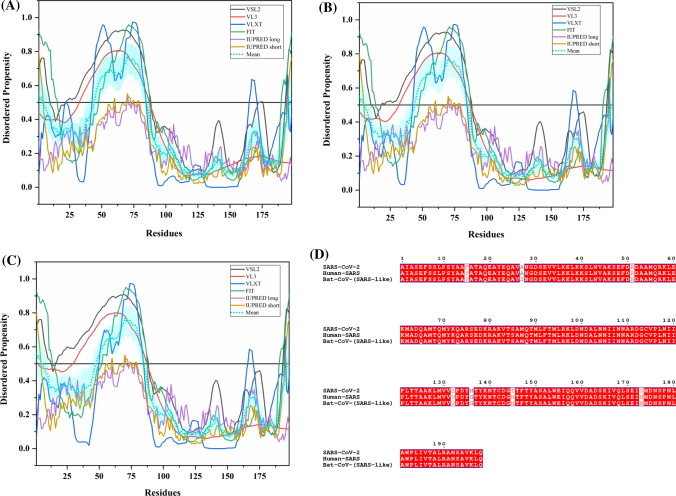
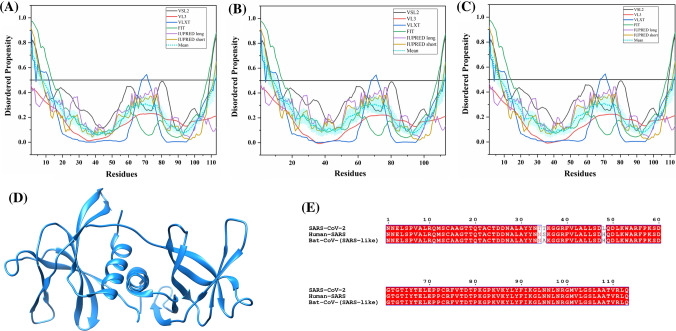
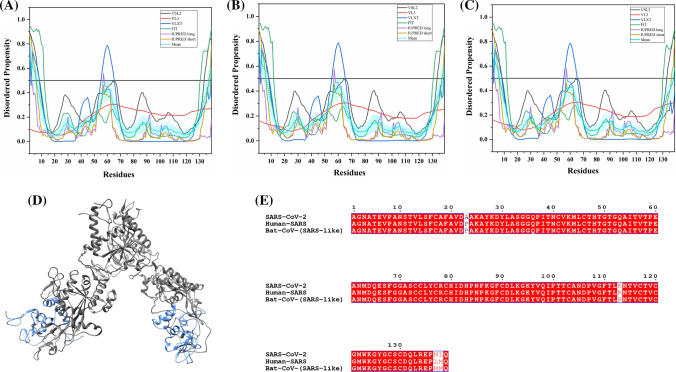
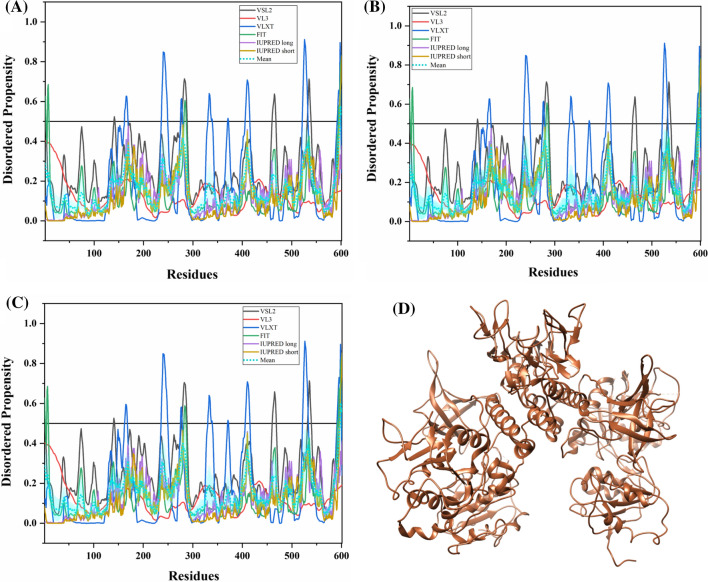
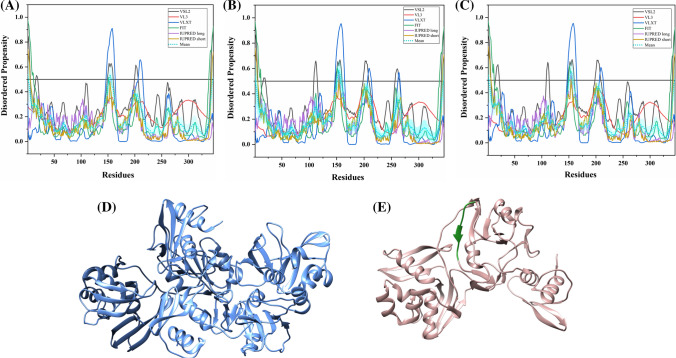
The recently emerged coronavirus designated as SARS-CoV-2 (also known as 2019 novel coronavirus (2019-nCoV) or Wuhan coronavirus) is a causative agent of coronavirus disease 2019 (COVID-19), which is rapidly spreading throughout the world now. More than 1.21 million cases of SARS-CoV-2 infection and more than 67,000 COVID-19-associated mortalities have been reported worldwide till the writing of this article, and these numbers are increasing every passing hour. The World Health Organization (WHO) has declared the SARS-CoV-2 spread as a global public health emergency and admitted COVID-19 as a pandemic now. Multiple sequence alignment data correlated with the already published reports on SARS-CoV-2 evolution indicated that this virus is closely related to the bat severe acute respiratory syndrome-like coronavirus (bat SARS-like CoV) and the well-studied human SARS coronavirus (SARS-CoV). The disordered regions in viral proteins are associated with the viral infectivity and pathogenicity. Therefore, in this study, we have exploited a set of complementary computational approaches to examine the dark proteomes of SARS-CoV-2, bat SARS-like, and human SARS CoVs by analysing the prevalence of intrinsic disorder in their proteins. According to our findings, SARS-CoV-2 proteome contains very significant levels of structural order. In fact, except for nucleocapsid, Nsp8, and ORF6, the vast majority of SARS-CoV-2 proteins are mostly ordered proteins containing less intrinsically disordered protein regions (IDPRs). However, IDPRs found in SARS-CoV-2 proteins are functionally important. For example, cleavage sites in its replicase 1ab polyprotein are found to be highly disordered, and almost all SARS-CoV-2 proteins contains molecular recognition features (MoRFs), which are intrinsic disorder-based protein-protein interaction sites that are commonly utilized by proteins for interaction with specific partners. The results of our extensive investigation of the dark side of SARS-CoV-2 proteome will have important implications in understanding the structural and non-structural biology of SARS or SARS-like coronaviruses.

Keywords: Coronavirus disease 2019; Intrinsically disordered proteins; Molecular recognition features; Nucleotide-binding regions; SARS coronavirus.


Conflict of interest statement

All authors declare that there is no financial conflict of interest.

Figures

Fig. 1
Fig. 1
Genome architecture of SARS-CoV-2. As a positive single-stranded RNA virus, SARS-CoV-2 contains a 5′ capped RNA which has a leader sequence (LS), poly-A tail at the 3′ end, and 5′ and 3′ UTR. It contains the following genes: ORF1a, ORF1b, spike (S), ORF3a, ORF3b, envelope (E), membrane (M), ORF6, ORF7a, ORF7b, ORF8, ORF9b, ORF14, nucleocapsid (N), and ORF10
Fig. 2
Fig. 2
Analysis of overall disorder status of proteins of SARS-CoV-2, human SARS, and bat CoV (SARS-like): 2D plots representing PPIDPONDR-FIT vs. PPIDMean for a SARS-CoV-2, b human SARS and c bat CoV. In the CH–CDF plot of the proteins of d SARS-CoV-2, e human SARS and f bat CoV, the Y coordinate of each protein spot signifies the distance of corresponding protein from the boundary in the CH plot and X coordinate value corresponds to the average distance of CDF curve for respective protein from the CDF boundary
Fig. 3
Fig. 3
Structure and intrinsic disorder propensity of spike glycoprotein (S) from CoVs. a A 3.50 Å resolution structure (PDB ID: 6VSB) of SARS-CoV-2 S obtained through cryo-EM. This homotrimeric structure includes three chains, A (pink), B (dark grey), and C (turquoise). b A 3.6 Å resolution cryo-EM structure (PDB ID: 6ACC) of human SARS S protein complexed with its host-binding partner ACE2. In this structure, three chains are present: A (pink), B (green) and C (dark khaki). Evaluation of intrinsic disorder predisposition in S proteins of c SARS-CoV-2, d human SARS, and e bat CoVs. Graphs ce depict the disorder profiles generated using six predictors: PONDR® VSL2 (black line), PONDR® VL3 (red line), PONDR® VLXT (blue line), PONDR® FIT (green line), IUPred long (purple line) and IUPred short (golden line). The mean disorder propensity calculated by averaging the disorder scores from all predictors is represented by a short dotted line (sky blue) in graphs. The light sky blue shadow region signifies the mean error distribution. f Aligned disorder profiles generated for all three S proteins is based on the outputs of the PONDR® VSL2
Fig. 4
Fig. 4
Analysis of structural features and intrinsic disorder predisposition of envelope glycoprotein (E). a NMR solution structure (PDB ID: 2MM4) of human SARS E protein (residues 8–65). b Multiple sequence alignment (MSA) profile of all three E proteins. Graphs ce represent the intrinsic disorder profiles of E proteins of c SARS-CoV-2, d human SARS, and e bat CoVs. Color schemes are similar to given in Fig. 3
Fig. 5
Fig. 5
Analysis of intrinsic disorder propensity of membrane glycoprotein (M). a A 2.20 Å resolution crystal structure (PDB ID: 3I6G) of human SARS M protein (residues 88–96) in complex with A-2 α chain of HLA class I histocompatibility antigen and β2-microglobulin. Chains in this dimer corresponding to M are shown in red, while A-2 α chain and β2-microglobulin complex are shown using ice blue colour. b MSA profile of all three M proteins. Graphs ce represent intrinsic disorder profiles of M protein of c SARS-CoV-2, d human SARS, and e bat CoV. Color schemes are similar to those given in Fig. 3
Fig. 6
Fig. 6
Analysis of the structural properties and intrinsic disorder propensity of the nucleocapsid (N) protein. a 1.70 Å resolution structure (PDB ID: 6VYO) of RNA-binding domain of SARS-CoV-2 N obtained using X-ray diffraction. Residues 64–100 are found to be disordered which are represented with forest green colour. b1 NMR solution structure (PDB ID: 1SSK) of the NTD (residues 45–181) of human SARS N. b2 X-ray diffraction-based crystal structure (PDB ID: 2GIB) of CTD (residues 270–366) of human SARS N. The structure is a homodimer of chains A (violet-red) and B (dark khaki). Residues 270–289 and 362–366 showing disorder propensity are represented using forest green colour. c Representation of predicted disordered regions in SARS-CoV-2 N protein. Graphs df shows the intrinsic disorder profiles of N protein of d SARS-CoV-2, e human SARS, and f bat CoV. g Aligned disorder profiles generated for all three N proteins is based on the outputs of PONDR® VSL2. Color schemes are similar to given in Fig. 3
Fig. 7
Fig. 7
Analysis of intrinsic disorder propensity of ORF3a protein. Graphs ac represent intrinsic disorder profiles of ORF3a protein of a SARS-CoV-2, b human SARS, and c bat CoV. d MSA profile of all three ORF3a proteins. Color schemes are similar to those given in Fig. 3
Fig. 8
Fig. 8
Analysis of intrinsic disorder propensity of ORF3b protein. Graphs ac represent intrinsic disorder profiles of ORF3b protein of a SARS-CoV-2, b human SARS, and c bat CoV. d MSA profile of all three ORF3b proteins. Color schemes are similar to those given in Fig. 3
Fig. 9
Fig. 9
Analysis of intrinsic disorder propensity of ORF6 protein. Graphs ac represent the intrinsic disorder profiles of ORF6 protein of a SARS-CoV-2, b human SARS, and c bat CoV. d MSA profile of all three ORF6 proteins. Colour schemes are similar to those given in Fig. 3
Fig. 10
Fig. 10
Analysis of intrinsic disorder propensity of ORF7a protein. Graphs ac represent the intrinsic disorder profiles of ORF7a protein of a SARS-CoV-2, b human SARS, and c bat CoV. d A 1.8 Å resolution X-ray diffraction-based structure (PDB ID:1XAK) of human SARS ORF7a protein (residues 14–96) is illustrated using pink colour. e MSA profile of all three ORF7a proteins. Color schemes are similar to those given in Fig. 3
Fig. 11
Fig. 11
Analysis of intrinsic disorder propensity of ORF9b protein. Graphs ac represent intrinsic disorder profiles of ORF9b protein of a SARS-CoV-2, b Human SARS, and c bat CoV. d A 2.8 Å resolution crystal structure (PDB ID: 2CME) of human SARS ORF9b protein. The structure includes four ORF9b homodimers where chains A–H are shown in purple colour and disordered residues (1–10) are depicted in green. e MSA profile of all three ORF9b proteins. Color schemes are similar to those given in Fig. 3
Fig. 12
Fig. 12
Analysis of overall intrinsic disorder status of non-structural proteins (Nsps): 2D plot representing PPIDPONDR-FIT vs PPIDMean in a SARS-CoV-2 b human SARS and c bat CoV. In CH–CDF plot of the proteins of d SARS-CoV-2 e human SARS and f bat CoV, the Y coordinate of each protein spot signifies the distance of the corresponding protein from the boundary in the CH plot and the X coordinate value corresponds to the average distance of the CDF curve for the respective protein from the CDF boundary
Fig. 13
Fig. 13
Intrinsic disorder at the cleavage sites of the replicase 1ab polyprotein of human SARS. Plots an denotes the cleavage sites (magenta coloured bar for PL-Pro protease and grey coloured bar for 3CL-Pro protease) in relation to disordered regions present between the individual proteins (Nsp1-16) of replicase 1ab polyprotein of human SARS. All proteins are represented by different colored horizontal bars
Fig. 14
Fig. 14
Analysis of intrinsic disorder propensity of non-structural protein 1 (Nsp1). a NMR solution structure (PDB ID: 2GDT) of 13–128 residue fragment of human SARS Nsp1. b MSA profile of all three Nsp1 proteins. Graphs ce represent the intrinsic disorder profiles of Nsp1 protein of c SARS-CoV-2, d Human SARS, and e bat CoV. Color schemes are similar to those given in Fig. 3
Fig. 15
Fig. 15
Analysis of intrinsic disorder propensity of Nsp3. Graphs ac represent the intrinsic disorder profiles of Nsp3 protein of a SARS-CoV-2, b human SARS, and c bat CoV. d A 1.85 Å resolution crystal structure (PDB ID: 2FE8) of residues 723–1036 of Nsp3 of human SARS CoV. e A 1.45 Å resolution crystal structure (PDB ID: 6W6Y) of ADP ribose phosphatase of Nsp3 [residues 207–374 (orange colour)] of SARS CoV-2. f Aligned disorder profiles generated for all three Nsp3 is based on the outputs of the PONDR® VSL2. Colour schemes are similar to those given in Fig. 3
Fig. 16
Fig. 16
Analysis of intrinsic disorder propensity of Nsp5. Graphs ac represent intrinsic disorder profiles of Nsp5 protein of a SARS-CoV-2, b human SARS, and c bat CoV. Colour schemes are similar to those given in Fig. 3. d A 2.16 Å X-ray diffraction-based crystal structure (PDB ID: 6LU7) of SARS-CoV-2 Nsp5 in complex with its inhibitor N3. e A 1.50 Å crystal structure (PDB ID: 5C5O) of Nsp5 of human SARS CoV
Fig. 17
Fig. 17
Analysis of intrinsic disorder propensity of Nsp7. Graphs ac represent intrinsic disorder profiles of Nsp7 protein of a SARS-CoV-2, b human SARS, and c bat CoV. d A 2.90 Å resolution structure (PDB ID: 6M71) of SARS-CoV-2 Nsp12 with its cofactors Nsp7 and Nsp8. Chain A represents Nsp12 of residues 31–50, 69–102, 112–895, 906–919 (red colour), chain C represents Nsp7 of residues 2–71 (blue colour), and chains B and D represent Nsp8 from residues 84–122 and 129–132 (dark grey colour). e A 3.10 Å resolution cryo-EM structure (PDB ID: 6NUR) of Nsp12–Nsp8–Nsp7 complex. Chain C includes 2–71 residues of Nsp7 (gold colour), chains B and D (dark khaki) represent 77–191 residues of Nsp8 and chain A signifies residues 117–896 and 907–920 of Nsp12 (RNA-directed RNA polymerase) (orange colour) from human SARS CoV. f MSA profile of all three Nsp7 proteins. Colour schemes are similar to those given in Fig. 3
Fig. 18
Fig. 18
Analysis of intrinsic disorder propensity of Nsp8. Graphs ac represent intrinsic disorder profiles of Nsp8 protein of a SARS-CoV-2, b human SARS, and c bat CoV. d MSA profile of all three Nsp8 proteins. Colour schemes are similar to those given in Fig. 3
Fig. 19
Fig. 19
Analysis of intrinsic disorder propensity of Nsp9. Graphs ac represent the intrinsic disorder profiles of Nsp9 protein of a SARS-CoV-2, b human SARS, and c bat CoV. d A 2.70 Å crystal structure (PDB ID: 1QZ8) of residues 3–113 of human SARS Nsp9. e MSA profile of all three Nsp9 proteins. Colour schemes are similar to those given in Fig. 3
Fig. 20
Fig. 20
Analysis of intrinsic disorder propensity of Nsp10. Graphs ac represent the intrinsic disorder profiles of Nsp10 protein of a SARS-CoV-2, b human SARS, and c bat CoV. d A 3.20 Å crystal structure (PDB ID: 5C8T) of SARS CoV Nsp10/Nsp14 complex. In this structure, A and C chains (cornflower blue colour) signifies 1–131 residues of Nsp10, while B and D chains corresponds to residues 1–453 and 465–525 of Nsp14 (dim grey colour). e MSA profile of all three Nsp10 proteins. Colour schemes are similar to those given in Fig. 3
Fig. 21
Fig. 21
Analysis of intrinsic disorder propensity of Nsp13. Graphs ac represent intrinsic disorder profiles of Nsp13 protein of a SARS-CoV-2, b human SARS, and c bat CoV. Colour schemes are similar to those given in Fig. 3. d A 2.80 Å crystal structure (PDB ID: 6JYT) of human SARS Nsp13 (residues 1–596)
Fig. 22
Fig. 22
Analysis of intrinsic disorder propensity of Nsp15. Graphs ac represent intrinsic disorder profiles of Nsp15 protein of a SARS-CoV-2, b human SARS, and c bat CoV. Colour schemes are similar to given in Fig. 3. d A 1.9 Å resolution structure (PDB ID: 6W01) of Nsp15 of SARS CoV-2 consisting of 207–374 residues is represented in cornflower blue colour. e A 2.60 Å crystal structure (PDB ID: 2H85) of Nsp15 from human SARS CoV (rosy brown colour) where residues 151–157 predicted to be disordered are represented in forest green colour
Fig. 23
Fig. 23
Analysis of intrinsic disorder propensity of Nsp16. Graphs ac represent the intrinsic disorder profiles of Nsp9 protein of a SARS-CoV-2, b human SARS, and c bat CoV. Colour schemes are similar to those given in Fig. 3. d A 1.95 Å resolution crystal structure (PDB ID: 6W75) of the Nsp10–Nsp16 complex of SARS-CoV-2. Nsp16 of residues 2–298 is represented using pink colour, while Nsp10 of residues 18–139 is shown in cornflower blue colour. e A 2.60 Å crystal structure (PDB ID: 3R24) of human SARS Nsp10–Nsp16 complex. Chain A shown in turquoise colour corresponds to residues 3–294 of Nsp16

References

    1. Yang X, Yu Y, Xu J, et al. Clinical course and outcomes of critically ill patients with SARS-CoV-2 pneumonia in Wuhan, China: a single-centered, retrospective, observational study. Lancet Respir Med. 2020 doi: 10.1016/S2213-2600(20)30079-5. - DOI - PMC - PubMed
    1. Coronavirus disease 2019. https://www.who.int/emergencies/diseases/novel-coronavirus-2019. Accessed 29 Feb 2020
    1. Gorbalenya AE, Enjuanes L, Ziebuhr J, Snijder EJ. Nidovirales: evolving the largest RNA virus genome. Virus Res. 2006;117:17–37. doi: 10.1016/j.virusres.2006.01.017. - DOI - PMC - PubMed
    1. Corman VM, Lienau J, Witzenrath M. Coronaviruses as the cause of respiratory infections. Internist. 2019;60:1136–1145. doi: 10.1007/s00108-019-00671-5. - DOI - PMC - PubMed
    1. Woo PCY, Lau SKP, Lam CSF, et al. Discovery of seven novel mammalian and avian coronaviruses in the genus deltacoronavirus supports bat coronaviruses as the gene source of alphacoronavirus and betacoronavirus and avian coronaviruses as the gene source of gammacoronavirus and deltacoronavirus. J Virol. 2012;86:3995–4008. doi: 10.1128/jvi.06540-11. - DOI - PMC - PubMed

LinkOut - more resources