

This is a preprint.
Clinical Features of COVID-19 and Factors Associated with Severe Clinical Course: A Systematic Review and Meta-analysis
- PMID: 32714109
- PMCID: PMC7366815
- DOI: 10.2139/ssrn.3566166
Clinical Features of COVID-19 and Factors Associated with Severe Clinical Course: A Systematic Review and Meta-analysis
Abstract
Background: COVID-19 is a new disease which has become a global pandemic, and is caused by a novel coronavirus, SARS-CoV-2. The disease is still not very well characterized, and factors associated with severe clinical course are not well known.
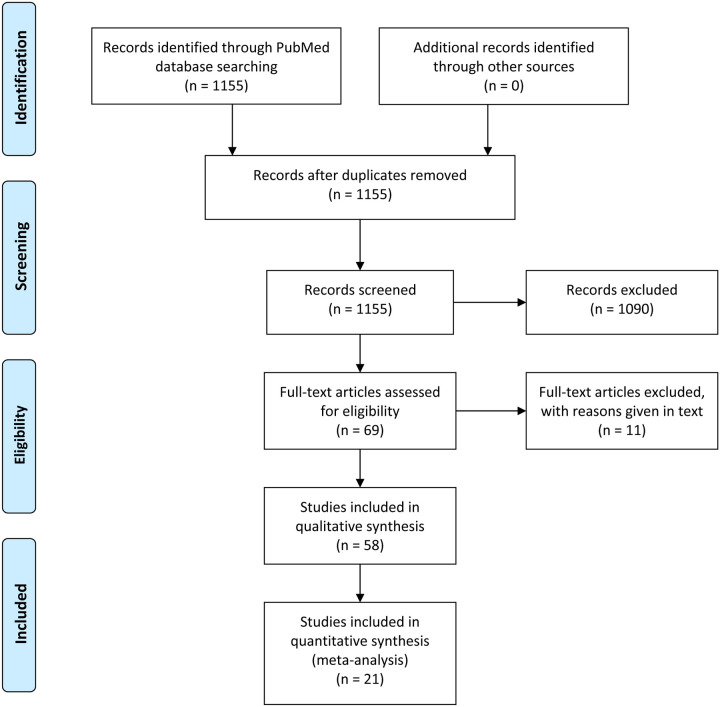
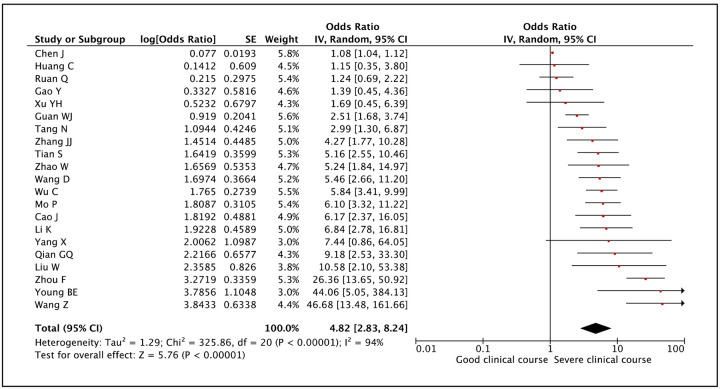
Methods: The main objectives were to determine the demographic, clinical and laboratory manifestations of COVID-19 and to identify the factors associated with severe clinical course. We searched the PubMed for studies published between Jan 1, 2020 and Mar 17, 2020, and included them if they were in English language, published in full, were retrospective or prospective observational or case control study with data on clinical, laboratory and imaging features of adult patients with COVID-19 disease from single or multiple centers. Studies that included exclusively pediatric patients were excluded. The demographic, clinical and laboratory data was displayed as n (%) or mean (SD). The meta-analysis on factors associated with severe clinical course was performed using the random effects model, and odds ratios (ORs) with 95% confidence intervals (CIs) were calculated as the effect sizes.
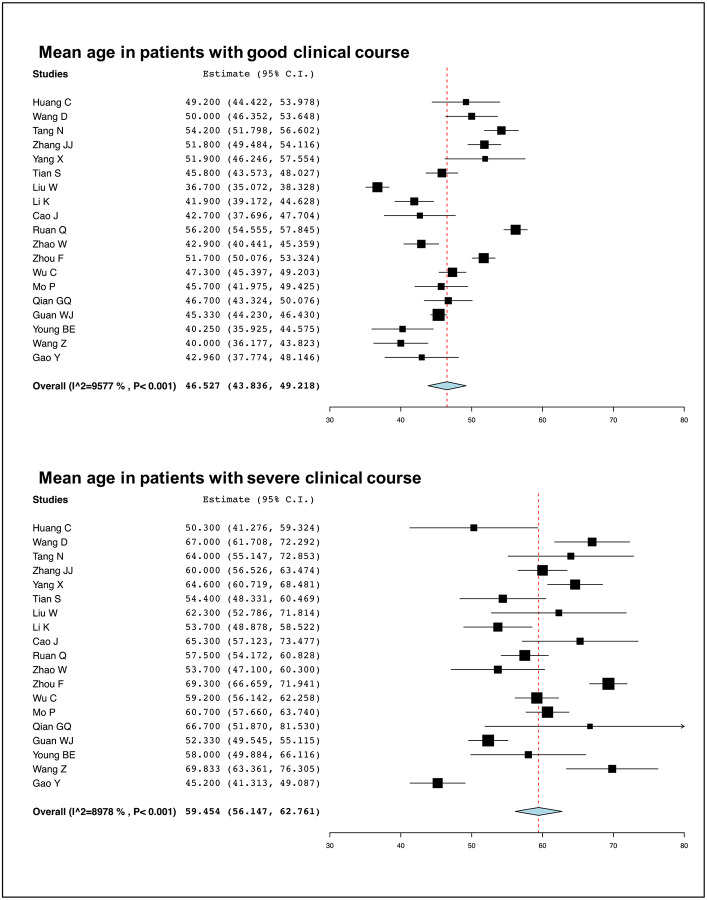
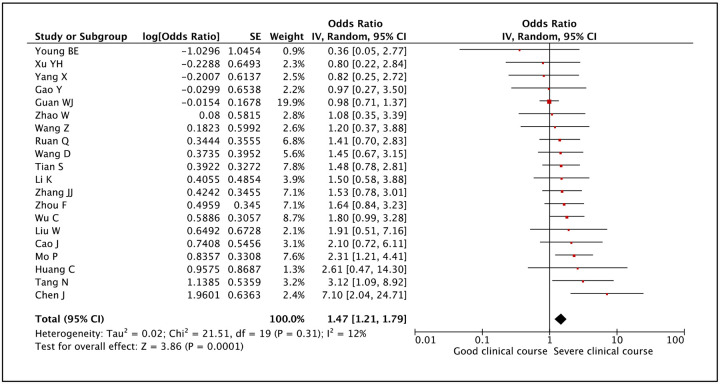
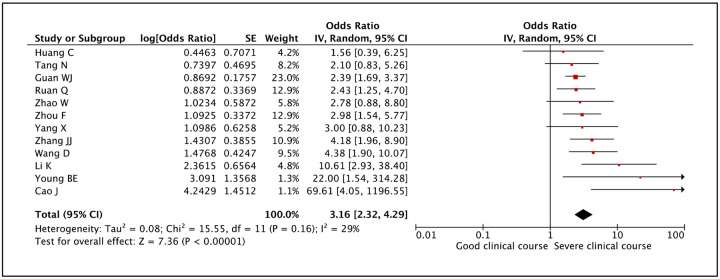
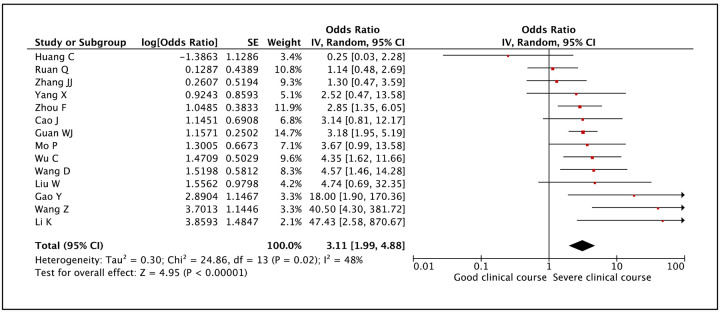
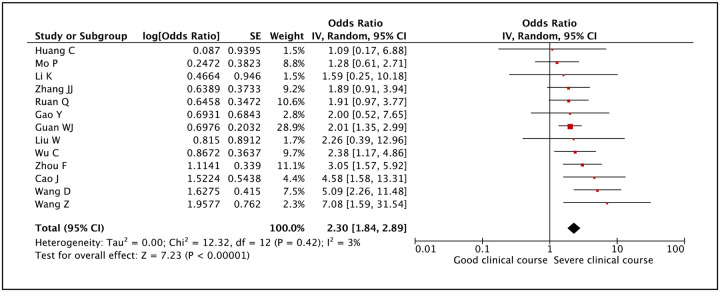
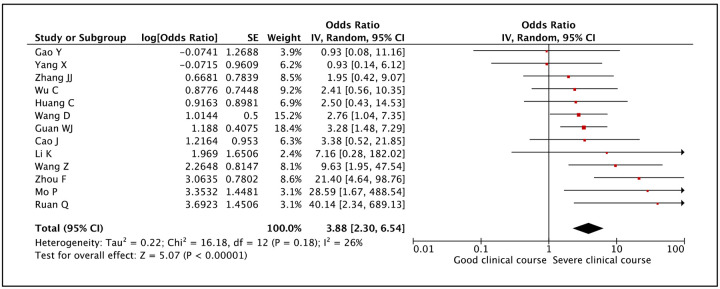
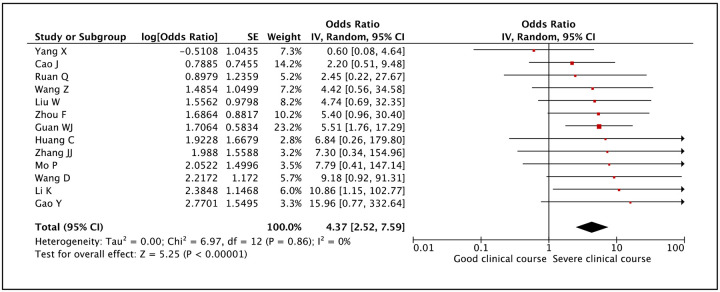
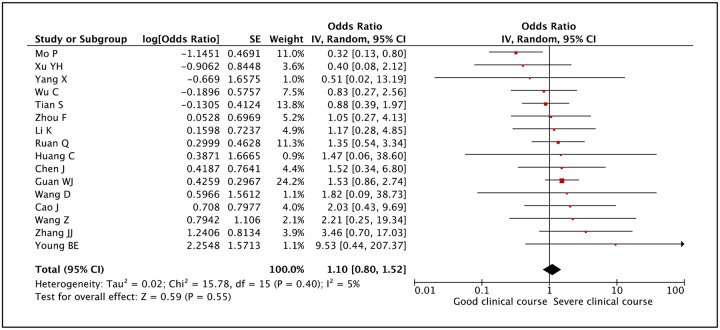
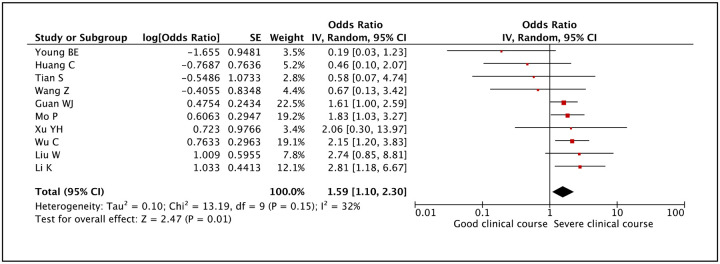
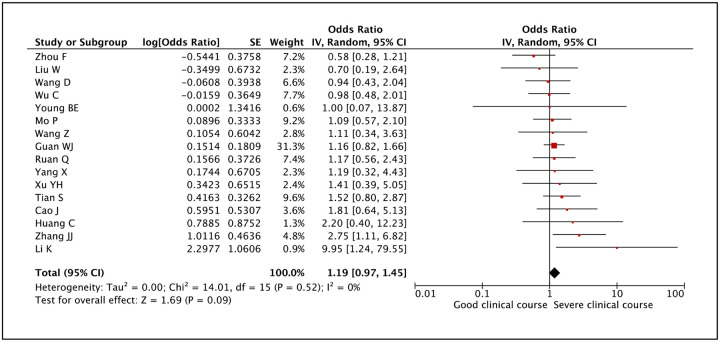
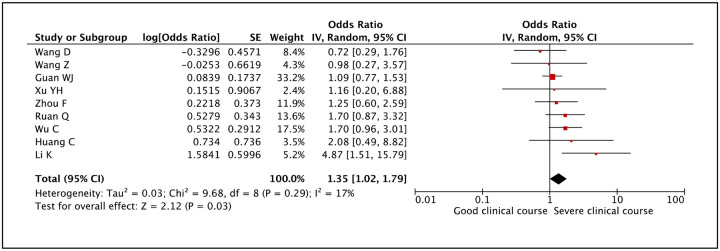
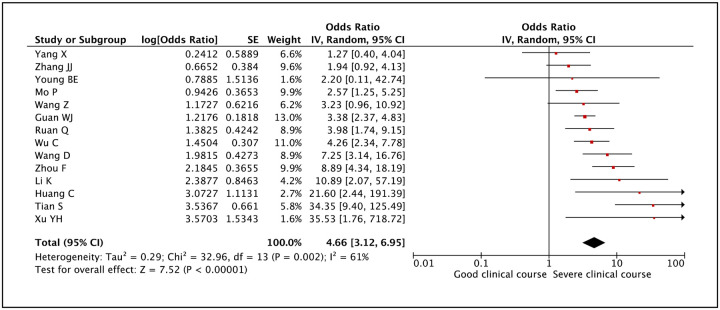
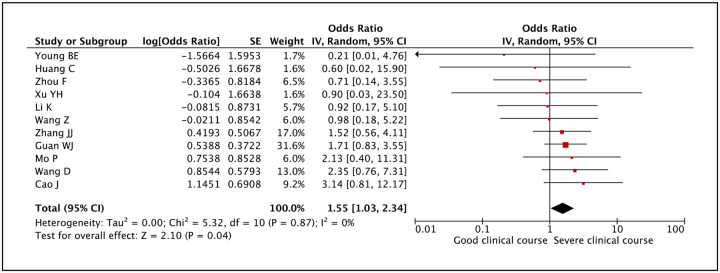
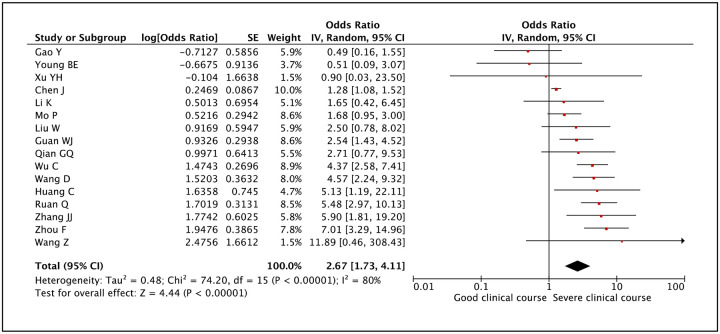
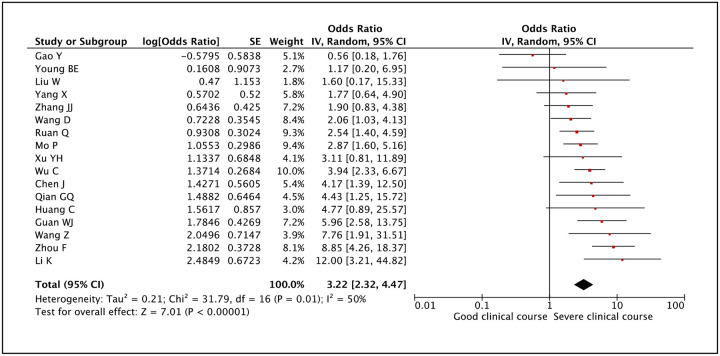
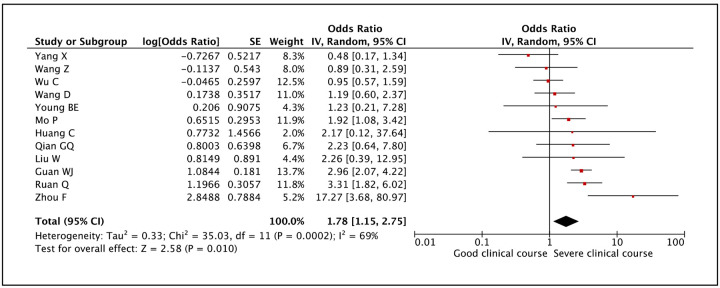
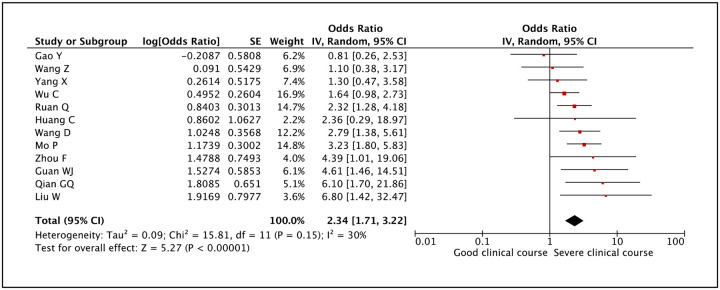
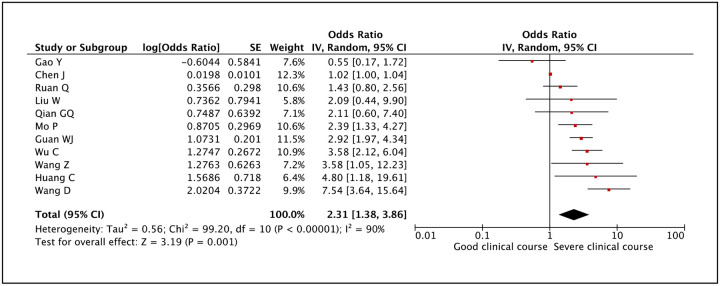
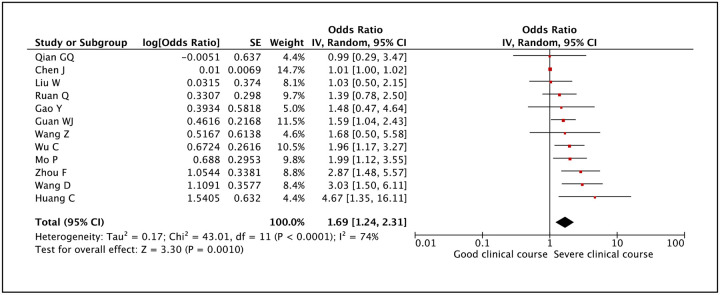
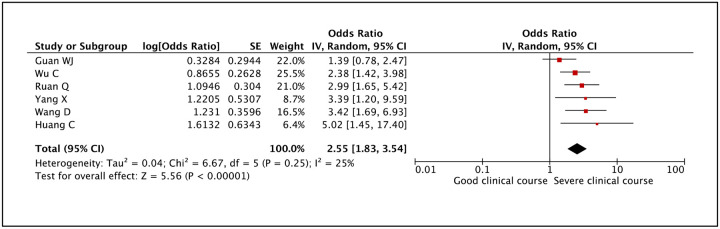
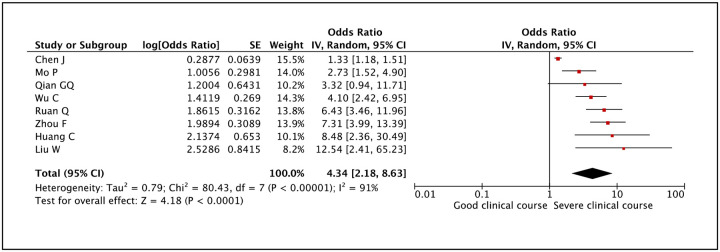
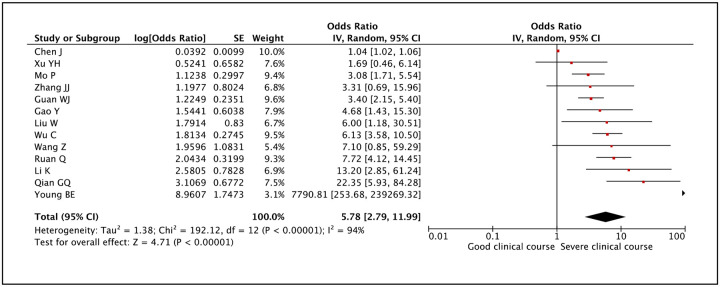
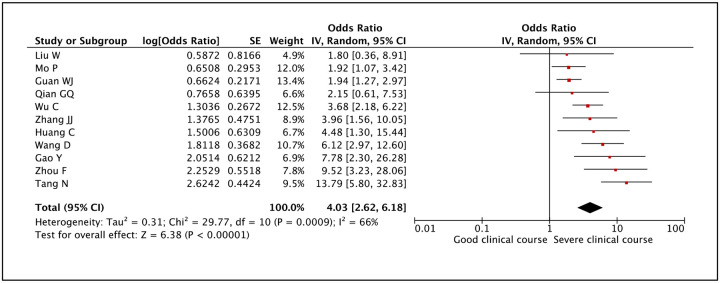
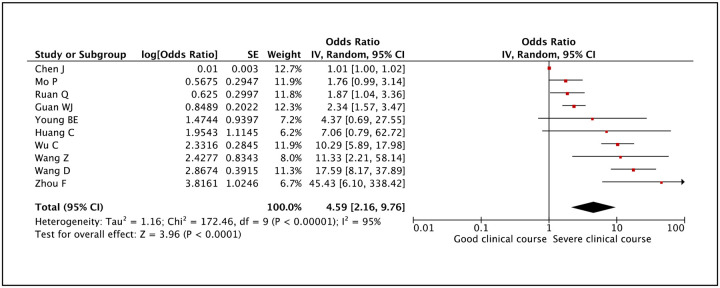
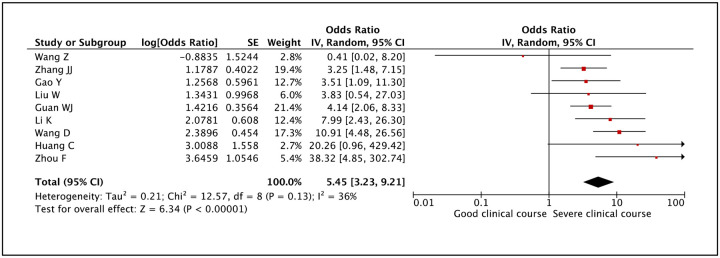
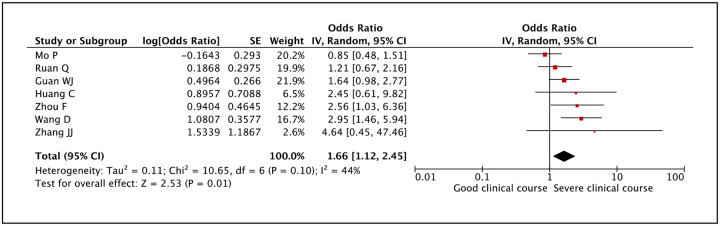
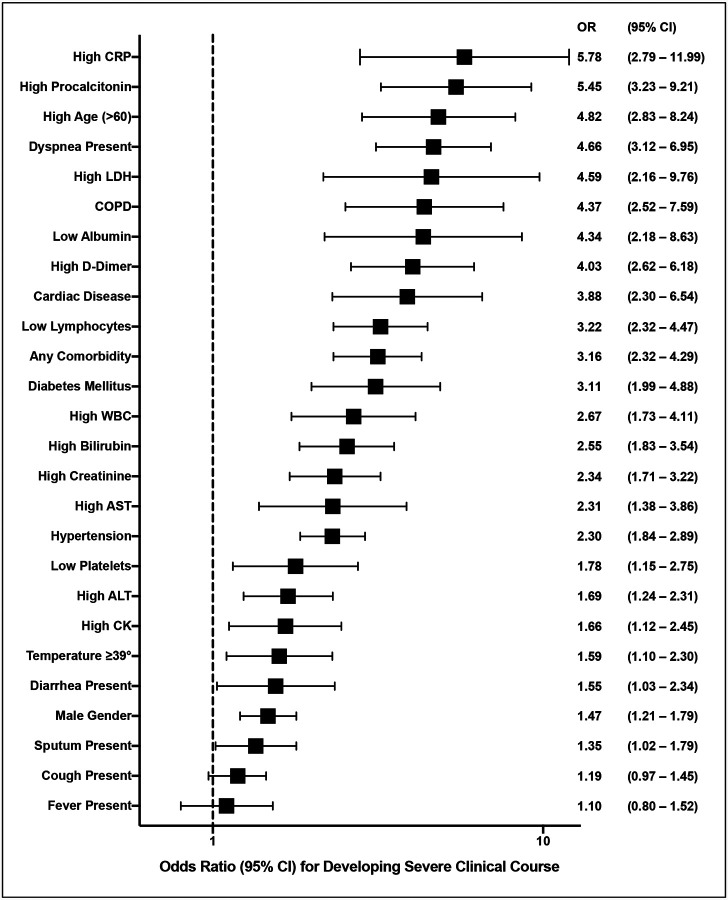
Findings: We included 58 studies (6892 patients) for the systematic review on clinical manifestations and 21 studies (3496 patients) for meta-analysis on factors associated with severe clinical course. The mean age of patients with COVID-19 is 49.7±16.3 years with a male to female ratio of 1.2:1. Common symptoms and their frequency are: fever (83.4%), cough (60.5%), fatigue (33.8%), sputum (28.9%), dyspnea (22.1%), myalgia (20.6%), chest tightness / pain (16.3%), sore throat (13.5%), headache (11.2%), diarhhea (7.5%), nasal congestion / rhinorrhea (6.7%), nausea / vomiting (5.6%), pain abdomen (4.6%), and hemoptysis (1.7%). The comorbidities associated with COVID-19 are: hypertension (18.4%), diabetes mellitus (9.8%), cardiovascular diseases (8.8%), endocrine diseases (5.8%), gastrointestinal diseases (5%), CLD (3%), and COPD (2.8%). Among the laboratory parameters WBC was low in 27%, high in 9%, platelets were low in 22.9%, creatinine was high in 6.5%, AST was high in 25.3%, ALT was high in 22.7%, bilirubin was high in 8.8%, albumin was low 60.1%, CT chest was abnormal in 89%, CRP was high in 67.5%, LDH was high in 52%, D-dimer was high in 34.8%, CK was high in 14.4%, and procalcitonin was high in 15.4%. Factors significantly associated severe clinical course (with their ORs) are as follows: High CRP (5.78), high procalcitonin (5.45), age >60 (4.82), dyspnea (4.66), high LDH (4.59), COPD (4.37), low albumin (4.34), high D-dimer (4.03), cardiac disease (3.88), low lymphocyte count (3.22), any associated comorbidity (3.16), diabetes mellitus (3.11), high WBC count (2.67), high bilirubin level (2.55), high creatinine (2.34), high AST (2.31), hypertension (2.30), low platelets (1.78), High ALT (1.69), high CK (1.66), fever spikes ≥39°C (1.59), diarrhea (1.55), male gender (1.47), and sputum (1.35).
Interpretation: Identification of these factors associated with severe COVID-19 will help the physicians working at all levels of healthcare (primary, secondary, tertiary and ICU) in determining which patients need home care, hospital care, HDU care, and ICU admission; and thus, prioritize the scarce healthcare resource use more judiciously. Many of these identified factors can also help the public at large in the current COVID-19 epidemic setting, to judge when they should seek immediate medical care.
Keywords: 2019-nCoV; COVID-19; Coronavirus; SARS-CoV-2; nCoV-2019; novel coronavirus.
Conflict of interest statement
Declaration of interests We declare no competing interests.
Figures
Similar articles
-
Clinical characteristics, laboratory abnormalities and CT findings of COVID-19 patients and risk factors of severe disease: a systematic review and meta-analysis.Ann Palliat Med. 2021 Feb;10(2):1928-1949. doi: 10.21037/apm-20-1863. Epub 2021 Jan 27. Ann Palliat Med. 2021. PMID: 33548996
-
Correlations of Clinical and Laboratory Characteristics of COVID-19: A Systematic Review and Meta-Analysis.Int J Environ Res Public Health. 2020 Jul 13;17(14):5026. doi: 10.3390/ijerph17145026. Int J Environ Res Public Health. 2020. PMID: 32668763 Free PMC article.
-
Predictive role of clinical features in patients with coronavirus disease 2019 for severe disease.Zhong Nan Da Xue Xue Bao Yi Xue Ban. 2020 May 28;45(5):536-541. doi: 10.11817/j.issn.1672-7347.2020.200384. Zhong Nan Da Xue Xue Bao Yi Xue Ban. 2020. PMID: 32879103 Chinese, English.
-
Laboratory features of severe vs. non-severe COVID-19 patients in Asian populations: a systematic review and meta-analysis.Eur J Med Res. 2020 Aug 3;25(1):30. doi: 10.1186/s40001-020-00432-3. Eur J Med Res. 2020. PMID: 32746929 Free PMC article.
-
[Clinical and laboratory characteristics of 215 cases of coronavirus disease 2019 with different prognosis].Zhonghua Wei Zhong Bing Ji Jiu Yi Xue. 2020 Dec;32(12):1428-1433. doi: 10.3760/cma.j.cn121430-20200824-00590. Zhonghua Wei Zhong Bing Ji Jiu Yi Xue. 2020. PMID: 33541492 Chinese.
Cited by
-
Predictors and Outcomes of Hospitalized COVID-19 Patients with Liver Injury.Acta Med Philipp. 2023 Jul 27;57(7):3-10. doi: 10.47895/amp.vi0.4651. eCollection 2023. Acta Med Philipp. 2023. PMID: 39483298 Free PMC article.
-
Characteristics and factors associated with severity of COVID-19 infections in primary care.Malays Fam Physician. 2023 Jul 26;18:42. doi: 10.51866/oa.285. eCollection 2023. Malays Fam Physician. 2023. PMID: 37593088 Free PMC article.
-
Prognostic factors for severity and mortality in patients infected with COVID-19: A systematic review.PLoS One. 2020 Nov 17;15(11):e0241955. doi: 10.1371/journal.pone.0241955. eCollection 2020. PLoS One. 2020. PMID: 33201896 Free PMC article.
-
The Role of Diabetes and Hyperglycemia on COVID-19 Infection Course-A Narrative Review.Front Clin Diabetes Healthc. 2022 Mar 10;3:812134. doi: 10.3389/fcdhc.2022.812134. eCollection 2022. Front Clin Diabetes Healthc. 2022. PMID: 36992740 Free PMC article. Review.
References
-
- Johns Hopkins Coronavirus Resource Center. Johns Hopkins Coronavirus Resource Center. https://coronavirus.jhu.edu/ (accessed March 30, 2020).
-
- Mahase E. Covid-19: WHO declares pandemic because of ‘alarming levels’ of spread, severity, and inaction. BMJ 2020; 368: m1036. - PubMed
Publication types
LinkOut - more resources
Full Text Sources
Research Materials
Miscellaneous