

Simulated Trends in Ionosphere-Thermosphere Climate Due to Predicted Main Magnetic Field Changes From 2015 to 2065
- PMID: 32714733
- PMCID: PMC7375146
- DOI: 10.1029/2019JA027738
Simulated Trends in Ionosphere-Thermosphere Climate Due to Predicted Main Magnetic Field Changes From 2015 to 2065
Abstract
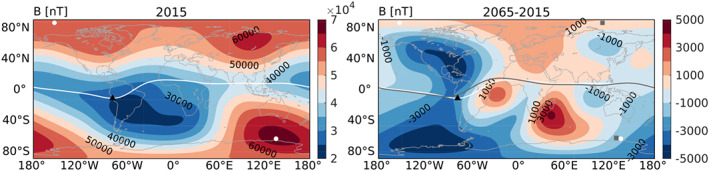
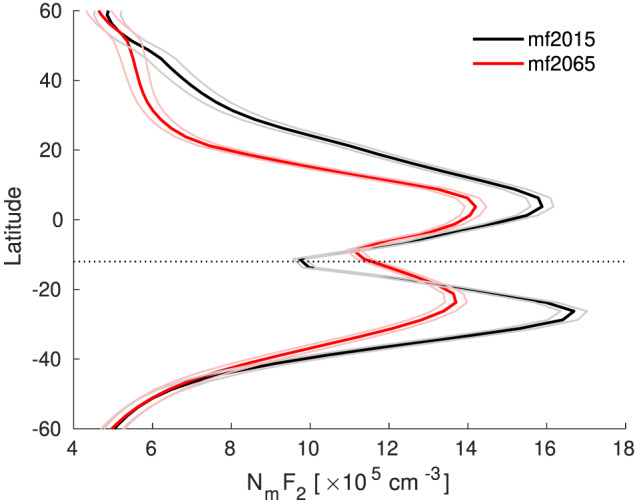
The strength and structure of the Earth's magnetic field is gradually changing. During the next 50 years the dipole moment is predicted to decrease by 3.5%, with the South Atlantic Anomaly expanding, deepening, and continuing to move westward, while the magnetic dip poles move northwestward. We used simulations with the Thermosphere-Ionosphere-Electrodynamics General Circulation Model to study how predicted changes in the magnetic field will affect the climate of the thermosphere-ionosphere system from 2015 to 2065. The global mean neutral density in the thermosphere is expected to increase slightly, by up to 1% on average or up to 2% during geomagnetically disturbed conditions ( ). This is due to an increase in Joule heating power, mainly in the Southern Hemisphere. Global mean changes in total electron content (TEC) range from 3% to +4%, depending on season and UT. However, regional changes can be much larger, up to about 35% in the region of 45°S to 45°N and 110°W to 0°W during daytime. Changes in the vertical drift are the most important driver of changes in TEC, although other plasma transport processes also play a role. A reduction in the low-latitude upward drift weakens the equatorial ionization anomaly in the longitude sector of 105-60°W, manifesting itself as a local increase in electron density over Jicamarca (12.0°S, 76.9°W). The predicted increase in neutral density associated with main magnetic field changes is very small compared to observed trends and other trend drivers, but the predicted changes in TEC could make a significant contribution to observationally detectable trends.
Keywords: ionosphere; long‐term trend; magnetic field; prediction; secular variation; thermosphere.
©2020. The Authors.
Figures


References
-
- A, E. , Ridley, A. J. , Zhang, D. , & Xiao, Z. (2012). Analyzing the hemispheric asymmetry in the thermospheric density response to geomagnetic storms. Journal of Geophysical Research, 117, A08317 10.1029/2011JA017259 - DOI
-
- Anderson, D. N. (1981). Modeling the ambient, low latitude F‐region ionosphere—A review. Journal of Atmospheric and Terrestrial Physics, 43(8), 753–762. 10.1016/0021-9169(81)90051-9 - DOI
-
- Aubert, J. (2015). Geomagnetic forecasts driven by thermal wind dynamics in the Earth's core. Geophysical Journal International, 203(3), 1738–1751. 10.1093/gji/ggv394 - DOI
-
- Cnossen, I. (2012). Greenhouse gases emission, measurement and management Edited by Liu G. (pp. 315–336):InTech; 10.5772/32565 - DOI
-
- Cnossen, I. (2014). The importance of geomagnetic field changes versus rising CO levels for long‐term change in the upper atmosphere. Journal of Space Weather and Space Climate, 4, A18 10.1051/swsc/2014016 - DOI
LinkOut - more resources
Full Text Sources