. 2020 Jun 9;7(14):2000359.
doi: 10.1002/advs.202000359. eCollection 2020 Jul.

Ferrofluid Microdroplet Splitting for Population-Based Microfluidics and Interfacial Tensiometry

Affiliations

Ferrofluid Microdroplet Splitting for Population-Based Microfluidics and Interfacial Tensiometry

Mika Latikka et al. Adv Sci (Weinh). .

Abstract

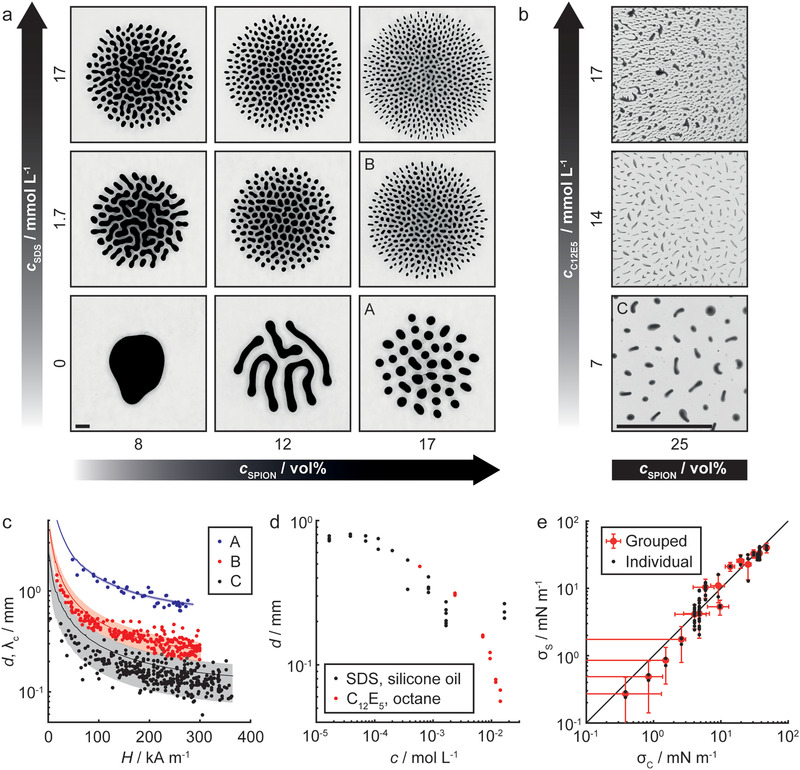
Ferrofluids exhibit a unique combination of liquid properties and strong magnetic response, which leads to a rich variety of interesting functional properties. Here, the magnetic-field-induced splitting of ferrofluid droplets immersed in an immiscible liquid is presented, and related fascinating dynamics and applications are discussed. A magnetic field created by a permanent magnet induces instability on a mother droplet, which divides into two daughter droplets in less than 0.1 s. During the splitting process, the droplet undergoes a Plateau-Rayleigh-like instability, which is investigated using high-speed imaging. The dynamics of the resulting satellite droplet formation is shown to depend on the roughness of the supporting surface. Further increasing the field results in additional splitting events and self-assembly of microdroplet populations, which can be magnetically actuated. The effects of magnetization and interfacial tension are systematically investigated by varying magnetic nanoparticles and surfactant concentrations, and a variety of outcomes from labyrinthine patterns to discrete droplets are observed. As the splitting process depends on interfacial tension, the droplet splitting can be used as a measure for interfacial tension as low as 0.1 mN m-1. Finally, a population-based digital microfluidics concept based on the self-assembled microdroplets is presented.

Keywords: ferrofluids; fluid dynamics; interfacial tension; magnetic fields; magnetic nanoparticles; microfluidics.


Conflict of interest statement

The authors declare no conflict of interest.

Figures

Figure 1
Figure 1
Magnetic‐field‐induced ferrofluid droplet splitting in an immiscible liquid. a) Photo of ferrofluid droplets in a polystyrene container filled with silicone oil and a stack of two cylindrical magnets (diameter and height = 9.5 mm) underneath. b) Schematic of a droplet population in a magnetic field (field lines in cyan) created by a permanent magnet. Inset shows a lubricating oil layer between the droplet and the substrate. c) Schematic of droplet splitting in an increasing magnetic field (λ c: critical wavelength, d: droplet diameter). d) Top and side views of ferrofluid droplet splitting in silicone oil (t: time, H: external magnetic field, and dH/dz: vertical field gradient). The distance between the magnet (diameter = 20 mm, height = 42 mm) and the droplets is reduced from 102.8 to 2.8 mm at a speed of 1 mm s−1. Scale bar: 1 mm.
Figure 2
Figure 2
Dynamics of satellite droplet formation. a) Schematic of a mother droplet splitting into two daughter droplets. The zoomed inset shows small satellite and subsatellite droplets, which are formed during the splitting process due to the Plateau–Rayleigh‐like instability. b) Side‐ and top‐view snapshots of the breakup of the capillary bridge between two splitting daughter droplets on the Glaco‐coated substrate (SPION concentration 22 vol%, Movie S2, Supporting Information). The time between each picture is 180 µs. c,d) Top‐view snapshots of the capillary bridge breakup on the PS and Glaco surfaces, respectively (SPION concentration 24 vol%; see the colored lines in the graphs below for time stamp information). e,f) Corresponding graphs showing the detailed time evolution of the bridge breakup (black corresponds to the ferrofluid and white the surrounding oil). Before t = 0 ms, the bridge is still intact (red lines and boxes) and at t = 0 ms, the first pinch‐off occurs (yellow lines and boxes). On the smooth PS surface, the breakup starts around the largest satellite droplet in the center and continues outward in a symmetric manner (green and cyan lines and boxes). The entire breakup event takes several milliseconds. In comparison, on the rough Glaco‐coated surface, the breakup starts almost simultaneously at the center and the edge of the bridge, and evolves then quickly inward from both sides in a total breakup time of 0.5 ms. All scale bars: 0.2 mm.
Figure 3
Figure 3
Droplet populations. a) Droplet populations created by field‐induced splitting for different SDS and SPION concentrations (c SDS and c SPION) in silicone oil. Initial droplet volume V 0 = 5 µL and external magnetic field H = 290 kA m−1. SDS lowers the IFT between ferrofluid and silicone oil, leading to smaller droplets. Low SPION concentration leads to dumbbell‐shaped droplets and labyrinthine patterns, whereas high concentration allows formation of distinct droplets. Scale bar: 1 mm. b) Split ferrofluid droplets in octane with different concentrations of C12E5 c C12E5(V 0 = 0.2 µL, H = 300 kA m−1). C12E5 lowers IFT, leading to droplets with elongated cross sections. At 17 mmol L−1, ribbons are formed in addition to irregular droplets (top photo). Scale bar: 1 mm. c) Theoretically calculated critical wavelengths λ c (lines) and droplet cross‐sectional major axes d (dots) for experimentally observed splitting events as a function of H. Shaded area represents uncertainty of the theoretical prediction (±1 standard deviation). A) 17 vol% SPIONs (droplet population shown in panel (a)); B) 17 vol% SPIONs, 1.7 mmol L−1 SDS (panel (a)); and C) 25 vol% SPIONs, 7.1 mmol L−1 C12E5 (panel (b)). d) d as a function of surfactant concentration c (17–25 vol% SPIONs, normal force density f N = 2 MN m−3). e) IFT measured using splitting experiments σ S as a function of IFT measured with control methods σ C (pendant droplet and micropipette aspiration). The solid line has a slope of one. Black dots: individual experiments; red circles: experiments grouped based on control method IFT (n = 2–23). Error bars represent uncertainty (±1 standard deviation).
Figure 4
Figure 4
Microfluidics operations. a) Schematic of field‐induced droplet combination. As a horizontally oriented magnet is brought closer, the ferrofluid droplets magnetize horizontally (yellow arrows) and combine due to their mutual attraction. b) Image series of splitting (top row) and combining (bottom row) a ferrofluid droplet with a magnetic field (Movie S3, Supporting Information). Scale bar: 2 mm. c) Schematic of sequential transport of droplets between populations. As magnet M1 is lowered away from the droplets, they are increasingly pulled toward M2 due to the magnetic field (cyan lines), until they slide one by one from above M1 to above M2. d) Top‐view image series of sequential transport of ferrofluid droplets (numbered in the order of movement) with two magnets (Movie S6, Supporting Information). Scale bar: 1 mm.

References

    1. Rosensweig R. E., Ferrohydrodynamics, Courier Corporation, North Chelmsford, MA: 2013.
    1. Colloidal Magnetic Fluids: Basics, Development and Application of Ferrofluids (Ed: Odenbach S.), Springer, Berlin: 2009.
    1. Nkurikiyimfura I., Wang Y., Pan Z., Renewable Sustainable Energy Rev. 2013, 21, 548.
    1. Bahiraei M., Hangi M., J. Magn. Magn. Mater. 2015, 374, 125.
    1. Backholm M., Vuckovac M., Schreier J., Latikka M., Hummel M., Linder M. B., Ras R. H. A., Langmuir 2017, 33, 6300. - PubMed

LinkOut - more resources