. 2020 May 29;7(14):2000444.
doi: 10.1002/advs.202000444. eCollection 2020 Jul.

SWIR Photodetection and Visualization Realized by Incorporating an Organic SWIR Sensitive Bulk Heterojunction

Affiliations

SWIR Photodetection and Visualization Realized by Incorporating an Organic SWIR Sensitive Bulk Heterojunction

Ning Li et al. Adv Sci (Weinh). .

Abstract

Short-wavelength infrared (SWIR) photodetection and visualization has profound impacts on different applications. In this work, a large-area organic SWIR photodetector (PD) that is sensitive to SWIR light over a wavelength range from 1000 to 1600 nm and a SWIR visualization device that is capable of upconverting SWIR to visible light are developed. The organic SWIR PD, comprising an organic SWIR sensitive blend of a near-infrared polymer and a nonfullerene n-type small molecule SWIR dye, demonstrates an excellent capability for real-time heart rate monitoring, offering an attractive opportunity for portable and wearable healthcare gadgets. The SWIR-to-visible upconversion device is also demonstrated by monolithic integration of an organic SWIR PD and a perovskite light-emitting diode, converting SWIR (1050 nm) to visible light (516 nm). The most important attribute of the SWIR visualizing device is its solution fabrication capability for large-area SWIR detection and visualization at a low cost. The results are very encouraging, revealing the exciting large-area SWIR photodetection and visualization for a plethora of applications in environmental pollution, surveillance, bioimaging, medical, automotive, food, and wellness monitoring.

Keywords: SWIR photodetection; SWIR visualization; organic photodetectors; solution fabrication.


Conflict of interest statement

The authors declare no conflict of interest.

Figures
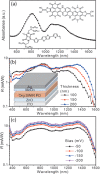
Figure 1
Figure 1
Photoresponses of the organic SWIR PDs. a) The absorption spectrum measured for the DPP‐DTT:SWIR dye blend layer deposited on glass. The insets in (a): molecule structures of the DPP‐DTT polymer and the SWIR dye. b) R(λ) of the organic SWIR PDs, with different BHJ layer thicknesses, as a function of the wavelength. The inset in (b): a schematic cross‐sectional view of an organic SWIR PD. c) R(λ) measured for an organic SWIR PD with a 200 nm thick BHJ layer operated under different reverse biases.
Figure 2
Figure 2
Temperature independent R(λ) of the organic SWIR PD. R(λ) measured for an organic SWIR PD, with a 200 nm thick BHJ, operated at different temperatures.
Figure 3
Figure 3
Dark current and D* analyses. a) I darkV characteristics measured for the organic SWIR PDs with different BHJ layer thicknesses of 100, 150, and 200 nm. b) D* calculated for an organic SWIR PD, made with a 200 nm thick BHJ, operated under different reverse biases.
Figure 4
Figure 4
Organic SWIR PD‐based PPG sensor. a) A schematic PPG measurement setup comprising an infrared LED light source, an organic SWIR PD, an amplifier, and an oscilloscope. b) The heartbeat waveform measured by the organic SWIR PD‐based PPG sensor using NIR (850 nm) and SWIR (1050 nm) light illuminations, e.g., showing a heart rate of 82 beats min−1.
Figure 5
Figure 5
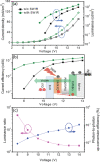
Properties of the SWIR visualizing device. a) JLV characteristics measured for the SWIR visualizing device in the absence and presence of SWIR (1050 nm) light with an intensity of 32 mW cm−2. b) LV characteristics measured for the SWIR visualizing device in the absence and presence of the SWIR (1050 nm) light. Inset in (b): a schematic diagram illustrating the energy levels of the materials used in the SWIR visualizing device. c) The luminance ratio and photon‐to‐photon upconversion efficiency as a function of the operating voltage.
Figure 6
Figure 6
SWIR visualization. a) The spectrum of a SWIR LED source used in the measurement and the EL spectrum of the SWIR‐to‐visible upconversion device in the presence of the SWIR (1050 nm) light illumination, the inset in (a): a schematic cross‐sectional view of the SWIR visualizing device. b) The picture taken for the SWIR visualizing device, operated under a forward bias of 7.0 V, in the absence of SWIR illumination, showing no visible light emission. c) The picture taken for the SWIR visualizing device, operated under a forward bias of 7.0 V, in the presence of a circular SWIR (1050 nm) light source. The intensity of the SWIR (1050 nm) light was ≈35 mW cm−2.

References

    1. Kamimura M., Takahiro S., Yoshida M., Hashimoto Y., Fukushima R., Soga K., Polym. J. 2017, 49, 799.
    1. Jiang Y., Upputuri P. K., Xie C., Zheng Z., Sharma A., Zhen X., Li J., Huang J., Pramanik M., Pu K., Adv. Mater. 2019, 31, 1808166. - PubMed
    1. He S., Song J., Qu J., Cheng Z., Chem. Soc. Rev. 2018, 47, 4258. - PubMed
    1. Welsher K., Liu Z., Sherlock S. P., Robinson J. T., Chen Z., Daranciang D., Dai H., Nat. Nanotechnol. 2009, 4, 773. - PMC - PubMed
    1. Miao Q., Pu K., Adv. Mater. 2018, 30, 1801178. - PubMed

LinkOut - more resources