. 2020 Jun 24:10:258.
doi: 10.3389/fcimb.2020.00258. eCollection 2020.

Long-Term Exposure to Ceftriaxone Sodium Induces Alteration of Gut Microbiota Accompanied by Abnormal Behaviors in Mice

Affiliations

Long-Term Exposure to Ceftriaxone Sodium Induces Alteration of Gut Microbiota Accompanied by Abnormal Behaviors in Mice

Zhongyi Zhao et al. Front Cell Infect Microbiol. .

Abstract

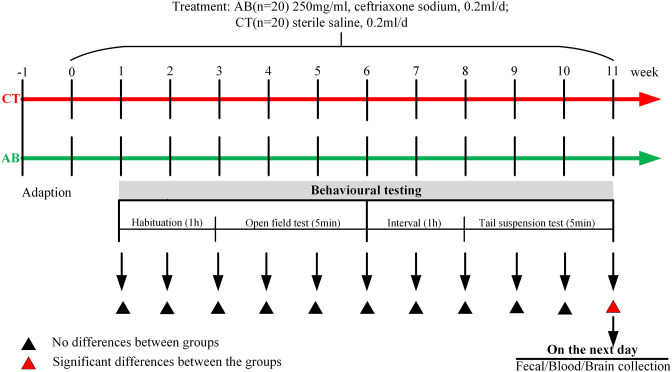
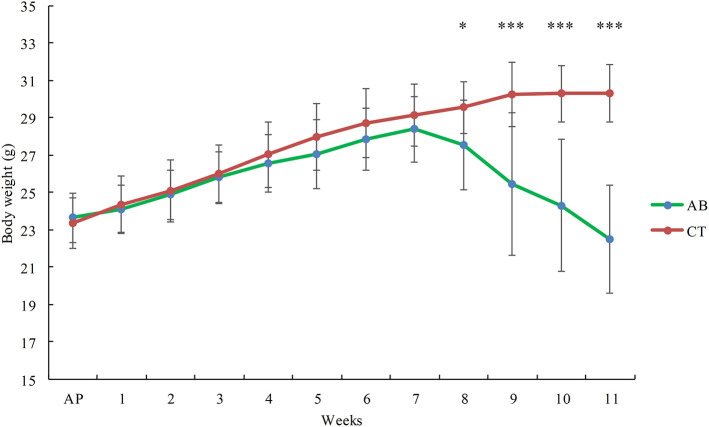
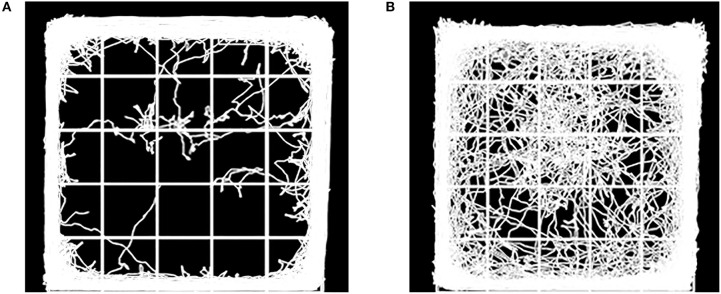
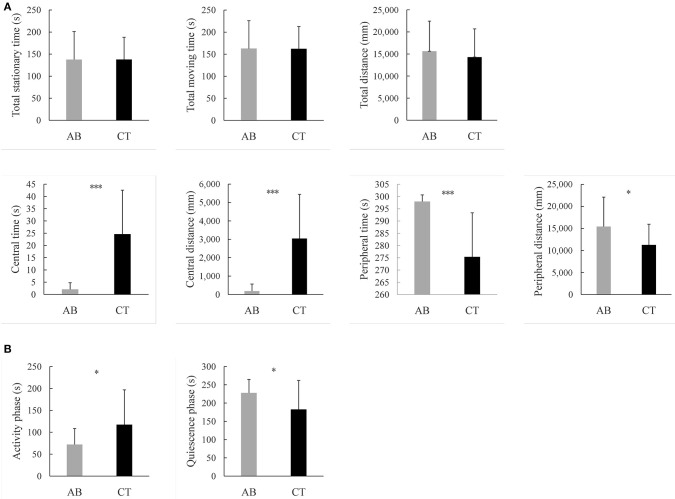
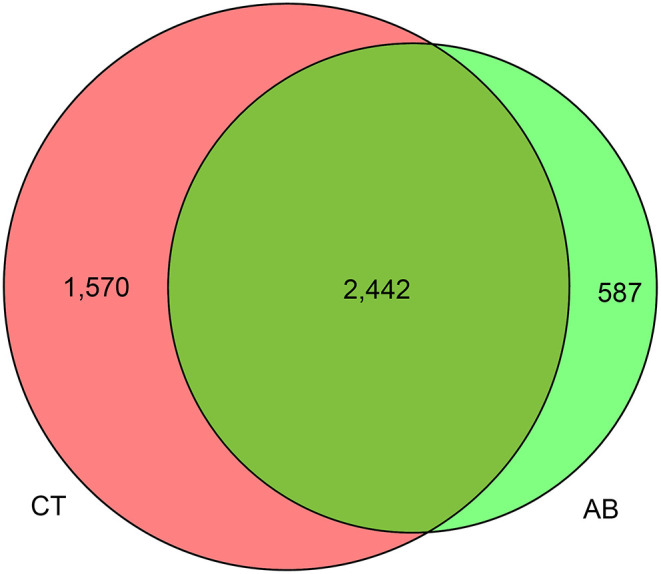
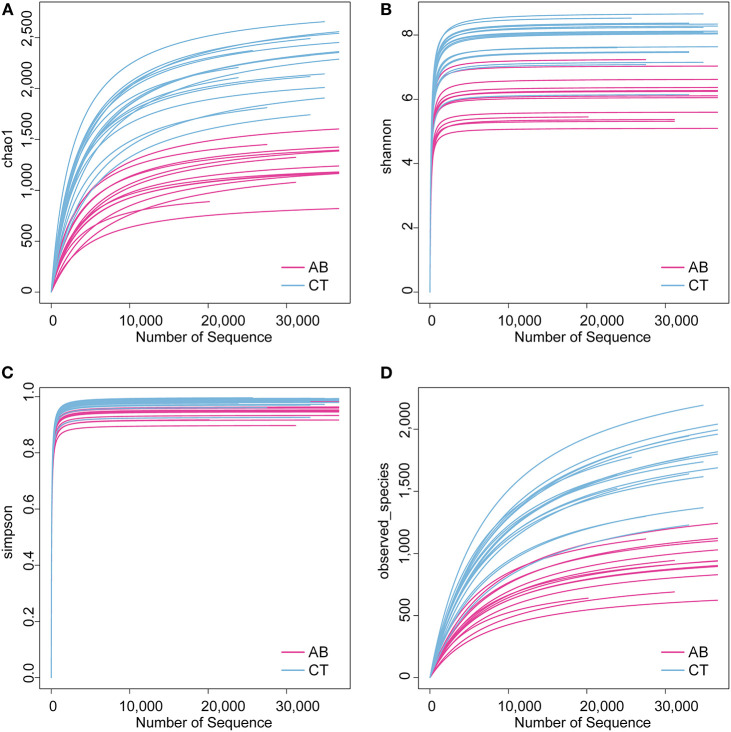
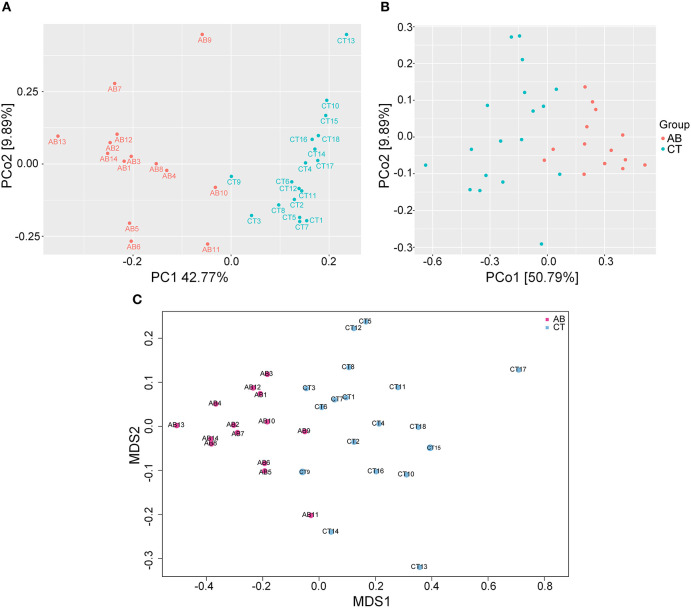
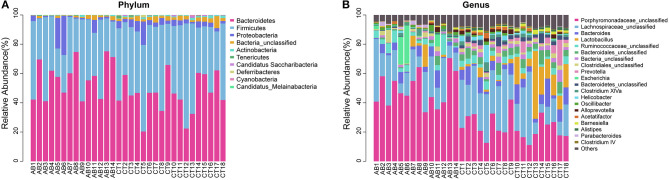
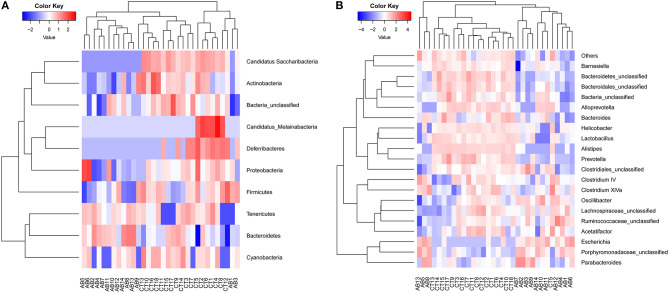
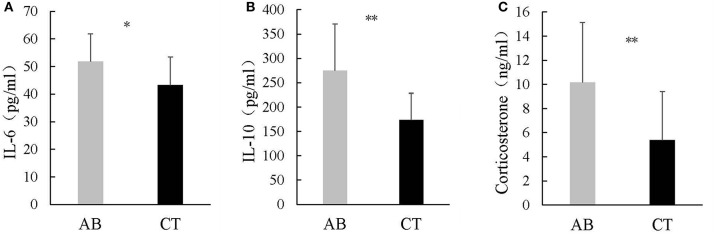
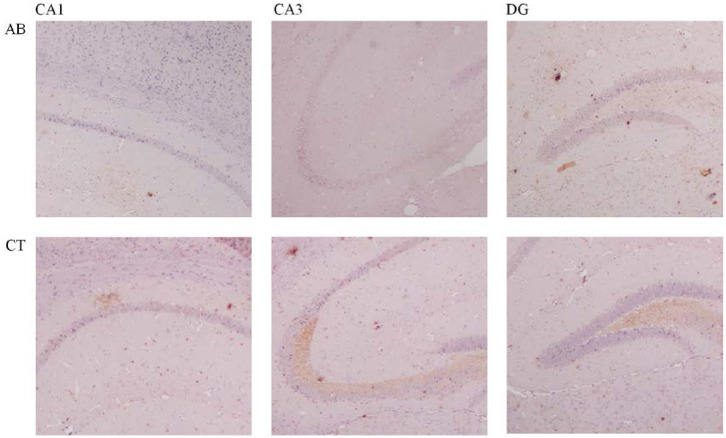
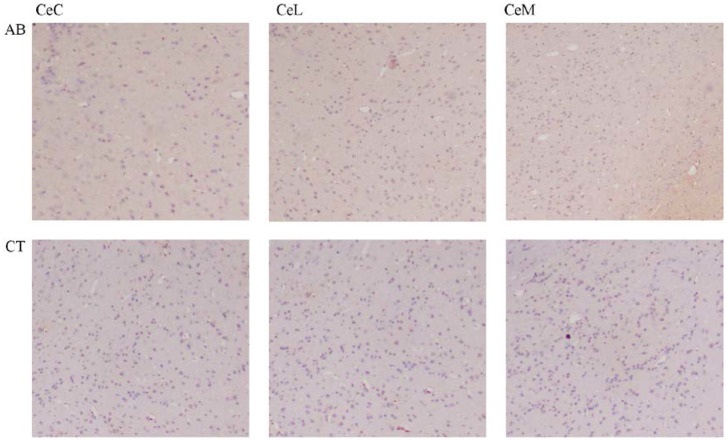
Background: Growing evidence points out that a disturbance of gut microbiota may also disturb the gut-brain communication. However, it is not clear to what extent the alteration of microbiota composition can modulate brain function, affecting host behaviors. Here, we investigated the effects of gut microbiota depletion on emotional behaviors. Methods: Mice in the experimental group were orally administered ceftriaxone sodium solution (250 mg/ml, 0.2 ml/d) for 11 weeks. The open-field test and tail-suspension test were employed for the neurobehavioral assessment of the mice. Fecal samples were collected for 16s rDNA sequencing. The serum levels of cytokines and corticosterone were quantified using enzyme-linked immunosorbent assays. The immunohistochemistry method was used for the detection of brain-derived neurotrophic factor (BDNF) and c-Fos protein. Results: The gut microbiota for antibiotic-treated mice showed lower richness and diversity compared with normal controls. This effect was accompanied by increased anxiety-like, depression-like, and aggressive behaviors. We found these changes to be possibly associated with a dysregulation of the immune system, abnormal activity of the hypothalamic-pituitary-adrenal axis, and an alteration of neurochemistry. Conclusions: The findings demonstrate the indispensable role of microbiota in the gut-brain communication and suggest that the absence of conventional gut microbiota could affect the nervous system, influencing brain function.

Keywords: aggressive behavior; anxiety; ceftriaxone sodium; depression; emotional behaviors; gut microbiota.


Figures

Figure 1
Figure 1
Study design. After seven days of adaptation, the antibiotic (AB) group was given ceftriaxone and the control (CT) group was given saline by gavage once a day. The open-field test (OFT) and tail-suspension test (TST) were given to mice once a week. After 11 weeks of oral gavage, significant behavioral differences were noted between the groups. On the second day after the last behavioral experiment was performed, mice were administered the final gavage exposure, and 1 h later, fresh blood and stool was sampled.
Figure 2
Figure 2
Effect of ceftriaxone on body weight. AB, ceftriaxone administration for 11 weeks (n = 14); CT, saline treatment for 11 weeks (n = 18). AP: adaptive phase. *P < 0.05, ***P < 0.001.
Figure 3
Figure 3
Diagram showing movement of (A) AB group mice and (B) CT group mice in the open field. AB, antibiotic group (n = 14); CT, control group (n = 18).
Figure 4
Figure 4
Results of behavioral tests (A) in the open field test, (B) in the suspension tail test. AB, antibiotic group (n = 14); CT, control group (n = 18). *P < 0.05, ***P < 0.001.
Figure 5
Figure 5
Venn diagram of fecal bacteria. AB, antibiotic group (n = 14); CT, control group (n = 18).
Figure 6
Figure 6
Alpha diversity analysis for gut microbiota. (A) Chao1 curves for each group. (B) Shannon-Wiener curves for each group. (C) Simpson curves for each group. (D) Observed_species curves for each group. AB, antibiotic group (n = 14); CT, control group (n = 18).
Figure 7
Figure 7
Beta diversity analysis for gut microbiota. (A) PCA plot of weighted UniFrac distances between samples. (B) PCoA plot of weighted UniFrac distances between samples. (C) MDS plot of weighted UniFrac distances between samples. AB, antibiotic group (n = 14); CT, control group (n = 18).
Figure 8
Figure 8
Composition abundance of gut microbiota (A) at the phylum level and (B) the genus level. AB, antibiotic group (n = 14); CT, control group (n = 18).
Figure 9
Figure 9
Heat maps of gut microbiota (A) at the phylum level and (B) the genus level. Red and blue colors indicate high and low values of the percent of reads classified at that rank. AB, antibiotic group (n = 14); CT, control group (n = 18).
Figure 10
Figure 10
Concentrations of (A) IL-6, (B) IL-10, and (C) corticosterone in serum. AB, antibiotic group (n = 14); CT, control group (n = 18). *P < 0.05, **P < 0.01.
Figure 11
Figure 11
Immunohistochemical results of BDNF in the hippocampus of mice (×400). AB, antibiotic group (n = 14); CT, control group (n = 18). CA1, field CA1 of hippocampus; CA3, field CA3 of hippocampus; DG, dentate gyrus.
Figure 12
Figure 12
Immunohistochemical results of c-Fos in the amygdala of mice (×400). AB, antibiotic group (n = 14); CT, control group (n = 18). CeC, central amygdaloid nucleus, capsular part; CeL, central amygdaloid nucleus, lateral division; CeM, central amygdaloid nucleus, medial division.

References

    1. Aleshukina A. V. (2012). Pathogenesis of intestinal dysbacteriosis. Zh. Mikrobiol. Epidemiol. Immunobiol. 3, 74–8. - PubMed
    1. Angelakis E. (2017). Weight gain by gut microbiota manipulation in productive animals. Microb. Pathog. 106, 162–170. 10.1016/j.micpath.2016.11.002 - DOI - PubMed
    1. Anisman H., Merali Z., Hayley S. (2008). Neurotransmitter, peptide and cytokine processes in relation to depressive disorder: comorbidity between depression and neurodegenerative disorders. Prog. Neurobiol. 85, 1–74. 10.1016/j.pneurobio.2008.01.004 - DOI - PubMed
    1. Antonopoulos D. A., Chang E. B. (2016). Transplanting a microbial organ: the good, the bad, and the unknown. mBio 7, e00572–16. 10.1128/mBio.00572-16 - DOI - PMC - PubMed
    1. Baulmann J., Spitznagel H., Herdegen T., Unger T., Culman J. (2000). Tachykinin receptor inhibition and c-Fos expression in the rat brain following formalin-induced pain. Neuroscience 95, 813–820. 10.1016/S0306-4522(99)00478-9 - DOI - PubMed

LinkOut - more resources