. 2020 Jul 2:8:375.
doi: 10.3389/fcell.2020.00375. eCollection 2020.

Congruence of Transcription Programs in Adult Stem Cell-Derived Jejunum Organoids and Original Tissue During Long-Term Culture

Affiliations

Congruence of Transcription Programs in Adult Stem Cell-Derived Jejunum Organoids and Original Tissue During Long-Term Culture

Bart van der Hee et al. Front Cell Dev Biol. .

Abstract

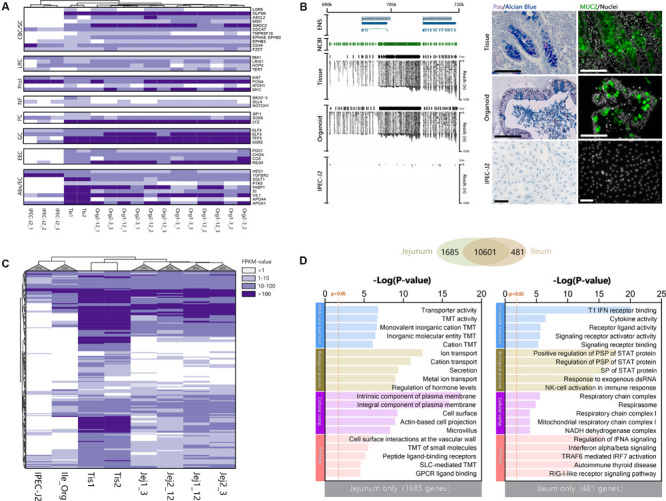
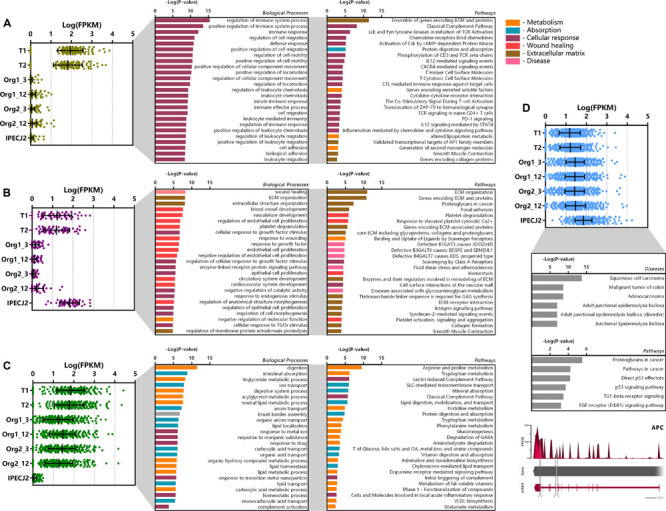
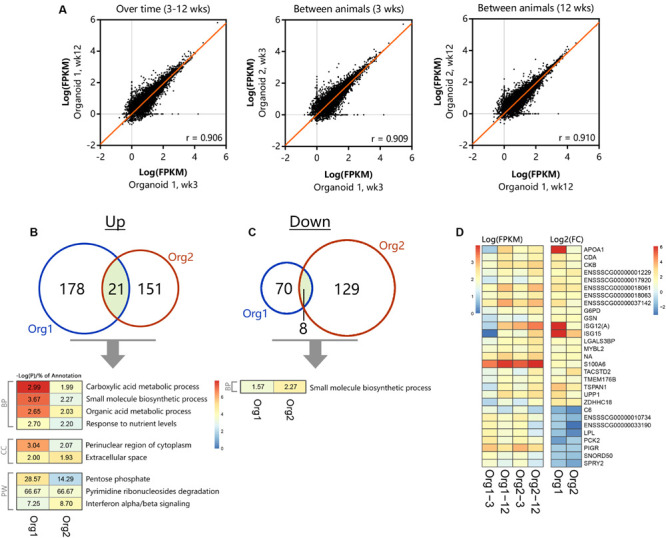
The emergence of intestinal organoids, as a stem cell-based self-renewable model system, has led to many studies on intestinal development and cell-cell signaling. However, potential issues regarding the phenotypic stability and reproducibility of the methodology during culture still needs to be addressed for different organoids. Here we investigated the transcriptomes of jejunum organoids derived from the same pig as well as batch-to-batch variation of organoids derived from different pigs over long-term passage. The set of genes expressed in organoids closely resembled that of the tissue of origin, including small intestine specific genes, for at least 17 passages. Minor differences in gene expression were observed between individual organoid cultures. In contrast, most small intestine-specific genes were not expressed in the jejunum cell line IPEC-J2, which also showed gene expression consistent with cancer phenotypes. We conclude that intestinal organoids provide a robust and stable model for translational research with clear advantages over transformed cells.

Keywords: IPEC-J2; gastrointestinal; intestinal organoids; organoid stability; porcine organoids.


Figures

FIGURE 1
FIGURE 1
Porcine intestinal organoid culture and transcriptome sequencing overview. (A) graphical overview of the study design. Organoids were generated from the jejunum of two individual pigs, directly divided into triplicate organoid cultures per animal, and passaged for 12 weeks. Total RNA of tissue, organoids, and jejunum cell line IPEC-J2 was extracted and sequenced by RNA-seq. (B) Initially after isolation, intestinal crypts form budding organ-like structures in vitro. Within 2 weeks of passaging, organoids form more spheroid-resembling structures for the remainder of the experiment, indicating more long-term reproducibility after a short-term series of passaging. (C) After 12 weeks of growth, spheroids still retain secretory cell lineage differentiation early post-passaging (green: stained with UEA-1). (D) Multidimensional scaling of transcriptomic data showed separation of organoids, tissue and IPEC-J2, where organoids and tissue show separation in only one dimension. (E) Correlation matrix of all samples show high correlation among individual organoid batches, and strong correlation between tissue. (F) Heat map and hierarchical clustering of all expressed genes (>1 FPKM) in the dataset.
FIGURE 2
FIGURE 2
The transcriptome of jejunum organoids exhibits strong similarity to its derived tissue transcriptome, including a distinct group of overlapping genes not expressed in IPEC-J2. Averages of all expressed genes were compared between sample type and (A) can be viewed in the weighted Venn-diagram. All genes expressed in organoids after 12 weeks of culture were analyzed using Ingenuity pathway analysis. (B) Molecular, cellular, and physiological system development and function shows many genes involved in basic cellular and tissue specific processes. More than >400 pathways were expressed in the organoid RNA-seq dataset. (C) The top 10 cellular homeostasis and immunity related pathways; –logP values indicate statistical probability of pathway expression; ratio, indicates number of expressed genes divided by number of annotated genes in the pathway. Testing the RNA-seq dataset for overlapping genes revealed a set of 1762 genes exclusively expressed in tissue and organoids. (D) Top 30 connected canonical pathways of these 1762 genes from ingenuity pathway analysis, which showed subdivision into metabolic, disease, GPCR/Ephrin signaling, and small molecule degradation pathways. (E) Expression of genes involved in the complement pathway are expressed in organoids and tissue (Pink), Tissue only (Blue), organoids tissue and IPEC-J2 (Green), or not found to be expressed (White). (F) Expression patterns of genes involved in Enteroendocrine signaling [CHGA, Chromogranin A; GCG, Glucagon; GIP, Gastric inhibitory polypeptide; CCK, Cholecystokinin; PYY, Peptide YY; SST, Somatostatin; Purple, Tissue; Green, Organoid; Orange, IPEC-J2, data shown as Log(FPKM)].
FIGURE 3
FIGURE 3
Organoids derived from adult intestinal stem cells show intrinsic programming to differentiate into different epithelial cell lineages and express small intestine-specific genes. (A) Cell type-specific transcripts for Crypt Base Columnar (CBC) and Stem cells, Label-retaining (LRC) +4 cells, Proliferation (Prol), Niche factors (NF), Paneth cells (PC), Goblet cells (GC), Enteroendocrine cells (EEC), and Absorptive cells or enterocytes (Abs/EC). (B) Overlaying the NCBI gene tracks of MUC2 NC_010444.4 on chromosome 2 at location 689363–719542bp (green area), shows identical overlap with the mapped reads and coverage (Cov) from organoid and tissue samples, but not in IPEC-J2 (ENS; Ensembl reference genome). To confirm MUC2 protein translation and subsequent mucus formation, Carnoy fixed tissue, organoid, and IPEC-J2 samples were stained with PAS/Alcian blue (left) and porcine anti-MUC2 (right; black and white size bars indicate 100 μm). (C) Most small intestine-specific genes identified in the human protein atlas are also expressed in porcine jejunum tissue and their derived organoids (>74%), whereas fewer are expressed in ileum organoids (52%). IPEC-J2 only expressed 32% of the small intestine-specific genes. (D) Organoid transcriptomes from jejunum and ileum were compared to identify differences in expressed genes, showing large overlap of genes (Venn), but also some differences. The different genes were analyzed using TOPPfun to identify putative differences in gene ontology and pathways (TMT, Transmembrane transport; PSP, Peptidyl-serine phosphorylation).
FIGURE 4
FIGURE 4
Cluster analysis of differentially expressed genes (DEGs). DEGs were clustered according to their expression pattern using k-means clustering, and subsequently analyzed for functional enrichment using TOPPfun. (A) Cluster of genes (n = 141) showing increased expression in tissue only and low expression in organoids and IPEC-J2. (B) Cluster of genes (n = 52) showing high expression in tissue and IPEC-J2, with low expression in organoids. (C) Cluster of genes (n = 299) with increased expression in tissue and organoids, with low expression in IPECJ-2 (data represented in Log(FPKM) or –Log(P-value), P and q < 0.05). (D) Cluster of genes (n = 841) expressed more highly in IPEC-J2 than tissue and organoids which were associated with diseases and pathways involved in tumor formation. A common mutation in colon cancer is inactivation of adenomatous polyposis coli (APC) gene where IPEC-J2 shows an insertion (217 bp, tandem duplication) in the protein coding region and splice site deletion (331 bp, cross mapped breakpoints; bottom).
FIGURE 5
FIGURE 5
Differential gene- and pathway expression in organoids shows stable transcription over time. The two separate organoid cultures (n = 3 per group) were tested for expression differences between 3 and 12 weeks of culturing, (A) showing representative correlations over time within an organoid line and between different animals (n = 13813 genes with at least 1 sample >1 FPKM). Significant (p < 0.05) up- (B) and down-regulation (C) of genes and their corresponding overlapping pathways when tested individually using TOPPfun (overlapping area shows similar genes between organoid types, BP, Biological processes; CC, Cellular component; PW, Pathway). (D) Overlapping up- and down-regulated genes between 3 and 12 weeks of culturing in actual expression values [Log(FPKM)] and their corresponding fold change [Log2(FC)].
FIGURE 6
FIGURE 6
Functional amino acid transport assay using intestinal organoid monolayers. (A) 3-Dimensional organoids were dissociated into single cells and plated on Matrigel precoated (0.5% v/v) Transwell inserts. The monolayers were grown to confluence for 1 or 4 days and generated TEER values >750 Ω/cm2. The apical medium was replaced with DMEM and basolateral medium with HBSS. Amino acids (AA) and other molecules were measured in the basal compartment using TQMS. (B) AA concentrations (Log values) of individual amino acids and other molecules for 4 replicate Transwell inserts of ileum organoids. (C) AA concentrations in the basolateral compartment show increased transport of essential AA’s (orange).

References

    1. Andrews S. (2017). FastQC: A Quality Control Tool for High Throughput Sequence Data. Available online at: http://www.bioinformatics.babraham.ac.uk/projects/fastqc/
    1. Barker N., Van J. H., Kuipers J., Kujala P., van den Born M., Cozijnsen M., et al. (2007). Identification of stem cells in small intestine and colon by marker gene Lgr5. Nature 449 1003–1007. 10.1038/nature06196 - DOI - PubMed
    1. Belenky P., Bogan K. L., Brenner C. (2007). NAD+ metabolism in health and disease. Trends Biochem. Sci. 32 12–19. 10.1016/j.tibs.2006.11.006 - DOI - PubMed
    1. Benis N., Wells J. M., Smits M. A., Kar S. K., van der Hee B., Dos Santos V., et al. (2019). High-level integration of murine intestinal transcriptomics data highlights the importance of the complement system in mucosal homeostasis. BMC Genomics 20:1028. - PMC - PubMed
    1. Berglund L., Bjoerling E., Oksvold P., Fagerberg L., Asplund A., Szigyarto C. A. K., et al. (2008). A Genecentric human protein atlas for expression profiles based on antibodies. Mol. Cell Proteomics 7 2019–2027. 10.1074/mcp.r800013-mcp200 - DOI - PubMed