Review
. 2020 Sep;58(3):e2019RG000686.
doi: 10.1029/2019RG000686. Epub 2020 Jul 13.

Spaceborne Cloud and Precipitation Radars: Status, Challenges, and Ways Forward

Affiliations
Review

Spaceborne Cloud and Precipitation Radars: Status, Challenges, and Ways Forward

Alessandro Battaglia et al. Rev Geophys. 2020 Sep.

Abstract

Spaceborne radars offer a unique three-dimensional view of the atmospheric components of the Earth's hydrological cycle. Existing and planned spaceborne radar missions provide cloud and precipitation information over the oceans and land difficult to access in remote areas. A careful look into their measurement capabilities indicates considerable gaps that hinder our ability to detect and probe key cloud and precipitation processes. The international community is currently debating how the next generation of spaceborne radars shall enhance current capabilities and address remaining gaps. Part of the discussion is focused on how to best take advantage of recent advancements in radar and space platform technologies while addressing outstanding limitations. First, the observing capabilities and measurement highlights of existing and planned spaceborne radar missions including TRMM, CloudSat, GPM, RainCube, and EarthCARE are reviewed. Then, the limitations of current spaceborne observing systems, with respect to observations of low-level clouds, midlatitude and high-latitude precipitation, and convective motions, are thoroughly analyzed. Finally, the review proposes potential solutions and future research avenues to be explored. Promising paths forward include collecting observations across a gamut of frequency bands tailored to specific scientific objectives, collecting observations using mixtures of pulse lengths to overcome trade-offs in sensitivity and resolution, and flying constellations of miniaturized radars to capture rapidly evolving weather phenomena. This work aims to increase the awareness about existing limitations and gaps in spaceborne radar measurements and to increase the level of engagement of the international community in the discussions for the next generation of spaceborne radar systems.

Keywords: Doppler; cloud microphysics; convection; precipitation; radar.


Figures

Figure 1
Figure 1
Global mean energy budget for the first decade of the 21st century based on independent flux measurements. The numbers state magnitudes of the individual energy fluxes in W/m2, adjusted within their uncertainty ranges to close the energy and water budgets. The surface fluxes from IPCC 2007 are also included in pink for reference. Adapted from (L'Ecuyer et al., 2015). ©American Meteorological Society. Used with permission.
Figure 2
Figure 2
Mission timelines of TRMM, GPM, CloudSat, RainCube, and EarthCARE, together with the relevance of their radar operating bands to the detection of clouds and precipitation. ©Royal Meteorological Society and American Meteorological Society. Used with permission.
Figure 3
Figure 3
Precipitation climatology expressed in average rain rates (mm/hr) during the months of (a) December, January, and February (DJF) and (b) June, July, and August (JJA) from 1998 to 2013. The black contour inside the continental regions represents the 700 m elevation. Extracted from Houze et al. (2015) © American Geophysical Union. Used with permission.
Figure 4
Figure 4
The “champion storm” studied by Zipser et al. (2006), which occurred in northern Argentina during December 1997. The detailed three‐dimensional structure of this storm is shown using the blue, orange, and red surfaces that represent 20, 30, and 40 dBZ radar reflectivity isosurfaces, respectively. The surface precipitation rate is also shown (color scale).
Figure 5
Figure 5
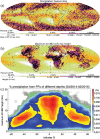
Locations of precipitation features (PFs) according to (a) their size, (b) 40 dBZ maximum echo top height as derived from the GPM‐CO Ku band data (adapted from Skofronick‐Jackson et al. (2018) ©Royal Meteorological Society. Used with permission). (c) Contributions to global precipitation from PFs of different maximum heights of the 20 dBZ echo (adapted from Liu and Zipser (2015) ©American Geophysical Union. Used with permission). The statistics are computed in 2° latitude bins, and total values add up to 100% per zonal bin. Note the logarithmic color scale.
Figure 6
Figure 6
(a) A multiyear annual zonal‐mean liquid water path (gray shading, ocean only O'Dell et al., 2008) and ice water path (blue shading, from CloudSat 2C‐ICE data set for 2006–2010). (b) A multiyear annual‐mean precipitation fractional occurrence from CloudSat 2C‐COLUMNPRECIP. (c and d) Latitude‐pressure sections of annual mean cloud ice water and liquid water content (Lee et al., 2014). Adapted from Stephens et al. (2018b) and Lee et al. (2014) ©American Meteorological Society and Springer Nature. Used with permission.
Figure 7
Figure 7
The distribution of the total rain volume from the CPR and PR as a function of rainfall intensity over tropical and subtropical oceans (35°S to 35°N) for the period from June 2006 through February 2009. Extracted from Berg et al. (2010) ©American Meteorological Society. Used with permission.
Figure 8
Figure 8
Vertical profiles of CloudSat radar reflectivity as a function of in‐cloud MODIS optical depth in the form of contoured frequency diagram classified according to cloudtop effective radius (r e) of (a) 6.5–10 (nonprecipitating clouds), (b) 10–15 (drizzling clouds), and (c) 15–20 μm (precipitating clouds). The probability distribution function of radar reflectivity normalized at each optical depth is shown using the color scale (%dBZ−1). Adapted from Suzuki et al. (2013) ©American Geophysical Union. Used with permission.
Figure 9
Figure 9
Image of RainCube in its fully deployed state.
Figure 10
Figure 10
Examples of vertical sections of precipitating systems around the globe observed by RainCube. In all panels the x axis represents the along‐track coordinate (see map insets for the specific ground track), and the y axis is the altitude above the reference ellipsoid in kilometers. Surface clutter is observed at the expected altitudes, and no range sidelobes contaminate the scene.
Figure 11
Figure 11
Existing gaps driven by the limited range in sensitivities of the existing and planned radar systems for single‐frequency, multifrequency, and Doppler measurements.
Figure 12
Figure 12
(a) Mean annual snow rate (mm water equivalent/year) derived from the 2C‐SNOW‐PROFILE CloudSat product for the period August 2006 to April 2011. (b) The ratio of the single retrieval uncertainty over the snowfall rate for the same period. Data are accumulated on 1° × 2° grid boxes. Uncertainties include both random and systematic errors. Adapted from Palerme et al. (2014) ©European Geosciences Union. Used with permission.
Figure 13
Figure 13
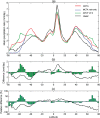
Discrepancies between state‐of‐the‐art global precipitation products and differences compared to MCTA (the merged CloudSat‐TRMM‐Aqua precipitation) estimate. (a) Zonal distribution of mean precipitation rates from the MCTA, Global Precipitation Climatology Project (GPCP), and CMAP. (b) Zonal difference between GPCP and MCTA (green bars) and CMAP and MCTA (solid black line). (c) As in (b) but for zonal relative differences calculated by dividing the zonal precipitation differences of each pair by the mean of the two. Calculations were performed for each 2.5° zonal bin. Extracted from Behrangi et al. (2014) ©American Meteorological Society. Used with permission.
Figure 14
Figure 14
Time‐height reflectivity profiles for an IPHEx overpass over a convective cell at X (left) and Ka (right) bands. In the left panel the different lines (blue, green, black, and cyan) correspond to the level below which the MS contribution becomes predominant at X, Ku, Ka, and W bands, respectively. In the right panel the continuous, dashed, and dotted white lines correspond to the levels at which the top‐down optical thickness exceeds 1, 3, and 5. Extracted from Battaglia, Mroz, Lang, et al. (2016) ©American Geophysical Union. Used with permission.
Figure 15
Figure 15
Example of observations collected on 7 December 2015 by Ka band ARM Zenith Radar (a) and by the CloudSat‐CPR (b) when it overpassed within 200 km of Atmospheric Raditation Measurement (ARM) Eastern North Atlantic (ENA) facility. Also displayed are simulations based on the KAZR scene for radar configurations of the (c) EarthCARE‐CPR, (d) CloudSat‐CPR, (e) ACCP‐CPR with a 250 m long pulse, and (f) ACCP‐CPR with a 100 m long pulse. For reference the lidar‐detected lowest liquid cloud base height (red dots) and the KAZR cloud top and cloud/virga base (black dots) are overlaid on these figures.
Figure 16
Figure 16
A conceptual view of the transports of air and condensed water mass (C W M) by deep convection. Observations of vertical profiles of air and condensed water mass fluxes (Q air and Q CWM, respectively) and of the temporal evolution of these quantities (d M/d t) could give unique and direct insight into convective transport (courtesy of G. Stephens and D‐Train team).
Figure 17
Figure 17
A simulated oceanic deep convective cloud using the System for Atmospheric Modeling (SAM) model (Khairoutdinov & Randall, 2003) at a 50 m horizontal and vertical resolution. The SAM model simulation was initialized using the Idealized Global Atmospheric Research Program's Atlantic Tropical Experiment (GATE) simulations of convection over the tropical Atlantic setup (Xu & Randall, 2001). The four panels indicate (a) nonattenuated 94 GHz radar reflectivity factor, (b) nonattenuated 94 GHz mean Doppler velocity, (c) attenuated 94 GHz radar reflectivity factor, and (d) simulated Doppler velocity from the EarthCARE CPR.
Figure 18
Figure 18
(a) Integrated attenuation from the top of the atmosphere in a moist tropical setting for various cloud and precipitation radar frequencies. Gas extinction coefficients are calculated using the Microwave Limb Sounder (MLS) millimeter‐wave propagation model (Read et al., 2004). (b) Vertical humidity profile used to calculate integrated attenuation.
Figure 19
Figure 19
Temperature in °C versus supersaturation in g/m3 with highlighted regions where riming, deposition, and sublimation processes are active. The color maps the relative humidity with respect to ice, R H i. The dashed blue line indicates the supersaturation of supercooled water relative to ice. Black lines correspond to different levels of R H i as indicated by the labels. The dashed lines surrounding each continuous line correspond to a ±3% change in R H i. Some of the dominant ice crystal habits as suggested by Bailey and Hallett (2009) for different environmental conditions are indicated at the top of the figure. Adapted from Battaglia and Kollias (2019) ©European Geosciences Union. Used with permission.
Figure 20
Figure 20
Examples of recent technology developments enabling cloud and precipitation radar concepts. (a) Mesh deployable antennas at Ka band and lower frequencies (https://85f2c62a-b345-48a7-8394-fe93e1395d10.filesusr.com/ugd/c5273f_0081c8a108f5424683ac6fd36d0025fe.pdf). (b) Membrane deployable antenna at X band (Cooley et al., 2019). (c) The G band VIPR (Vapor In‐cloud Profiling Radar) antenna system. (d) The GAISR W band FMCW radar (Cooper et al., 2020). (e) W band electronically scanning line feed array for cloud and precipitation (https://www.nuvotronics.com/antenna_array.php).
Figure 21
Figure 21
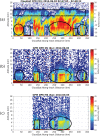
Collocated CloudSat and GPM reflectivity data with CloudSat Cloud Profiling Radar W band (a), GPM Normal Scan Ku band (b), and GPM Matched Scan Ka band data (c) for a precipitating system over the tropical Pacific Ocean (latitude: 4.6°N to 8.7°N, longitude: 163.4°E to 164.3°E) in the summer of 2014. The black rectangles (circles) identify regions where the different radar systems are complementary (synergistic). There is a ∼⃒5 min gap between the two satellite observations.
Figure 22
Figure 22
Collocated CloudSat and GPM water content and heating rate data. (a) Merged ice water content and precipitation liquid water content from the 2C‐RAIN‐PROFILE CloudSat product; (b) GPM normal‐scan liquid water content; (c) surface rain rates obtained using CloudSat 2C‐PRECIP COLUMN (black solid line), CloudSat 2C‐RAIN‐PROFILE (black dashed line), GPM DPR matched scan from 2A.GPM.DPR (red solid line), GPM DPR normal scan from 2A.GPM.DPR (red dashed line), GPM DPR matched scan and radiometer from 2B.GPM.DPRGMI.CORRA (green solid line), GPM DPR normal scan and radiometer from 2B.GPM.DPRGMI.CORRA (green dashed line), and GPM radiometer only from 2A.GPM.GMI.GPROF (blue solid line). (d) CloudSat shortwave heating rate from the 2B‐FLXHR data product; (e) CloudSat longwave heating rate from the 2B‐FLXHR data product; and (f) GPM latent heat from the 2A.GPM.DPR.GPM‐SLH data product. The white vertical lines in panel (a) correspond to nonconvergence of the 2C‐RAIN‐PROFILE algorithm.
Figure 23
Figure 23
An overview of the radar band and multifrequency “availability” in the case study of a vertical cross section through a tropical maritime organized convection for a Ku‐Ka‐W system with specifics as in Table 4. Extracted from Leinonen et al. (2015) ©European Geosciences Union. Used with permission.
Figure 24
Figure 24
Cloud systems and science themes where a future multifrequency radar system can provide novel information. Areas shaded in yellow (gray) correspond to regions where nonuniform‐beam‐filling (clutter suppression) corrections maybe critical.
Figure 25
Figure 25
Impact of characteristic size, ice density, PSD shape parameter, and internal structure parameters (γ and β) to the triple‐frequency radar signature in the D F R KaWD F R XKa plane for a population of ice particles. Extracted from Mason et al. (2019) ©European Geosciences Union. Used with permission.
Figure 26
Figure 26
Estimated (left) water content and (right) mass mean diameter derived from computed Ku, Ka, and W band reflectivity observations versus the respective true water content and mean diameter used in the observations synthesis. The DSD data used in the computation of the “a priori” reflectivities are derived from DSD observation collected at NASA Wallops Facility, while those used in evaluations were collected during OLYMPEX.
Figure 27
Figure 27
(a) Normalized Doppler velocity uncertainty ( σVD) as a function of normalized spectral width (σ N) for three different SNR values. The blue lines indicate the σ N for a spaceborne radar with an antenna diameter of 2.5 m and for different PRF values, and the red lines indicate the σ N for a spaceborne radar with an antenna diameter of 4.0 m and for different PRF values. The corresponding Doppler velocity uncertainties ( σVD) are shown in Table 6. (b) The NUBF Doppler velocity bias correction coefficient α NUBF (solid line) and the Doppler velocity uncertainty σVNUBF introduced to the estimated Doppler velocity due to uncertainty in the α NUBF value.
Figure 28
Figure 28
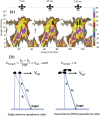
(a) A temporal sequence of three time snapshots 0, 30, and 120 s apart of the same deep convective cloud described in Figure 17, as seen by a CubeSat Ka band radar with a 1.6 m antenna. The arrows indicate the relative motion of the radar reflectivity echoes as depicted using echo correlation techniques. (b) One way of implementing the DPCA technique, see text for details. In the second panel the radar is displaced vertically for clarity.
Figure 29
Figure 29
Radiosonde‐validated measurements from the VIPR water vapor DAR at Scripps Institute of Oceanography. (a) Uncalibrated, G band (167 GHz) radar reflectivity. (b) Comparison of reflectivity profiles at 167 and 174.8 GHz with 5 s temporal resolution, where each trace is normalized to its corresponding value at 100 m. The excess absorption from water vapor at 174.8 GHz is clearly apparent with increasing range. (c) Retrieved humidity map for the same scene measured in (a). (d) Comparison of two radiosonde humidity profiles with that from DAR with 5 min of averaging.
Figure 30
Figure 30
(left) Vertical reflectivity profiles for a squall line sampled at different angles for the normal and in oversampling mode during the TRMM end‐of‐mission experiment. (right) Improvement in the top height (compare top two panels), PIA (center panels), and reflectivity cut at 2 km height (bottom panels) by using oversampling. Courtesy of N. Takahashi.
Figure 31
Figure 31
Proposed aircraft field campaign configuration to characterize extinction profiles. The rain scene is a CloudSat image of Tropical Storm Ernesto (26 August 2006).
Figure A1
Figure A1
Gas attenuation in the range of frequencies between 5 and 250 GHz for two types of atmospheres (a very moist, midlatitude summer atmosphere and a very dry, high‐latitude winter atmosphere). Attenuation due to cloud water at 10°C for a total of 100 g/m2 is plotted in dashed line with the gray shading corresponding to the variability when moving temperature from −35°C to +30°C. Radar frequencies are generally selected in the window regions, that is, away from the water vapor and the oxygen absorption bands, apart for the differential absorption radar (DAR) with frequency located in the 183 GHz water vapor absorption band (blue shaded region). Allocation of current and planned spaceborne radar systems is shown as well.
Figure A2
Figure A2
Effect of NUBF on the reflectivity profile for a radar beam half‐filled with a high rain rate and half‐filled with a low rain rate.
Figure A3
Figure A3
(left) Radar reflectivity coefficients for different frequencies (as indicated in the legend) for an exponential population of raindrops with different mean mass‐weighted equivolume diameters for a liquid water content of 1 g/m3. Scattering properties are computed for spheres by Mie theory (continuous lines) and for spheroids at vertical incidence by T‐matrix (dashed lines). (right) Same as in the left panel but for D F R with respect to Rayleigh. The shaded regions indicate values of μ between −2 (upper boundary) and 3 (lower boundary).
Figure A4
Figure A4
(left) Vertical Doppler velocities in the absence of vertical wind for different frequencies (as indicated in the legend) for an exponential population of raindrops with different mean mass‐weighted equivolume diameters. The shading corresponds to the variability in the shape parameter, μ, between −2 and 3. (right) Same as in the left panel but for the differential Doppler velocity (DDV) with respect to Rayleigh.
Figure A5
Figure A5
(left) Radar reflectivity coefficients for different frequencies (as indicated in the legend) for an exponential population of ice crystals with different mean mass‐weighted maximum diameters for an equivalent liquid water content of 1 g/m3. Scattering properties are computed at vertical incidence according to the self‐similar Rayleigh‐Gans approximation for the A1 model (continuous lines) and the A6 model (dashed lines) from Leinonen and Szyrmer (2015). The two models correspond to fluffy aggregates and heavily rimed crystals, respectively. (right) Same as in the left panel but for D F R with respect to the Rayleigh reference. The shading corresponds to a variability in the shape parameter μ between −2 and 3.
Figure A6
Figure A6
(left) Extinction for different frequencies (as indicated in the legend) for an exponential population of raindrops with different mean mass‐weighted equivolume diameters. Scattering properties are computed for spheres by Mie theory (continuous lines) and for spheroids at vertical incidence by T‐matrix (dashed lines). The shading corresponds to a variability in the shape parameter μ between −2 and 3. (right) Same as in the left panel but for ice crystals. The shading corresponds to a variability in the shape parameter μ between −1 and 3 with continuous lines for aggregates and dashed lines for heavily rimed crystals.

References

    1. Ackerman, S. A. , Platnick, S. , Bhartia, P. K. , Duncan, B. , L'Ecuyer, T. , Heidinger, A. , & Smith, N. (2018). Satellites see the world's atmosphere. Meteorological Monographs, 59, 4.1–4.53. 10.1175/AMSMONOGRAPHS-D-18-0009.1 - DOI
    1. Adhikari, N. B. , & Nakamura, K. (2003). Simulation‐based analysis of rainrate estimation errors in dual‐wavelength precipitation radar from space. Radio Science, 38(4), 1066 10.1029/2002RS002775 - DOI
    1. Anderson, E. (2018). Statement of guidance for global numerical weather prediction (NWP). (Tech. Rep.). https://www.wmo.int/pages/prog/www/OSY/GOS-RRR.html:WMO
    1. Andsager, K. , Beard, K. V. , & Laird, N. F. (1999). Laboratory measurements of axis ratios for large raindrops. Journal of the Atmospheric Sciences, 56(15), 2673–2683. 10.1175/1520-0469(1999)056<2673:LMOARF>2.0.CO;2 - DOI
    1. Atlas, D. (1990). Radar in meteorology: Battan Memorial and 40th Anniversary Radar Meteorology Conference. In American Meteorological Society, Boston, pp. 806.

LinkOut - more resources