

Autoimmunity gene IRGM suppresses cGAS-STING and RIG-I-MAVS signaling to control interferon response
- PMID: 32715615
- PMCID: PMC7507369
- DOI: 10.15252/embr.202050051
Autoimmunity gene IRGM suppresses cGAS-STING and RIG-I-MAVS signaling to control interferon response
Abstract
Activation of the type 1 interferon response is extensively connected to the pathogenesis of autoimmune diseases. Loss of function of Immunity Related GTPase M (IRGM) has also been associated to several autoimmune diseases, but its mechanism of action is unknown. Here, we found that IRGM is a master negative regulator of the interferon response. Several nucleic acid-sensing pathways leading to interferon-stimulated gene expression are highly activated in IRGM knockout mice and human cells. Mechanistically, we show that IRGM interacts with nucleic acid sensor proteins, including cGAS and RIG-I, and mediates their p62-dependent autophagic degradation to restrain interferon signaling. Further, IRGM deficiency results in defective mitophagy leading to the accumulation of defunct leaky mitochondria that release cytosolic DAMPs and mtROS. Hence, IRGM deficiency increases not only the levels of the sensors, but also those of the stimuli that trigger the activation of the cGAS-STING and RIG-I-MAVS signaling axes, leading to robust induction of IFN responses. Taken together, this study defines the molecular mechanisms by which IRGM maintains interferon homeostasis and protects from autoimmune diseases.
Keywords: IRGM; RIG-I-MAVS; autophagy; cGAS-STING; mitophagy.
© 2020 The Authors. Published under the terms of the CC BY 4.0 license.
Conflict of interest statement
The authors declare that they have no conflict of interest.
Figures
- A
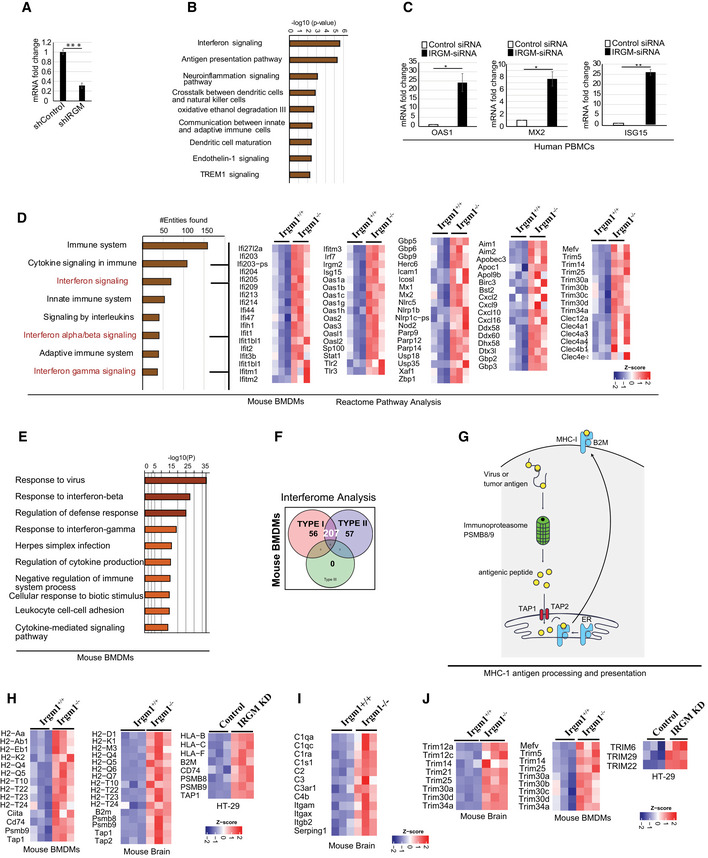
IRGM knockdown efficiency HT29 stably expressing control shRNA or IRGM shRNA as analyzed using qRT–PCR. Mean ± SD, n = 3 (biological replicates), ***P < 0.0005, Student's unpaired t‐test.
- B
The bar graphs represent highly enriched biological pathways upregulated in gene ontology (GO)‐based Ingenuity pathway analysis using sets of genes induced (1.5‐fold, P < 0.05, Wald test, n = 3) in IRGM shRNA knockdown HT29 cells compared to control shRNA cells.
- C
qRT–PCR validation of RNA‐seq data in control siRNA and IRGM siRNA transfected human PBMC cells. Mean ± SD, n = 3 individual human samples, *P < 0.05, **P < 0.005, Student's unpaired t‐test.
- D
Bar graph represents top canonical biological pathways upregulated in GO‐based Reactome pathway analysis using sets of genes induced (1.5‐fold, P < 0.05, Wald test, n = 3) in Irgm1 −/− mouse BMDMs compared to Irgm1 +/+ mouse BMDMs. Heatmaps were generated for sentinel interferon‐regulated genes (three biological replicates).
- E
Bar graph represents top canonical biological pathways upregulated in GO‐based metascape pathway analysis using sets of genes induced (1.5‐fold, P < 0.05, Wald test, n = 3) in Irgm1 knockout mouse BMDMs compared to wild‐type mouse BMDMs.
- F
Interferome database analysis with sets of genes induced (1.5‐fold, P < 0.05, Wald test, n = 3) in BMDMs of Irgm1 −/− compared to BMDMs of Irgm1 +/+ wild‐type mice. The venn diagram depicts the total number of upregulated type I and type II IFN‐regulated genes in Irgm1 −/− mouse BMDMs.
- G
Diagrammatic representation of MHC‐1 antigen processing and presentation pathway.
- H
Heatmaps of the genes of this pathway differentially expressed (1.5‐fold, P < 0.05, Wald test, n = 3) in Irgm1 +/+ and Irgm1 −/− mouse BMDMs and brain and also control and IRGM knockdown HT29 cells.
- I
Heatmaps showing genes of complement system pathway upregulated (1.5‐fold, P < 0.05, Wald test, n = 3) in the brain of Irgm1 −/− mice compared to Irgm1 +/+ mice.
- J
Heatmaps of the TRIM family genes upregulated (1.5‐fold, P < 0.05, Wald test, n = 3) in Irgm1 −/− mouse BMDMs and brain and also IRGM knockdown HT29 cells.
- A
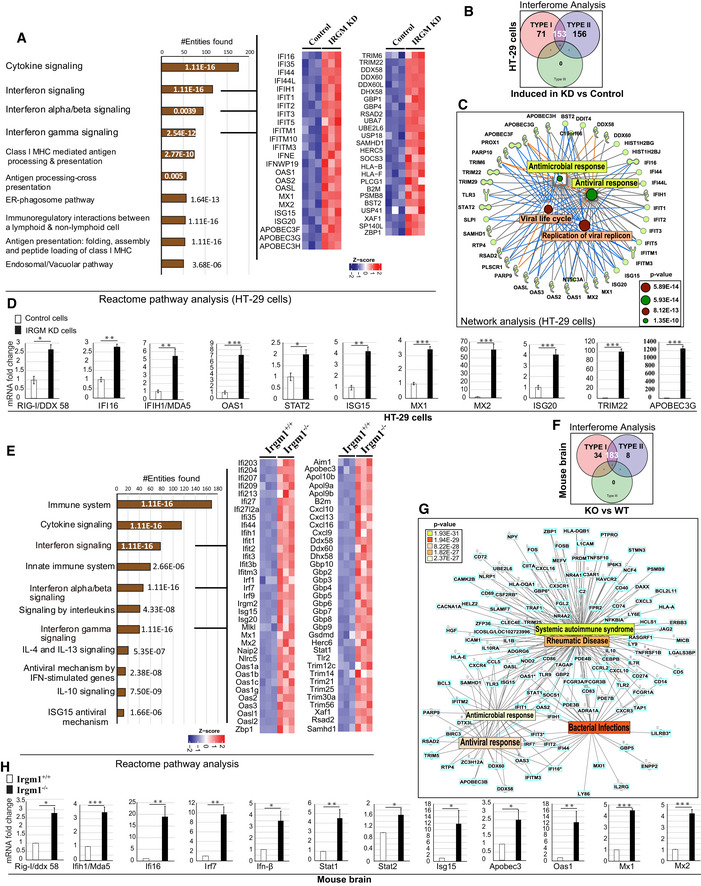
The bar graph represents top 10 biological pathways upregulated in gene ontology (GO)‐based Reactome pathway analysis using a set of genes induced (1.5‐fold, P < 0.05 Wald test, three biological replicates) in RNA‐seq analysis in IRGM shRNA knockdown HT29 cells compared to control shRNA cells. Heatmaps were generated for sentinel interferon‐regulated genes (three biological replicates) using “ComplexHeatmap” library using “R” Bioconductor package where the gene expression matrix was transformed into z‐score. The heatmap was generated from the common genes present in the three GO terms indicated by the three black lines. The numbers on the bars indicate the P‐value of that particular GO term.
- B
Interferome database analysis with a set of genes induced (1.5‐fold, P < 0.05 Wald test, three biological replicates) in IRGM shRNA knockdown HT29 cells compared to control shRNA cells. The venn diagram depicts the total number of upregulated type I and type II IFN‐regulated genes in IRGM KD cells.
- C
Network pathway analysis using IPA. The molecular network of genes connected with the top 4 function‐associated genes (1.5‐fold, P < 0.05 Wald test, three biological replicates) upregulated in IRGM knockdown HT29 cells. The complete list is documented in Dataset EV2.
- D
The qRT–PCR validation of RNA‐seq data in control and IRGM KD HT29 cells. Mean ± SD, n = 3 (biological replicates), *P < 0.05, **P < 0.005, ***P < 0.0005, Student's unpaired t‐test.
- E
The bar graph represents the top pathways upregulated in GO‐based Reactome pathway analysis using set of genes induced (1.5‐fold, P < 0.05 Wald test, three mice each group) in the brain of Irgm1 −/− mice compared to Irgm1 +/+ wild‐type mice. Heatmaps were generated for sentinel interferon‐regulated genes (three biological replicates) using “ComplexHeatmap” library using “R” Bioconductor package where the gene expression matrix was transformed into z‐score. The heatmap was generated from the common genes present in the three GO terms indicated by the three black lines. The numbers on the bars indicate the P‐value of that particular GO term.
- F
Interferome database analysis with a set of genes induced (1.5‐fold, P < 0.05, 3 biological replicates) in the brain of Irgm1 −/− mice compared to Irgm1 +/+ wild‐type mice. The venn diagram depicts the total number of upregulated type I and type 2 IFN‐regulated genes in Irgm1 −/− mouse brain.
- G
Network pathway analysis using IPA. The molecular network of genes connected with the top five functions/diseases associated with genes (1.5‐fold, P < 0.05 Wald test, three biological replicates) upregulated in Irgm1 knockout mouse brain. The complete list is documented in Dataset EV2.
- H
The qRT–PCR validation of RNA‐seq data in Irgm1 +/+ and Irgm1 −/− mouse brain. Mean ± SD, n = 3 (biological replicates), *P < 0.05, **P < 0.005, ***P < 0.0005, Student's unpaired t‐test.
- A
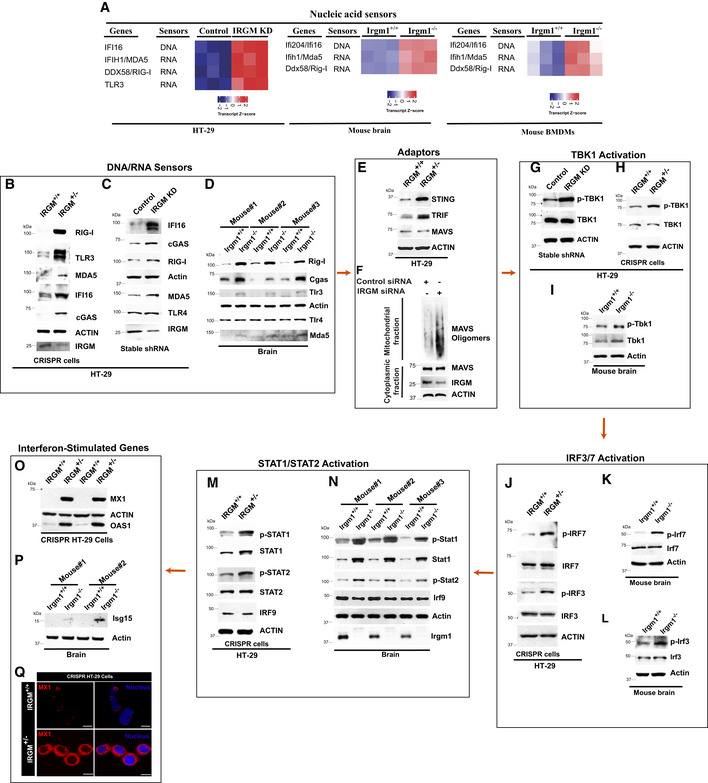
Heatmap of nucleic acid sensor proteins upregulated in IRGM KD HT29 cells and Irgm1 −/− mouse brain and BMDMs.
- B–D
Western blot analysis to determine levels of nucleic acid sensor proteins with lysates of (B) HT29 control (henceforth IRGM+/+) and single allele CRISPR knockout IRGM cells (henceforth IRGM+/−), (C) HT29 cells stably expressing control shRNA or IRGM shRNA, (D) Irgm1 +/+ and Irgm1 −/− mouse brain (n = 3 mice).
- E
Western blot analysis to determine levels of adaptor proteins in control and IRGM+/− HT29 cells.
- F
SDD‐AGE followed by western blot analysis with a mitochondrial fraction from control and IRGM siRNA knockdown THP1 cells. Western blot analysis with cytoplasmic fraction was also performed.
- G–I
Western blot analysis performed with lysates of (G) control and stable IRGM shRNA knockdown HT29 cells (H) IRGM+/+ and IRGM+/− HT29 cells, and (I) Irgm1 +/+ and Irgm1 −/− mouse brain to determine levels of TBK1 protein.
- J–L
Western blot analysis performed with lysates of (J) IRGM+/+ and IRGM+/− HT29 cells (K, L) Irgm1 +/+ and Irgm1 −/− mouse brain to determine levels of IRF proteins.
- M, N
Western blot analysis performed with lysates of (M) IRGM+/+ and IRGM+/− HT29 cells, (N) Irgm1 +/+ and Irgm1 −/− mouse brain to determine levels of STAT proteins (n = 3 mice).
- O, P
Western blot analysis performed with lysates of (O) IRGM+/+ and IRGM+/− HT29 cells. 2 biological replicates are shown. (P) Irgm1 +/+ and Irgm1 −/− mouse brain to determine levels of ISG proteins (n = 2 mice).
- Q
Representative confocal image of immunofluorescence assay performed with IRGM+/+ and IRGM+/− HT29 cells stained with MX1 antibodies. Scale bar, 10 μm.
- A
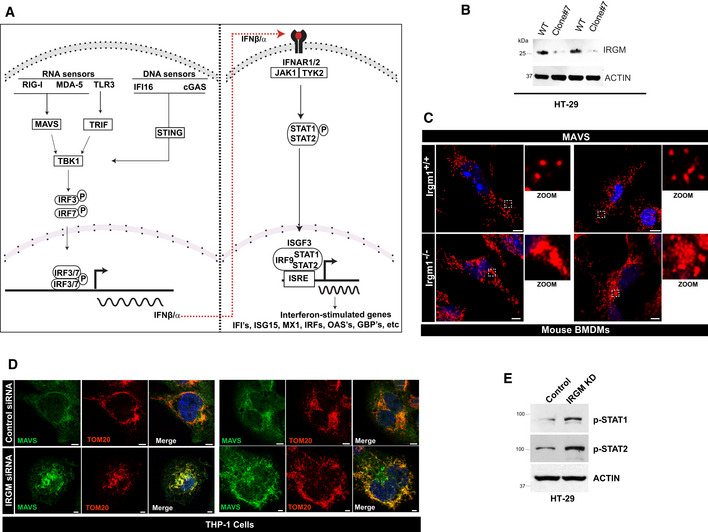
The graphical representation of the pathways associated with type I IFN and ISG production.
- B
Western blot analysis with lysates of wild type and CRISPR‐Cas9 clone #7 of HT29 cells. Clone #7 was identified to be a single allele knockout for IRGM.
- C
Representative confocal images of Irgm1 +/+ and Irgm1 −/− mouse BMDMs immunostained with MAVS (red) antibody. Scale bar, 5 μm. Zoom panels are digital magnifications.
- D
Representative confocal images of control siRNA and IRGM siRNA transfected THP‐1 cells immunostained with MAVS (green) and TOM20 (red) antibodies. Control cells, scale bar, 5 μm; IRGM siRNA cells, scale bar, 3 μm.
- E
Western blot analysis to assess activation of p‐STAT1 and p‐STAT2 in HT29 cells stably expressing control shRNA and IRGM shRNA.
- A
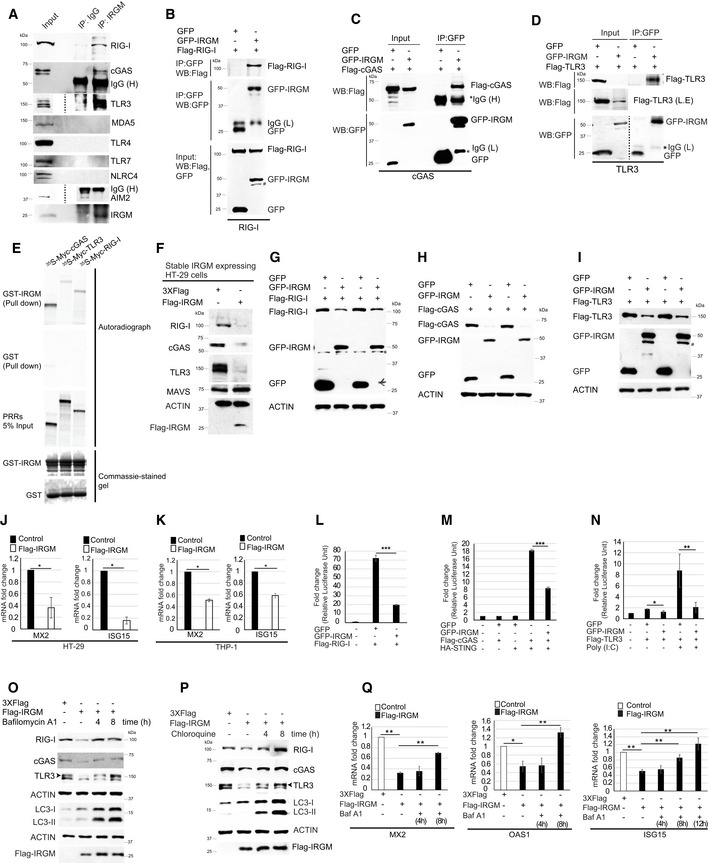
Immunoprecipitation (IP) analysis of the interaction between endogenous IRGM and endogenous RIG‐I, cGAS, MDA5, TLR3, TLR4, TLR7, NLRC4, and AIM2 in THP‐1 cell lysates. IgG (H), IgG heavy chain.
- B–D
Co‐immunoprecipitation (Co‐IP) analysis of the interaction between (B) GFP‐IRGM and Flag‐RIG‐I, (C) GFP‐IRGM, and Flag‐cGAS, (D) GFP‐IRGM and Flag‐TLR3 in HEK293T cell lysates. L.E, Long exposure of input blot. IgG (L), IgG Light chain; IgG (H), IgG heavy chain.
- E
GST pulldown assay of in vitro translated and radiolabelled myc‐tagged cGAS, RIG‐I, and TLR3 with GST or GST‐tagged IRGM.
- F
Western blot analysis with the lysates of HT‐29 cells stably transfected with control or Flag‐IRGM plasmid and probed with the indicated antibodies.
- G–I
Western blot analysis with lysates of HEK293T cells transiently expressing GFP or GFP‐IRGM and (G) Flag‐RIG‐I or (H) Flag‐cGAS or (I) or Flag‐TLR3. Two biological replicates are shown.
- J–K
The qRT–PCR analysis with RNA isolated from (J) control and Flag‐IRGM stable HT‐29 cells (K) THP‐1 cells transiently transfected with control or Flag‐IRGM plasmid. n = 3 (biological replicates). Mean ± SD, *P < 0.05, Student's unpaired t‐test.
- L–N
Luciferase reporter assays in HEK293T cells transiently transfected with ISRE reporter plasmid and other plasmids as indicated. Mean ± SD, n = 3 (biological repeats), *P < 0.05, **P < 0.005, ***P < 0.0005, Student's unpaired t‐test.
- O
Western blotting analysis with lysates of control and untreated or bafilomycin A1 (300 nM; 4 and 8 h) treated Flag‐IRGM expressing HT29 stable cell lines.
- P
Western blotting analysis with lysates of control and untreated or chloroquine (50 μM; 4 and 8 h) treated Flag‐IRGM expressing HT29 stable cell lines.
- Q
The qRT–PCR analysis with RNA isolated from untreated or bafilomycin A1 (300 nM; 4, 8, and 12 h) treated control or Flag‐IRGM expressing HT‐29 stable cells as indicated. Mean ± SD, n = 3 (biological replicates), *P < 0.05, **P < 0.005 Student's unpaired t‐test.
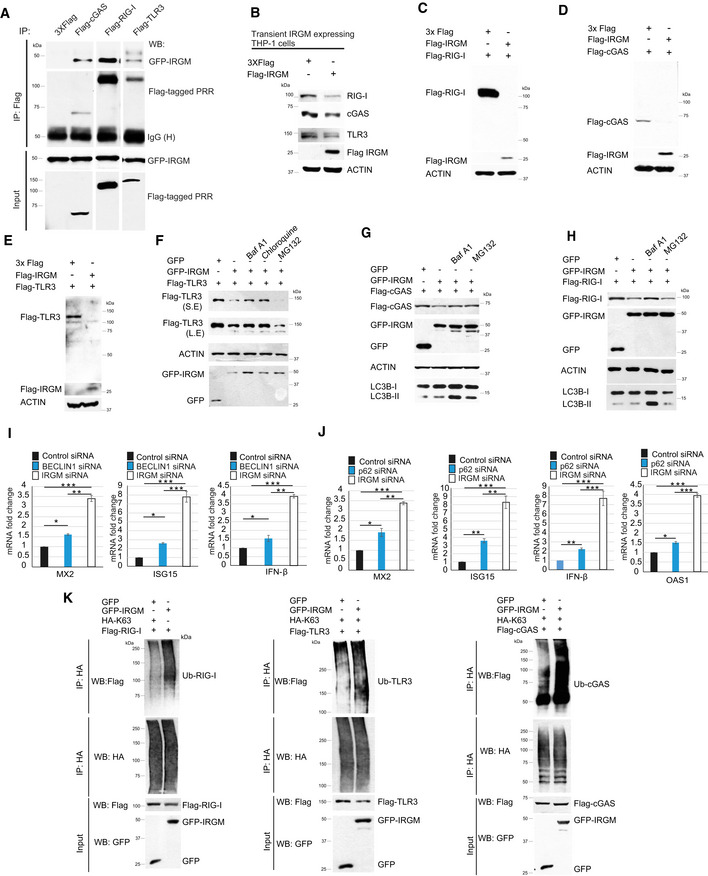
- A
Co‐IP analysis of the interaction between GFP‐IRGM and Flag‐cGAS, Flag‐RIG‐I and Flag‐TLR3 in HEK293T cell lysates.
- B
Western blot analysis with lysates of THP‐1 cell transiently transfected (4 h) with control or Flag‐IRGM plasmid and probed with indicated antibodies.
- C–E
Western blot analysis of HEK293T cell lysates expressing 3X‐Flag or Flag‐IRGM and (C) Flag‐RIG‐I or (D) Flag‐cGAS or (E) Flag‐TLR3.
- F–H
HEK293T cells expressing GFP or GFP‐IRGM and (F) Flag‐TLR3, (G) Flag‐cGAS, and (H) Flag‐RIG‐I were treated with bafilomycin A1 (300 nM, 8 h) or chloroquine (50 μM, 8 h) or MG132 (20 μM, 8 h) and cell lysates were subjected to western blot analysis with the indicated antibodies.
- I
The qRT–PCR analysis with RNA isolated form control siRNA, BECLIN1 siRNA or IRGM siRNA transfected THP‐1 cells. Mean ± SD, n = 3 (biological replicates), *P < 0.05, **P < 0.005, ***P < 0.0005 Student's unpaired t‐test.
- J
The qRT–PCR analysis with RNA isolated form control siRNA, p62 siRNA or IRGM siRNA transfected THP‐1 cells. Mean ± SD, n = 3 (biological replicates), *P < 0.05, **P < 0.005, ***P < 0.0005 Student's unpaired t‐test.
- K
Co‐immunoprecipitation (Co‐IP) analysis of the ubiquitination of Flag‐RIG‐I, Flag‐TLR3, or Flag‐cGAS in the presence of EGFP or GFP‐IRGM and probed with indicated antibodies. IP samples are adjusted according to Input samples.
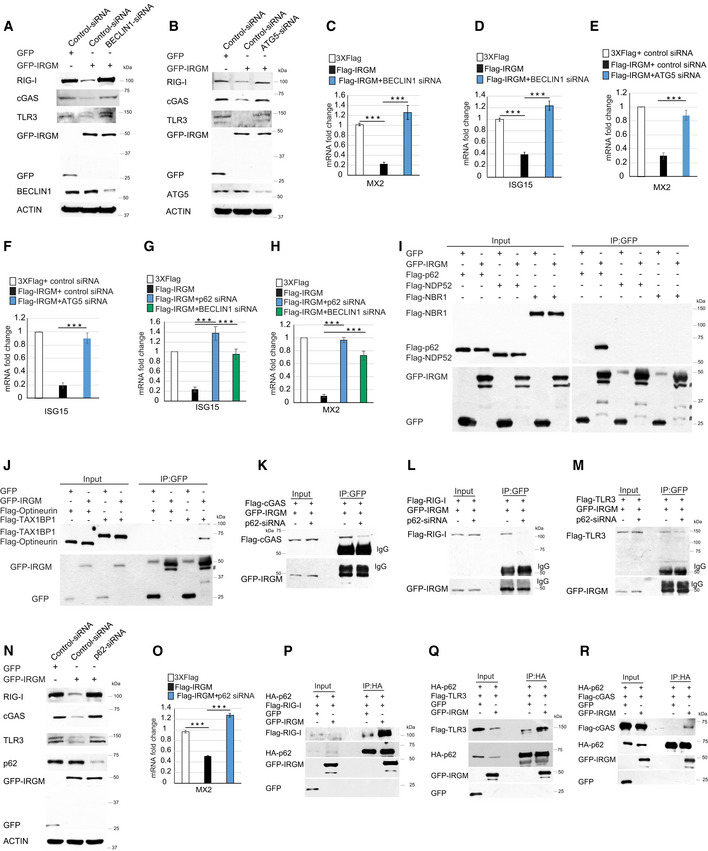
- A
The cell lysates of control or BECLIN1 siRNA transfected THP‐1 cells expressing GFP or GFP‐IRGM were subjected to immunoblotting with indicated antibodies.
- B
The cell lysates of control or ATG5 siRNA transfected THP‐1 cells expressing GFP or GFP‐IRGM were subjected to immunoblotting with indicated antibodies.
- C, D
qRT–PCR analysis with RNA isolated from control or BECLIN1 siRNA transfected THP‐1 cells expressing 3X‐Flag epitope or Flag‐IRGM as indicated. Mean ± SD, n = 3 (biological replicates), ***P < 0.0005, Student's unpaired t‐test.
- E, F
qRT–PCR analysis with RNA isolated from control or ATG5 siRNA transfected THP‐1 cells expressing 3X‐Flag epitope or Flag‐IRGM as indicated. Mean ± SD, n = 3 (biological replicates), ***P < 0.0005, Student's unpaired t‐test.
- G, H
qRT–PCR analysis with RNA isolated from control or p62 siRNA or BECLIN1 siRNA transfected HT29 cells expressing 3X‐Flag epitope or Flag‐IRGM as indicated. Mean ± SD, n = 3 (biological replicates), ***P < 0.0005, Student's unpaired t‐test.
- I, J
Co‐IP analysis of the interaction between GFP‐IRGM with (I) Flag‐p62 or Flag‐NDP52 or Flag‐NBR1 or (J) Flag‐optineurin or Flag‐TAX1BP1 in HEK293T cell lysates.
- K–M
Co‐IP analysis of the interaction between GFP‐IRGM with (K) Flag‐cGAS, (L) Flag‐RIG‐I, (M) Flag‐TLR3 in control siRNA or p62 siRNA transfected HEK293T cell lysates.
- N
The cell lysates of control or p62 siRNA transfected THP‐1 cells expressing GFP or GFP‐IRGM (as indicate) were subjected to immunoblotting with indicated antibodies.
- O
The qRT–PCR analysis with RNA isolated from control or p62 siRNA transfected THP‐1 cells expressing 3X‐Flag epitope or Flag‐IRGM as indicated. Mean ± SD, n = 3 (biological replicates), ***P < 0.0005, Student's unpaired t‐test.
- P–R
Co‐IP analysis of the interaction between HA‐p62 and (P) Flag‐RIG‐I, (Q) Flag‐TLR3, (R) Flag‐cGAS in the absence and presence of GFP or GFP‐IRGM in HEK293T cell lysates.
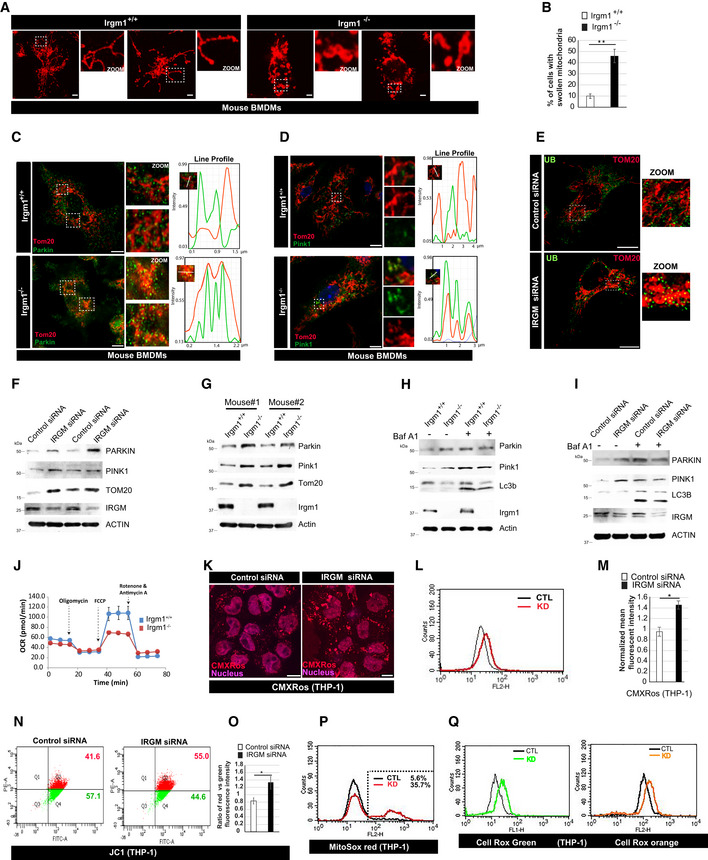
- A
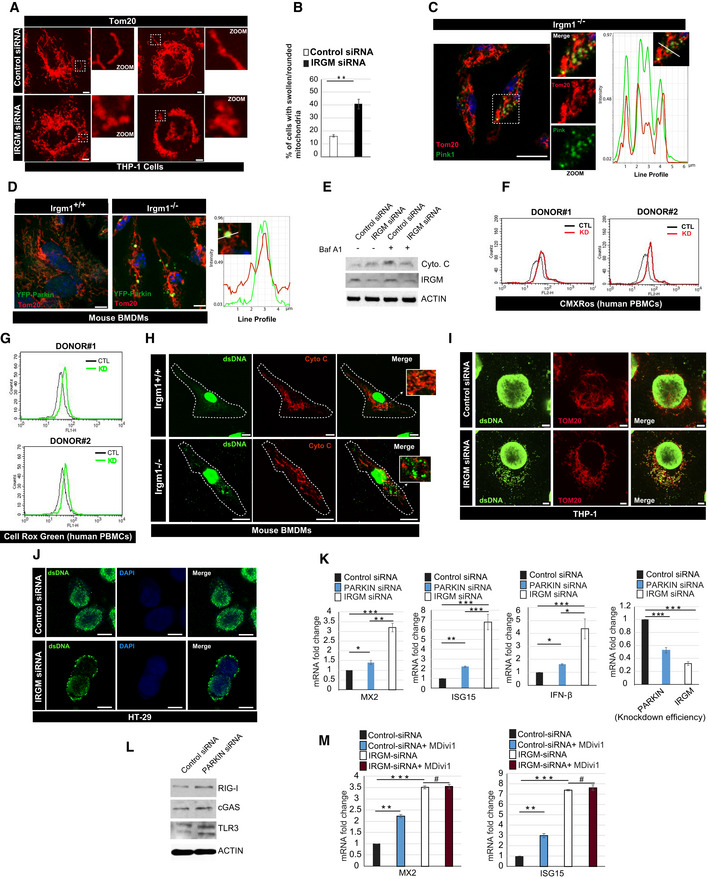
Representative confocal images of Irgm1 +/+ and Irgm1 −/− mouse BMDMs processed for IF analysis with Tom20 antibody. Scale bar, 5 μm. Zoom panels are digital magnifications.
- B
The graph depicts the percentage of cells with swollen/rounded mitochondria in Irgm1 +/+ and Irgm1 −/− mouse BMDMs. Mean ± SD, n = 3 (biological repeats), **P < 0.005, Student's unpaired t‐test.
- C
Representative confocal (STED) images of Irgm1 +/+ and Irgm1 −/− mouse BMDMs processed for IF analysis with Tom20 and Parkin antibodies. Line profile: Co‐localization analysis using line intensity profiles. Scale bar, 5 μm. Zoom panels are digital magnifications.
- D
Representative confocal (STED) images of Irgm1 +/+ and Irgm1 −/− mouse BMDMs processed for IF analysis with Tom20 and Pink1 antibodies. Line profile: Co‐localization analysis using line intensity profiles. Scale bar, 5 μm. Zoom panels are digital magnifications.
- E
Representative confocal images of control siRNA and IRGM siRNA transfected THP‐1 cells processed for IF analysis with ubiquitin (green) and TOM20 (red) antibodies. Scale bar, 10 μm. Zoom panels are digital magnifications.
- F
Western blot analysis of mitochondrial fraction of control siRNA and IRGM siRNA transfected THP‐1 cells, probed with indicated antibodies. Two biological replicates are shown.
- G
Western blot analysis of mitochondrial fraction of Irgm1 +/+ and Irgm1 −/− mouse BMDM cells, probed with indicated antibodies (n = 2 mice).
- H
Western blot analysis of mitochondrial fraction of Irgm1 +/+ and Irgm1 −/− mouse BMDM cells untreated or treated with bafilomycin A1 (300 nM, 3 h), probed with indicated antibodies.
- I
Western blot analysis of mitochondrial fraction of control siRNA and IRGM siRNA transfected THP‐1 cells untreated or treated with bafilomycin A1 (300 nM, 3 h), probed with indicated antibodies.
- J
Seahorse XF Cell Mito stress test for analysis of mitochondrial function in Irgm1 +/+ and Irgm1 −/− mouse BMDM cells. The experiments were performed using the XF24 extracellular flux analyzer, and the flow chart showed the measurement of oxygen consumption rate (OCR) as described in materials and methods. Results shown represent mean ± standard error (n = 3 mice). *P < 0.05.
- K
Representative confocal images of control and IRGM siRNA transfected THP‐1 cells stained with CMXRos red dye. Scale bar, 7.5 μm.
- L
Flow cytometry analysis of control siRNA and IRGM siRNA transfected THP‐1 cells stained with CMXRos red dye (10 nM, 30 min).
- M
Graph depicts the normalized mean fluorescent intensity of control and IRGM knockdown THP‐1 cells stained with CMXRos. Mean ± SD, n = 3 (biological repeats), *P < 0.05, Student's unpaired t‐test.
- N
Representative dot plot showing flow cytometry analysis of control and IRGM siRNA knockdown THP‐1 cells stained with JC‐1 dye (2 μM, 30 min). At low mitochondrial membrane potential, JC‐1 is predominantly a monomer that yields green fluorescence, whereas at mitochondrial membrane potential the dye aggregates producing a red to orange colored emission.
- O
The graph depicts the ratio of red vs. green fluorescent intensity in control and IRGM siRNA knockdown THP‐1 cells stained with JC‐1 dye. Mean ± SD, n = 3 (biological replicates), *P < 0.05, Student's unpaired t‐test.
- P
Representative flow cytometry analysis of control and IRGM siRNA transfected THP‐1 cells stained with MitoSox red dye (1 μM, 20 min). The percentage of control and IRGM knockdown cells with increased red fluorescence (mitochondrial ROS generation) is depicted.
- Q
Representative flow cytometry analysis of control and IRGM siRNA transfected THP‐1 cells stained with CellRox green and CellRox orange dye (1 μM, 30 min).
- A
Representative confocal images of control siRNA and IRGM siRNA transfected THP‐1 cells processed for IF analysis with TOM20 antibody. Left panels, scale bar, 5 μm; right panels scale bar, 3 μm. Zoom panels are digital magnifications.
- B
The graph depicts the percentage of cells with swollen or rounded mitochondria in control siRNA, and IRGM siRNA transfected THP‐1 cells. Mean ± SD, n = 3 (biological replicates), **P < 0.005, Student's unpaired t‐test.
- C
Representative confocal images of Irgm1 −/− mouse BMDMs immunostained with TOM20 (red) and Pink1 (green) antibodies. Right Panel: Co‐localization analysis using line intensity profiles. Scale bar, 10 μm. Zoom panels are digital magnifications.
- D
Representative confocal images of Irgm1 +/+ and Irgm1 −/− mouse BMDMs transfected with YFP‐Parkin (green) and immunostained with Tom20 (red) antibody. Right Panel: Co‐localization analysis using line intensity profiles. Scale bar, 5 μm.
- E
Western blot analysis of the mitochondrial fraction of control siRNA and IRGM siRNA transfected THP‐1 cells untreated or treated with bafilomycin A1 (300 nM, 4 h), probed with indicated antibodies.
- F
Flow cytometry analysis of control siRNA and IRGM siRNA transfected human PBMCs from two donors stained with CMXRos red dye (10 nM, 30 min).
- G
Representative flow cytometry analysis of control and IRGM siRNA transfected human PBMCs from two donors stained with CellRox green dye (1 μM, 30 min).
- H
Representative confocal images of Irgm1 +/+ and Irgm1 −/− mouse BMDMs immunostained with dsDNA (green) and Cytochrome‐C (red) antibodies. Zoom panels show extracellular DNA in the cytoplasm. Dashed lines indicate the periphery of the cells. Upper panels, scale bar, 5 μm; lower panels, scale bar, 10 μm. Zoom panels are digital magnifications.
- I
Representative confocal images of control siRNA and IRGM siRNA transfected THP‐1 cells immunostained with dsDNA (green) and TOM20 (red) antibodies. Scale bar, 3 μm.
- J
Representative confocal images of control siRNA and IRGM siRNA transfected HT‐29 cells immunostained with dsDNA (green) antibodies and DAPI (blue) staining. Scale bar, 8 μm.
- K
qRT–PCR analysis with RNA isolated form control siRNA, PARKIN siRNA or IRGM siRNA transfected THP‐1 cells. Mean ± SD, n = 3 (biological replicates), *P < 0.05, **P < 0.005, ***P < 0.0005 Student's unpaired t‐test.
- L
Western blot analysis of lysates prepared from control siRNA and PARKIN siRNA transfected THP‐1 cells, probed with indicated antibodies.
- M
qRT–PCR analysis with RNA isolated form control siRNA or IRGM siRNA transfected THP‐1 cells and treated with MDIVI‐1 (50 μg/ml, 1 h). Mean ± SD, n = 3 (biological replicates), *P < 0.05, **P < 0.005, ***P < 0.0005, #insignificant. Student's unpaired t‐test.
- A
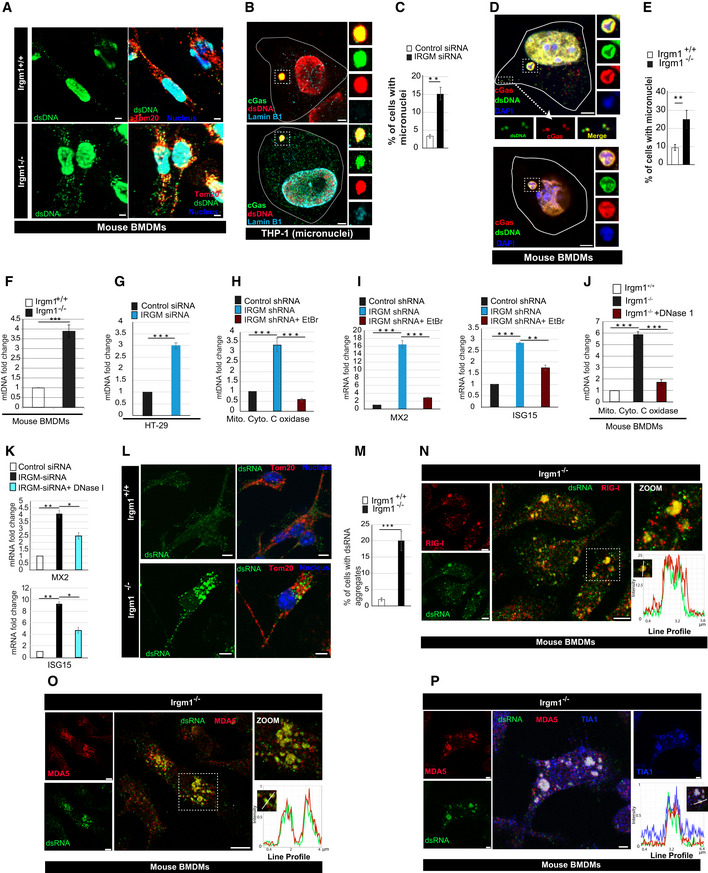
Representative confocal images of Irgm1 +/+ and Irgm1 −/− mouse BMDMs processed for IF analysis with Tom20 (red) and dsDNA (green) antibody. Scale bar, 5 μm.
- B
Representative STED microscopy images of control THP‐1 cells processed for IF analysis with cGAS (green), dsDNA (red), and Lamin B1 (cyan) antibodies. Scale bar, 3 μm. Zoom panels are digital magnifications.
- C
The graph depicts the percentage of cells with micronuclei in control siRNA and IRGM siRNA knockdown THP‐1 cells. Mean ± SD, n = 3 (biological replicates), **P < 0.005, Student's unpaired t‐test.
- D, E
Representative STED microscopy images of Irgm1 −/− mouse BMDMs (D) transfected with mCherry‐cGAS and immunostained with dsDNA (green) antibody. The white line depicts the periphery of the cells. Scale bar, 3 μm. (E) The graph depicts the percentage of cells with micronuclei in Irgm1 +/+ and Irgm1 −/− mouse BMDMs. Mean ± SD, n = 3 (biological replicates), **P < 0.005, Student's unpaired t‐test. Zoom panels are digital magnifications.
- F
The qRT–PCR analysis with cytosolic DNA (minus mitochondria) isolated from Irgm1 +/+ and Irgm1 −/− mouse BMDMs. Mean ± SE, n = 3 mice, ***P < 0.0005, Student's unpaired t‐test.
- G
The qRT–PCR analysis with cytosolic DNA (minus mitochondria) isolated from control and IRGM siRNA transfected HT‐29 cells. Mean ± SE, n = 3 (biological replicates), ***P < 0.0005, Student's unpaired t‐test.
- H
The qRT–PCR analysis with cytosolic DNA (minus mitochondria) isolated from control or IRGM shRNA or EtBr treated IRGM shRNA HT‐29 (Rho0) cells. Mean ± SE, n = 3 (biological replicates), ***P < 0.0005, Student's unpaired t‐test.
- I
The qRT–PCR analysis with total RNA isolated from control or IRGM shRNA or EtBr treated IRGM shRNA HT‐29 (Rho0) cells. Mean ± SD, n = 3 (biological replicates), **P < 0.005, ***P < 0.0005, Student's unpaired t‐test.
- J
The qRT–PCR analysis with cytosolic DNA (minus mitochondria) isolated from Irgm1 +/+ and Irgm1 −/− mouse BMDMs transfected with DNase I (15 μg, 6 h). Mean ± SE, n = 3 mice, ***P < 0.0005, Student's unpaired t‐test.
- K
The qRT–PCR analysis with RNA isolated from control and IRGM siRNA knockdown THP‐1 cells electroporated with DNase I (5 μg, 1 h) as indicated. Mean ± SD, n = 3 (biological replicates), *P < 0.05, **P < 0.005, Student's unpaired t‐test.
- L, M
Representative confocal images of Irgm1 +/+ and Irgm1 −/− mouse BMDMs processed for IF analysis with (L) dsRNA (green) and Tom20 (red) antibodies. (M) The graph depicts the percentage of Irgm1 +/+ and Irgm1 −/− mouse BMDMs with dsRNA aggregates. Mean ± SD, n = 3 (biological replicates), ***P < 0.0005, Student's unpaired t‐test. Scale bar, 5 μm.
- N
Representative confocal images of Irgm1 −/− mouse BMDMs processed for IF analysis with RIG‐I (red) and dsRNA (green) antibodies. Line profile: Co‐localization analysis using line intensity profiles. Scale bar, 5 μm. Zoom panels are digital magnifications.
- O, P
Representative confocal images of Irgm1 −/− mouse BMDMs processed for IF analysis with (O) Mda5 (red) and dsRNA (green) antibodies (Scale bar, 5 μm) or (P) Mda5 (red), dsRNA (green) and Tia1 (blue) antibodies (Scale bar, 3 μm). Line profile: Co‐localization analysis using line intensity profiles. Zoom panels are digital magnifications.
- A
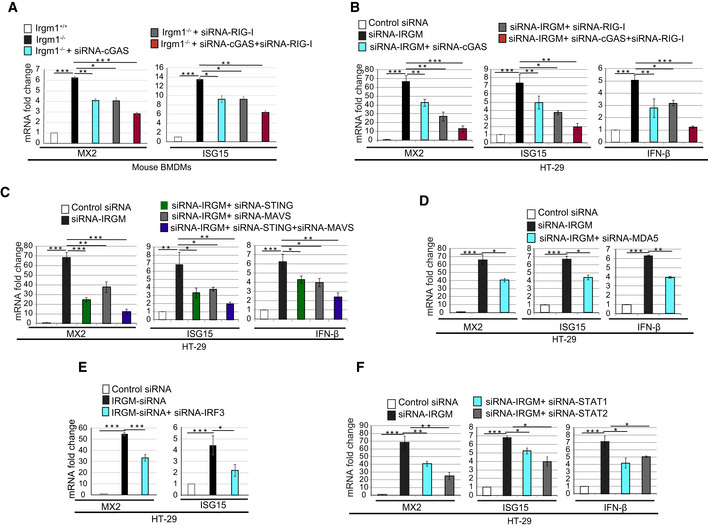
qRT–PCR analysis with total RNA isolated from Irgm1 +/+ and Irgm1 −/− mouse BMDMs transfected with control siRNA or cGAS siRNA or RIG‐I siRNA or cGAS siRNA and RIG‐I siRNA as indicated. Mean ± SD, n = 3 (biological replicates), *P < 0.05, **P < 0.005, ***P < 0.0005, Student's unpaired t‐test.
- B
qRT–PCR analysis with total RNA isolated from HT‐29 cells transfected with control siRNA or IRGM siRNA or doubly transfected with IRGM siRNA and cGAS siRNA or IRGM siRNA and RIG‐I siRNA or transfected with three siRNAs as indicated. Mean ± SD, n = 3 (biological replicates), *P < 0.05, **P < 0.005, ***P < 0.0005, Student's unpaired t‐test.
- C
qRT–PCR analysis with total RNA isolated from HT‐29 cells transfected with control siRNA or IRGM siRNA or doubly transfected with IRGM siRNA and STING siRNA or IRGM siRNA and MAVS siRNA or transfected with all the three siRNAs as indicated. Mean ± SD, n = 3 (biological replicates), *P < 0.05, **P < 0.005, ***P < 0.0005, Student's unpaired t‐test.
- D
qRT–PCR analysis with total RNA isolated from HT‐29 cells transfected with control siRNA or IRGM siRNA or doubly transfected with IRGM siRNA and MDA5 siRNA as indicated. Mean ± SD, n = 3 (biological replicates), *P < 0.05, **P < 0.005, ***P < 0.0005, Student's unpaired t‐test.
- E
qRT–PCR analysis with total RNA isolated from HT‐29 cells transfected with control siRNA or IRGM siRNA or doubly transfected with IRGM siRNA and IRF3 siRNA as indicated. Mean ± SD, n = 3 (biological replicates), *P < 0.05, ***P < 0.0005, Student's unpaired t‐test.
- F
qRT–PCR analysis with total RNA isolated from HT‐29 cells transfected with control siRNA or IRGM siRNA or doubly transfected with IRGM siRNA and STAT1 siRNA or IRGM siRNA and STAT2 siRNA as indicated. Mean ± SD, n = 3 (biological replicates), *P < 0.05, **P < 0.005, ***P < 0.0005, Student's unpaired t‐test.
- A
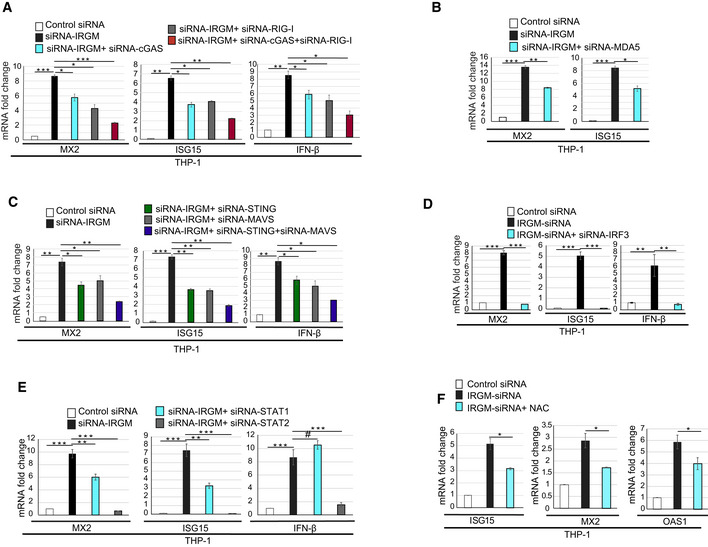
qRT–PCR analysis with total RNA isolated from THP‐1 cells transfected with control siRNA or IRGM siRNA or doubly transfected with IRGM siRNA and cGAS siRNA or IRGM siRNA and RIG‐I siRNA or transfected with three siRNAs as indicated. Mean ± SD, n = 3 (biological replicates), *P < 0.05, **P < 0.005, ***P < 0.0005, Student's unpaired t‐test
- B
qRT–PCR analysis with total RNA isolated from THP‐1 cells transfected with control siRNA or IRGM siRNA or doubly transfected with IRGM siRNA and MDA5 siRNA as indicated. Mean ± SD, n = 3 (biological replicates), *P < 0.05, **P < 0.005, ***P < 0.0005, Student's unpaired t‐test.
- C
qRT–PCR analysis with total RNA isolated from THP‐1 cells transfected with control siRNA or IRGM siRNA or doubly transfected with IRGM siRNA and STING siRNA or IRGM siRNA and MAVS siRNA or transfected with all the three siRNAs as indicated. Mean ± SD, n = 3 (biological replicates), *P < 0.05, **P < 0.005, ***P < 0.0005, Student's unpaired t‐test.
- D
qRT–PCR analysis with total RNA isolated from THP‐1 cells transfected with control siRNA or IRGM siRNA or doubly transfected with IRGM siRNA and IRF3 siRNA as indicated. Mean ± SD, n = 3 (biological replicates), **P < 0.005, ***P < 0.0005, Student's unpaired t‐test.
- E
qRT–PCR analysis with total RNA isolated from THP‐1 cells transfected with control siRNA or IRGM siRNA or doubly transfected with IRGM siRNA and STAT1 siRNA or IRGM siRNA and STAT2 siRNA as indicated. Mean ± SD, n = 3 (biological replicates), **P < 0.005, ***P < 0.0005, # P = non‐significant, Student's unpaired t‐test.
- F
qRT–PCR analysis with RNA isolated for control siRNA or IRGM siRNA transfected THP‐1 cells untreated or treated with N‐acetyl‐
l ‐cysteine (NAC, 1 mM, 2 h). Mean ± SD, n = 3 (biological replicates), *P < 0.05, Student's unpaired t‐test.
References
-
- Ablasser A, Hemmerling I, Schmid‐Burgk JL, Behrendt R, Roers A, Hornung V (2014) TREX1 deficiency triggers cell‐autonomous immunity in a cGAS‐dependent manner. J Immunol 192: 5993–5997 - PubMed
-
- Akira S, Uematsu S, Takeuchi O (2006) Pathogen recognition and innate immunity. Cell 124: 783–801 - PubMed
Publication types
MeSH terms
Substances
Grants and funding
- IA/I/15/2/502071/The Wellcome Trust DBT India Alliance (India Alliance)/International
- BT/HRD/35/02/2006/Department of Biotechnology, Ministry of Science and Technology (DBT)/International
- #262652/Norewegian Research Council/International
- WT_/Wellcome Trust/United Kingdom
- #276070/Norewegian Research Council/International
LinkOut - more resources
Full Text Sources
Medical
Molecular Biology Databases
Research Materials
Miscellaneous
