

A Parkinson's disease CircRNAs Resource reveals a link between circSLC8A1 and oxidative stress
- PMID: 32715657
- PMCID: PMC7507321
- DOI: 10.15252/emmm.201911942
A Parkinson's disease CircRNAs Resource reveals a link between circSLC8A1 and oxidative stress
Erratum in
-
A Parkinson's disease CircRNAs Resource reveals a link between circSLC8A1 and oxidative stress.EMBO Mol Med. 2020 Nov 6;12(11):e13551. doi: 10.15252/emmm.202013551. EMBO Mol Med. 2020. PMID: 33438831 Free PMC article.
Abstract
Circular RNAs (circRNAs) are brain-abundant RNAs of mostly unknown functions. To seek their roles in Parkinson's disease (PD), we generated an RNA sequencing resource of several brain region tissues from dozens of PD and control donors. In the healthy substantia nigra (SN), circRNAs accumulate in an age-dependent manner, but in the PD SN this correlation is lost and the total number of circRNAs reduced. In contrast, the levels of circRNAs are increased in the other studied brain regions of PD patients. We also found circSLC8A1 to increase in the SN of PD individuals. CircSLC8A1 carries 7 binding sites for miR-128 and is strongly bound to the microRNA effector protein Ago2. Indeed, RNA targets of miR-128 are also increased in PD individuals, suggesting that circSLC8A1 regulates miR-128 function and/or activity. CircSLC8A1 levels also increased in cultured cells exposed to the oxidative stress-inducing agent paraquat but were decreased in cells treated with the neuroprotective antioxidant regulator drug Simvastatin. Together, our work links circSLC8A1 to oxidative stress-related Parkinsonism and suggests further exploration of its molecular function in PD.
Keywords: AGO2; CircRNA; CircSLC8A1; Parkinson's disease; RNA sequencing.
© 2020 The Authors. Published under the terms of the CC BY 4.0 license.
Conflict of interest statement
The authors declare that they have no conflict of interest.
Figures
- A
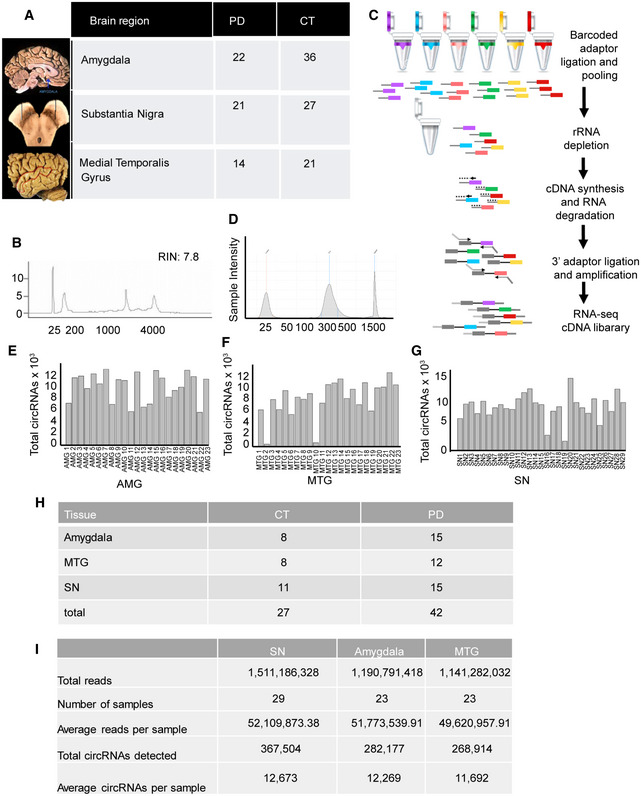
Brain region origin of tissues retrieved from the NBB detailing each brain area.
- B
Average RIN plot of RNA prepared from the frozen tissues.
- C
Library preparation key steps (see details in Materials and Methods).
- D
Library plot in a TapeStation run.
- E–G
Number of circRNAs detected in each sample of all 3 regions. Samples with < 5,000 circRNAs were removed from the analysis.
- H
Number of samples from PD and control from each tissue that were included in the analysis.
- I
Number of total reads and circRNAs from each tissue.
- A
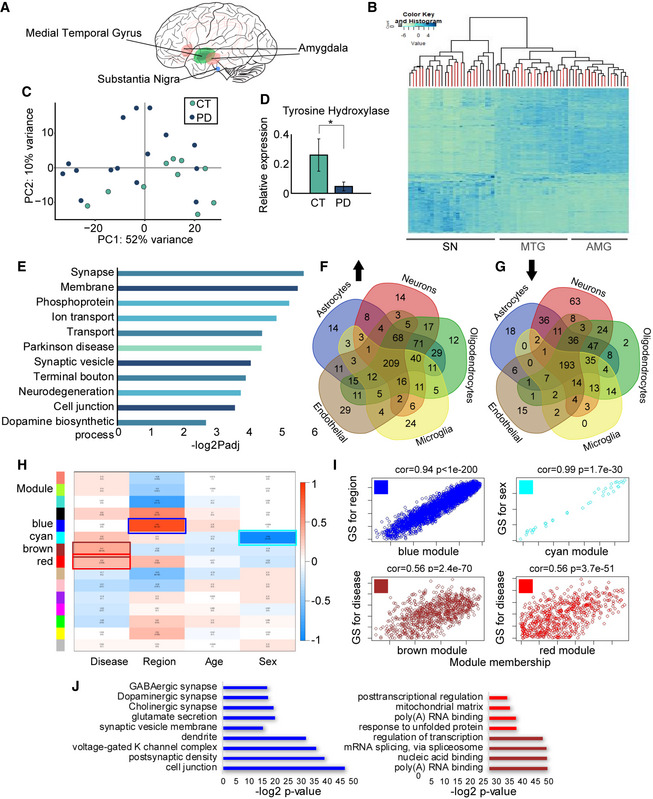
Brain region origin of tissues: SN (blue), MTG (green), and AMG (red).
- B
Non‐supervised clustering heatmap plot indicates substantial clustering of transcripts from each tissue but not of transcripts from patients compared to controls. PD samples indicated in red.
- C
PCA clustering of all RNA molecules in the SN control (green) and PD samples (blue).
- D
qPCR validation of TH levels in SN samples of PD and controls, normalized to beta‐actin mRNA. t‐test *P = 0.025. Data presented as mean ± SD. n = 18 for CT and 24 for PD.
- E
Top enriched GO pathways of DE genes in the SN of PD vs controls and the corresponding logP values, Wald test (DEseq2 analysis).
- F, G
Venn diagrams demonstrating cell type‐specific DE genes in the SN of PD vs control tissues, up/down arrows indicate gene groups that were up/down regulated.
- H
Module–trait relationship of WGCNA analysis showing correlation and corrected P values (in brackets) for each gene module (indicated by colors) as related to the different external traits selected (disease condition, brain region, age, and sex). Correlation test p value calculated by WGCNA package.
- I
Module membership vs. gene significance in selected modules as reflecting external sample traits: disease condition (reflected in the brown and red modules), brain region (the blue module), and sex (the cyan module), regression‐based p value calculated by WGCNA analysis. n = 8 for amygdala control, 15 for amygdala PD, 8 for MTG control, and 13 for MTG PD, 10 for SN control and 15 for SN PD.
- J
Significant GO terms that emerged as associated with the blue, red, and brown modules and the corresponding log P values, Fisher's exact P value.

- A
PCA of all mRNA samples from all tissues.
- B
Substantia nigra sample heatmap, relative expression of each gene is represented by colors, marked by the color key: Reduction in expression is represented by light green and elevation is represented by blue.
- C, D
PCA plot of control vs PD samples in the amygdala and MTG.
- E
Sample dendrogram showing sample clustering and the different classification patterns of external traits for each sample.
- F
Cluster dendrogram of all genes.
- G, H
log2 fold change and −log P value of known DE splicing factors in PD SN vs control SN. n = 10 for SN control and 15 for SN PD. Data presented as mean ± SD, Walt test (DEseq2 analysis).
- A
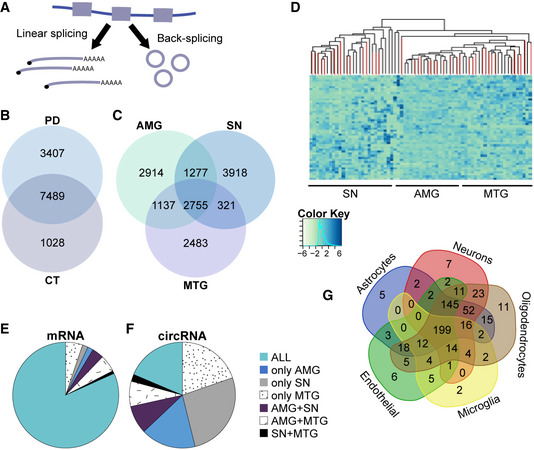
mRNA processing either involves unidirectional splicing, creating linear mRNA transcripts, or back‐splicing generating circRNAs.
- B, C
Venn diagram (not to scale) showing brain region‐ and disease‐characteristic circRNA abundance patterns in analyzed brain regions and disease state.
- D
Heatmap of circRNA abundance, indicating significant tissue‐based SN clustering, PD samples indicated in red.
- E, F
Pie chart demonstrating brain‐specific expression of mRNAs (E) in comparison to circRNAs (F).
- G
Venn diagram demonstrating predicted cell‐type characteristics of circRNA host genes in the SN.
- A–D
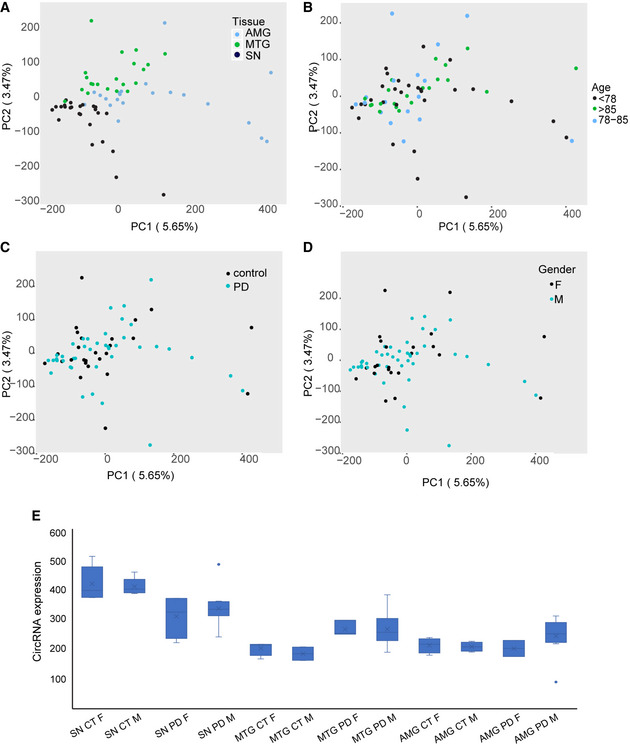
PCA analysis of circRNA profiles in samples according to specific tissues, age, condition, and gender.
- E
CircRNA abundance does not change in a gender‐specific manner in the tested tissues. n = 23 for females and 46 for males. The box is drawn from Q1 to Q3 with a horizontal line drawn in the middle to denote the median and x marks the average. Whiskers mark minimum or maximum values.

- A
Total circRNAs detected in the SN, MTG, and AMG of both PD and control donors, *P = 0.02 *P = 0.026 and *P = 0.022 for comparison between PD and CT in SN, MTG,and AMG. t‐test for total SN vs MTG *P = 2.27E‐8 and SN vs AMG *P = 5.86E‐10. n = 8 for amygdala control, 15 for amygdala PD, 8 for MTG control and 13 for MTG PD, 10 for SN control and 15 for SN PD. The box is drawn from Q1 to Q3 with a horizontal line drawn in the middle to denote the median and x marks the average. Whiskers mark minimum or maximum values. P value was calculated by t‐test.
- B
Global editing levels in the 3 brain regions are based on the Alu editing index, representing the weighted average editing level across all expressed Alu sequences, Wilcoxon, corrected *P = 0.038, 0.055 and 0.42 for amygdala, MTG and SN. Wilcoxon test between the Alu editing index of control and PD samples.
- C
Global RNA editing levels based on the Alu editing index, studied only in Alu elements within circRNA exons and their flanking introns, in the 3 brain regions, for circRNAs corrected *P = 0.025 and 0.040 for the AMG and MTG and P = 0.3 for SN. For flanking introns, *P = 0.02 and 0.040 for AMG and MTG and P = 0.34 for SN, Wilcoxon test. n = 8 for amygdala control, 15 for amygdala PD, 8 for MTG control and 13 for MTG PD, 10 for SN control and 15 for SN PD. The box is drawn from Q1 to Q3 with a horizontal line drawn in the middle to denote the median and x marks the average. Whiskers mark minimum or maximum values.
- D
Negative correlation between total RNA editing and circRNA abundance, correlation = −0.37, correlation test p value = 0.0015.
- E
Adar1 expression levels in all tissues. The box is drawn from Q1 to Q3 with a horizontal line drawn in the middle to denote the median and x marks the average. Whiskers mark minimum or maximum values.
- F, G
Correlations between circRNAs detected in each sample and the age of the control (green, correlation = 0.68, P = 0.032) and PD donors (blue, correlation = −0.14, P = 0.62).
- H
Volcano plot of DE circRNAs in PD vs control tissues, red dots indicate statistically significant DE circRNAs according to FDR correction of Wald test (DEseq2 analysis). CircSLC8A1 is marked is red.
- A
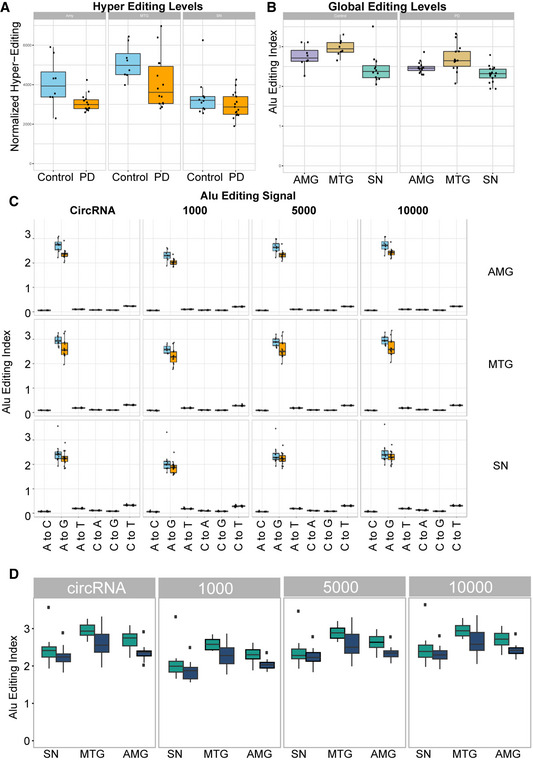
Hyper‐editing levels in all 3 tissues, PD, and controls, n = 8 for amygdala control, 15 for amygdala PD, 8 for MTG control and 13 for MTG PD, 10 for SN control and 15 for SN PD. The box is drawn from Q1 to Q3 with a horizontal line drawn in the middle to denote the median and x marks the average. Whiskers mark minimum or maximum values.
- B
Global editing levels measured by Alu editing index comparing the three different tissues in PD or control, n = 8 for amygdala control, 15 for amygdala PD, 8 for MTG control and 13 for MTG PD, 10 for SN control and 15 for SN PD. The box is drawn from Q1 to Q3 with a horizontal line drawn in the middle to denote the median and x marks the average. Whiskers mark minimum or maximum values.
- C
Alu editing index showing that A‐to-G mismatch is the most dominant, as other mismatches are a result of noise or other biological mechanisms and should be much lower than the A‐to-I (viewed as A‐to-G) RNA editing signal, n = 8 for amygdala control, 15 for amygdala PD, 8 for MTG control and 13 for MTG PD, 10 for SN control and 15 for SN PD. The box is drawn from Q1 to Q3 with a horizontal line drawn in the middle to denote the median and x marks the average. Whiskers mark minimum or maximum values.
- D
Alu editing index in circRNAs and flanking introns, in 3 different intron windows: 1,000, 5,000, and 10,000 nucleotides, n = 8 for amygdala control, 15 for amygdala PD, 8 for MTG control and 13 for MTG PD, 10 for SN control and 15 for SN PD. The box is drawn from Q1 to Q3 with a horizontal line drawn in the middle to denote the median and x marks the average. Whiskers mark minimum or maximum values.
- A
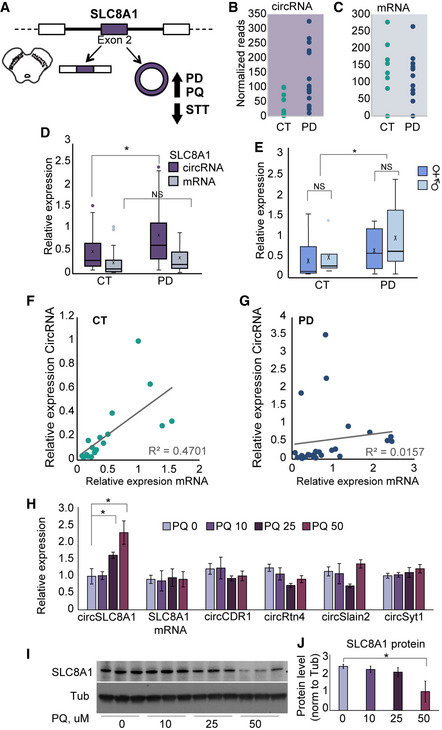
Graphic representation of circSLC8A1 and its post‐transcriptional regulation in PD and under PQ exposure.
- B, C
CircSLC8A1 and linear SLC8A1 levels in the SN of control and PD brains, t‐test P = 0.025, P = 0.118, respectively.
- D
qPCR validations of circSLC8A1 and SLC8A1 mRNA changes in the SN, t‐test *P = 0.025. n = 18 for CT and 24 for PD, x defines mean values.
- E
No difference in circSLC8A1 levels in females and males, t‐test P = 0.583 for control and P = 0.262 for PD. n = 15 females and 16 males.. The box is drawn from Q1 to Q3 with a horizontal line drawn in the middle to denote the median and x marks the average. Whiskers mark minimum or maximum values.
- F, G
CircSLC8A1 and linear SLC8A1 mRNA levels are correlated in control, R 2 = 0.47 t‐test P = 0.0017 but not in PD samples, R 2 = 0.016, P > 0.05. n = 18 for CT and 23 for PD. Data presented as mean ± SD. Note that y‐axis scales are different to allow better visualization.
- H
Increased CircSLC8A1 RNA levels in PQ‐exposed SH‐SY cells (normalized to Tubb3 and RPL19) while other circRNAs remain unchanged, t‐test *P = 0.028 and *P = 0.0215 for 25 μM and 50 μM, respectively. n = 4 biological replicas for each condition. Data presented as mean ± SD.
- I, J
Immunoblot decline (Western blot and quantification) of the SLC8A1 protein in PQ‐exposed SH‐SY cells, with Tubulin as a loading control, t‐test *P = 0.015. n = 3 biological replicas for each condition. Data presented as mean ± SD.
- A
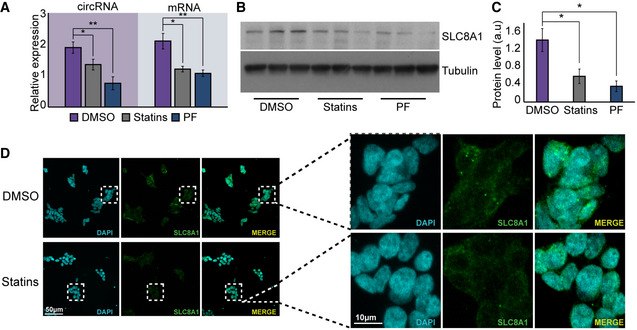
qPCR measurements of circSLC8A1 and SLC8A1 mRNA after SH‐SY treatment of statins or the PF LRRK2 inhibitor, t‐test **P = 0.007 and **P = 0.01 for PF‐06447475 and *P = 0.047 and *P = 0.0136 for statins for cirSLC8A1 and SLC8A1 mRNA, respectively, n = 3 biological replicas for each condition. Data presented as mean ± SD.
- B, C
Protein gel and quantification of SLC8A1 and Tubulin as a loading control in statin and PF‐treated neuronal cell cultures, t‐test *P = 0.027 for statins and *P = 0.011 for PF‐06447475, n = 3 biological replicas for each condition. Data presented as mean ± SD.
- D
SLC8A1 immunostaining of statin‐treated SH‐SY cells.
- A
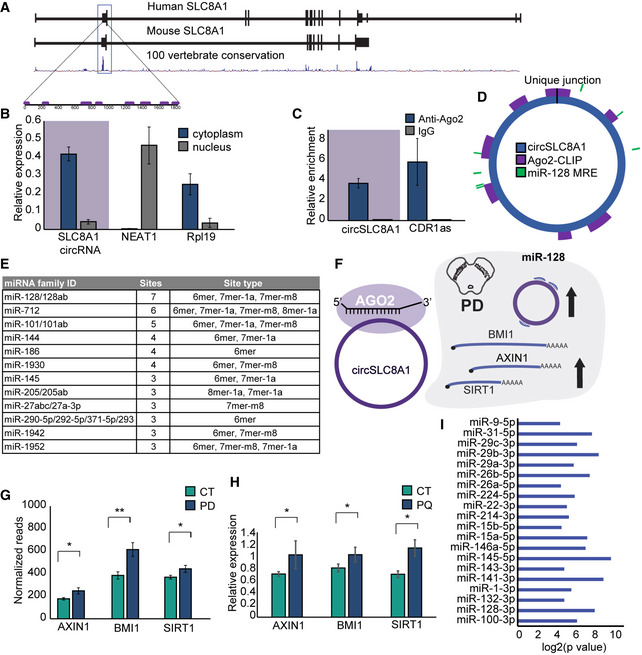
Gene structure and conservation of the human and murine SLC8A1 gene. The box marks the second exon that circularizes to create circSLC8A1.
- B
qPCR quantification from nuclear/cytoplasmic fractionations of SH‐SY cells, t‐test P = 0.005 for circSLC8A1, P = 0.009 for NEAT1 and P = 0.009 for Rpl19. n = 3 biological replicas for each condition. Data presented as mean ± SD.
- C
qPCR quantification of Ago2‐bound RNA, immunoprecipitated (IP)/input values normalized to negative control for a known Ago2 target, circCDR1as, and circSLC8A1, t‐test P = 0.029 for circSLC8A1 and P = 0.001 for circCDR1as, n = 3 biological replicas for each condition. Data presented as mean ± SD.
- D
Schematic representation of circSLC8A1 with Ago2‐binding sites from CLIP‐seq and predicted miRNA binding sites.
- E
miRNAs predicted to bind circSLC8A1 with 3 sites and more.
- F
Schematic representation of circSLC8A1‐Ago2 complex binding and its effect on miR‐128 targets.
- G
Relative expression of known miR‐128 targets from SN RNA‐seq, **P = 0.0004 for BMI1, *P = 0.011 for SIRT1 and *P = 0.005 for AXIN1.
- H
Relative expression of known miR‐128 targets in SH‐SY cells treated with Paraquat, t‐test *P = 0.03, *P = 0.02 and *P = 0.002 for AXIN1, BM1 and SIRT1, respectively. Data presented as mean ± SD with 4–6 biological replicas for each condition.
- I
miR enrichment analysis of DE genes in SN from validated miR‐targets.

- A
circSLC8A1 expression after siRNA treatment (t‐test *P = 0.0075), n = 3 biological replicas for each condition. Data presented as mean ± SD.
- B
siRNA targeting circSLC8A1 does not affect SLC8A1 mRNA expression after siRNA treatment (t‐test P > 0.05). n = 6 for each condition. Data presented as mean ± SD.
- C
Volcano plot of gene expression profile of siCircSLC8A1 compared to siControl, blue dots indicate corrected P < 0.05, FDR correction of Wald test (DEseq2 analysis).
- D
Enriched Go terms of DE genes in siCircSLC8A1 compared to siControl analysis, FDR correction Wald test (DEseq2 analysis).
References
-
- Akhter R (2018) Circular RNA and Alzheimer's disease. Adv Exp Med Biol 1087: 239–243 - PubMed
-
- Aktas T, Avsar Ilik I, Maticzka D, Bhardwaj V, Pessoa Rodrigues C, Mittler G, Manke T, Backofen R, Akhtar A (2017) DHX9 suppresses RNA processing defects originating from the Alu invasion of the human genome. Nature 544: 115–119 - PubMed
-
- Ashwal‐Fluss R, Meyer M, Pamudurti NR, Ivanov A, Bartok O, Hanan M, Evantal N, Memczak S, Rajewsky N, Kadener S (2014) circRNA biogenesis competes with pre‐mRNA splicing. Mol Cell 56: 55–66 - PubMed
Publication types
MeSH terms
Substances
Associated data
- Actions
Grants and funding
- 53140/Israeli Ministry of Science, Technology and Space/International
- MJFF11183/Michael J. Fox Foundation for Parkinson's Research (MJFF)/International
- R01 AG057700/AG/NIA NIH HHS/United States
- Edmond and Lily Safra Center of Brain Sciences (ELSC)/International
- The Netherlands Brain Bank (NBB)/International
LinkOut - more resources
Full Text Sources
Medical
Molecular Biology Databases
