. 2020 Jul 27:9:e52483.
doi: 10.7554/eLife.52483.

Dissecting transcriptional amplification by MYC

Affiliations

Dissecting transcriptional amplification by MYC

Zuqin Nie et al. Elife. .

Abstract

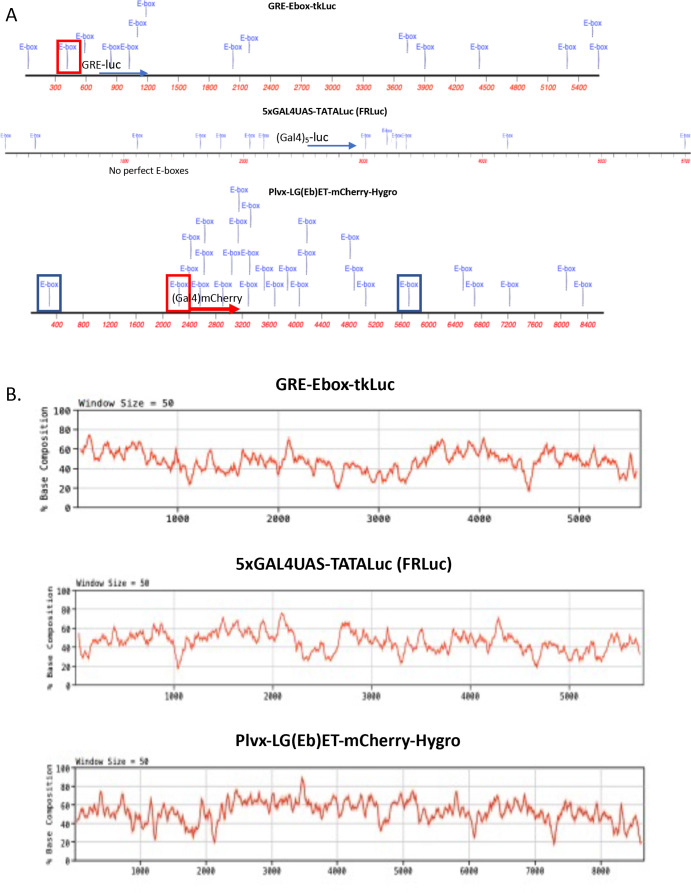
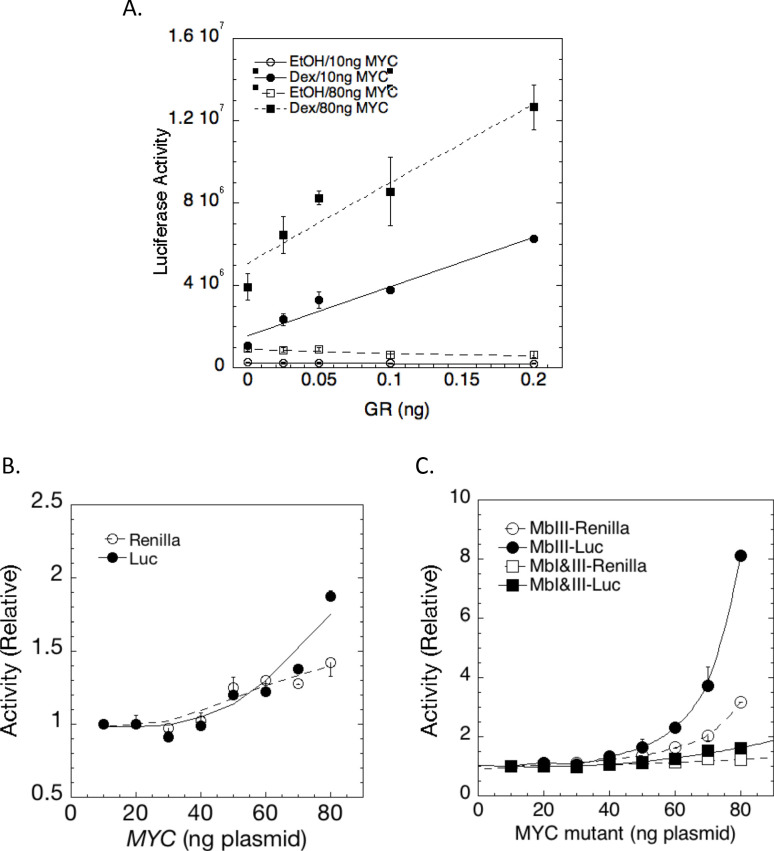
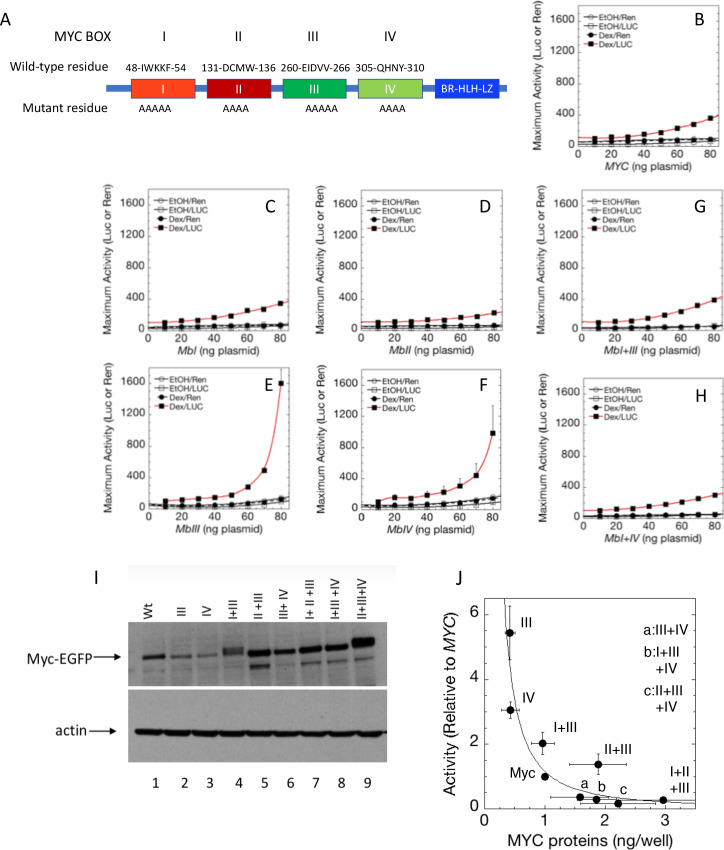
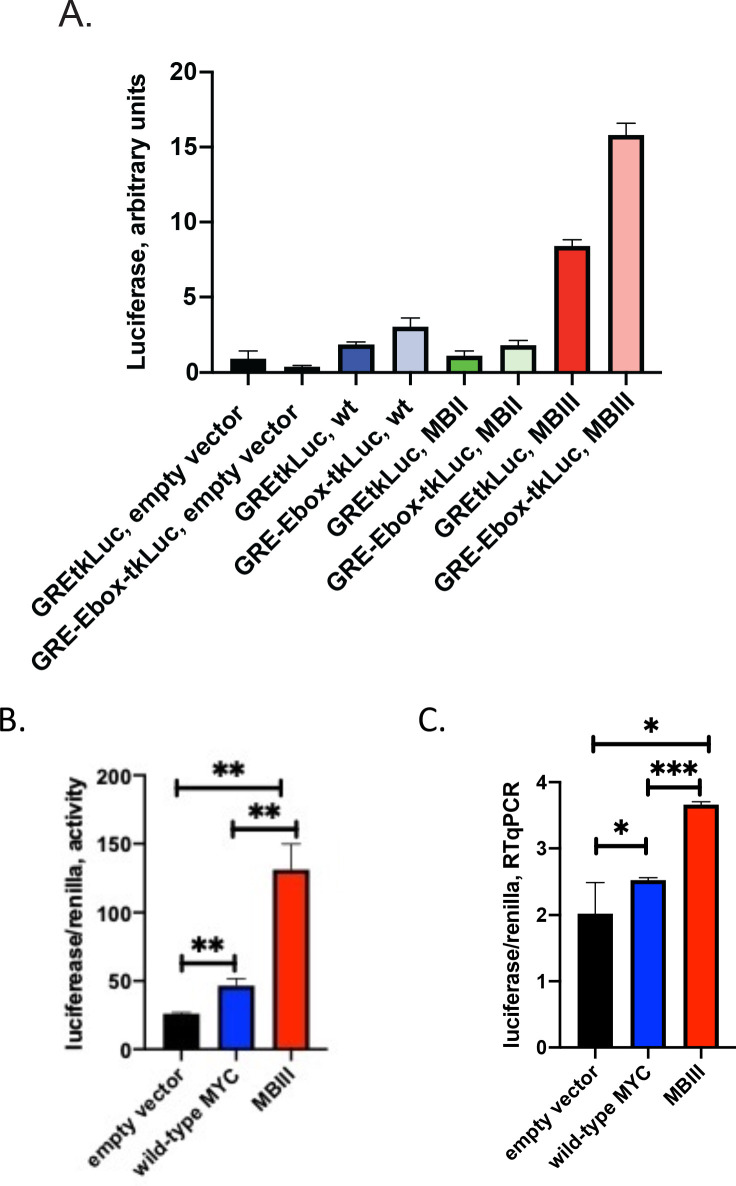
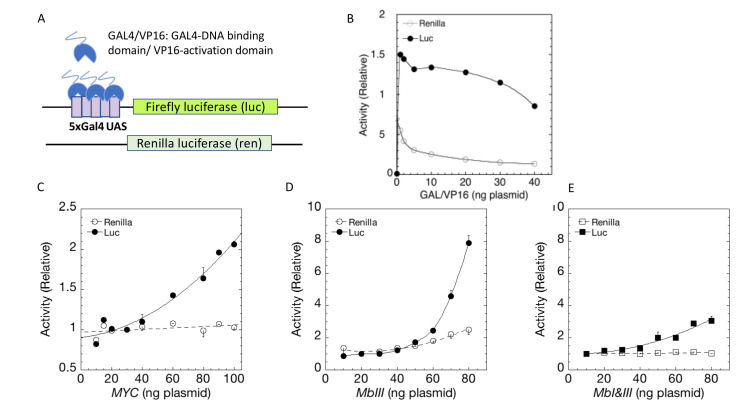
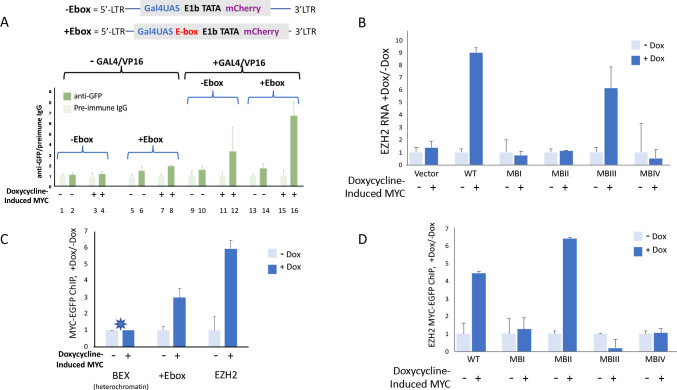
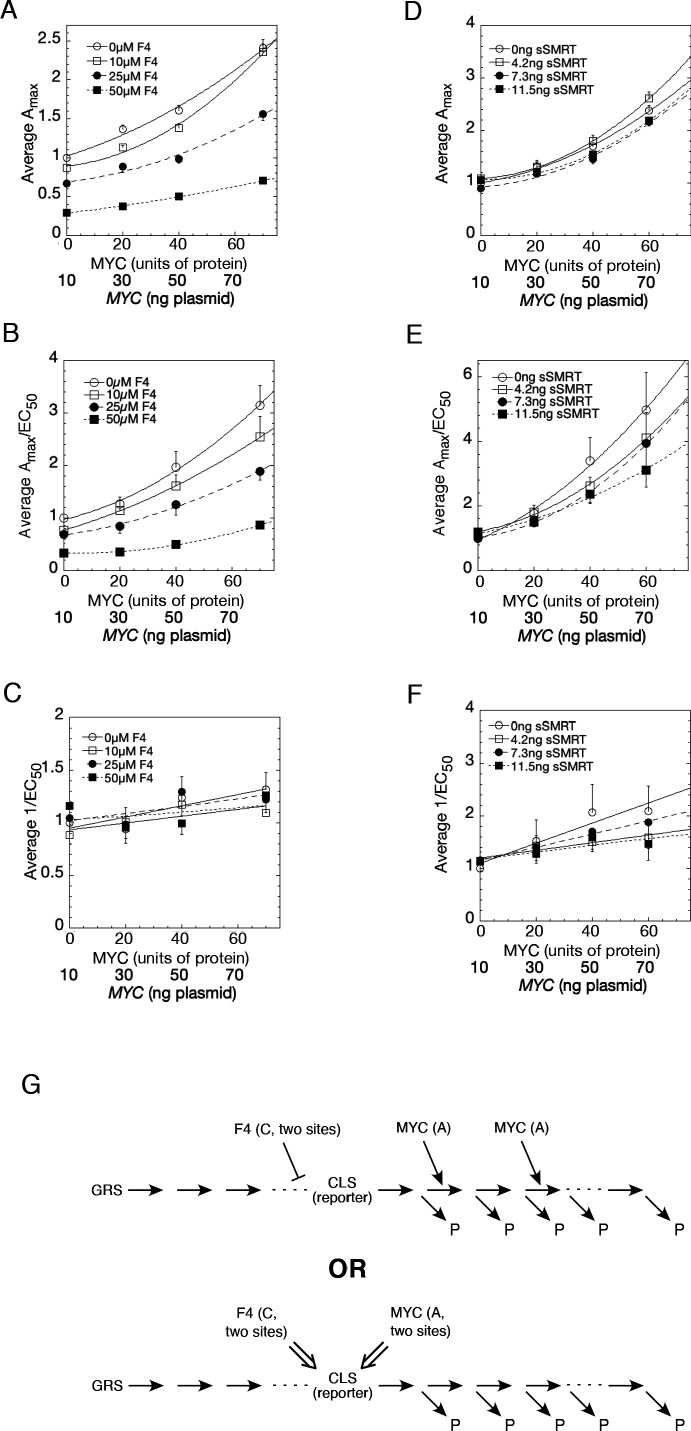
Supraphysiological MYC levels are oncogenic. Originally considered a typical transcription factor recruited to E-boxes (CACGTG), another theory posits MYC a global amplifier increasing output at all active promoters. Both models rest on large-scale genome-wide "-omics'. Because the assumptions, statistical parameter and model choice dictates the '-omic' results, whether MYC is a general or specific transcription factor remains controversial. Therefore, an orthogonal series of experiments interrogated MYC's effect on the expression of synthetic reporters. Dose-dependently, MYC increased output at minimal promoters with or without an E-box. Driving minimal promoters with exogenous (glucocorticoid receptor) or synthetic transcription factors made expression more MYC-responsive, effectively increasing MYC-amplifier gain. Mutations of conserved MYC-Box regions I and II impaired amplification, whereas MYC-box III mutations delivered higher reporter output indicating that MBIII limits over-amplification. Kinetic theory and experiments indicate that MYC activates at least two steps in the transcription-cycle to explain the non-linear amplification of transcription that is essential for global, supraphysiological transcription in cancer.

Keywords: MYC; cancer; cancer biology; computational biology; general amplifier; human; kinetic mechanism of action; michaelis-menten kinetics; systems biology; transcription.


Conflict of interest statement

ZN, CG, SD, CC, EB, SS, DL No competing interests declared

Figures

Figure 1.
Figure 1.. MYC amplifies glucocorticoid receptor-primed gene expression.
(A) Cells were transfected with plasmids (top to bottom) expressing MYC-EGFP driven by the CMV-enhancer promoter, firefly luciferase (luc) driven by a glucocorticoid response element (GRE) from a Herpes thymidine kinase (TK) minimal promoter, and renilla luciferase (ren) driven by the basal thromboxane synthase promoter. (B) MYC-EGFP protein expression parallels the transfected amount of MYC-EGFP plasmid. Note that the linear fit of immunoreactive MYC vs. transfected plasmid indicates that negligible MYC is expressed below 13 ng of plasmid. The endogenous MYC is calculated to equal ≈2.5 ng of MYC plasmid. Therefore, zero total MYC is calculated (Chow and Simons, 2018) to be ≈10 ng of plasmid (=13–2.5). Top: Immunoblot of cells transfected with different amounts of MYC-EGFP plasmid. (C and D). Total Renilla or Luciferase activity with EtOH or high Dex concentrations (50 or 100 nM) in U2OS cells transiently transfected with 2 ng of GR plasmid, 100 ng GREtkLUC reporter, and the indicated amounts of MYC plasmid, without (C) or with (D) 50 µM F4 were determined as described in Materials and methods, averaged, and plotted ± SEM (n = 2 or 4). R2 values for polynomial curve fits were all ≥0.96. Note that GR-induction using endogenous MYC is sensitive to F4 (red brackets on Y-axes of C and D).
Figure 1—figure supplement 1.
Figure 1—figure supplement 1.. MYC acutely increases cellular RNA levels.
Comparison of RNA/cell in HO15.19-MYC-ER cells in the presence or absence of 4-OH tamoxifen (200 nM). The cells were grown in 0.1% of serum starvation for 5 days and then stimulated or not with 4-OH-tamoxifen. Error bars show the standard deviation. Comparing + vs. – tamoxifen, p-values for the progressive time points are 0.062, 0.029 and 0.022, respectively. Mean and SD are indicated for triplicates. Experiment performed twice.
Figure 1—figure supplement 2.
Figure 1—figure supplement 2.. E-box-like sequences and base composition of transient and stable reporters.
(A) Disposition of perfect and 5/6-E-boxes within the reporter plasmids used in these studies. Perfect E-boxes are in boxes. Red-boxes enclose perfect E-boxes engineered into reporter promoters. Blue-boxes enclose the perfect E-boxes that occur within the LTR of the lentivirus vectors. Blue text indicates all sequences that match CACGTG at 5/6 bases. In 50% G-C, a 5/6 match is expected to occur randomly once every 228 bases. (B) G-C content of the reporter plasmids, sliding 50 bp window. Gal4UASs or GREs are just upstream of reporters as indicated.
Figure 1—figure supplement 3.
Figure 1—figure supplement 3.. MYC amplification of steroid receptor activity.
(A) Effect of MYC is greater when genes are more actively expressed. Augmentation by MYC (10 or 80 ng) of maximal LUC induction from transfected GREtkLUC by the indicated amounts of transfected GR with EtOH or Dex (60 or 20 nM) in U2OS cells (Ave ± range, n = 2). (B) MYC augmentation of transactivation by progesterone receptor B (PR-B). In both B and C, the maximal LUC or Renilla induction by 1.5 ng PR-B and 1 nM R5020 from transfected GREtkLUC or Renilla-TS respectively in U2OS cells is augmented by the indicated amounts of transfected (B) MYC and (C) MbIII and MbI+III.The data are normalized to the value for 10 ng of each MYC plasmid, averaged and plotted ±range (n = 2).
Figure 2.
Figure 2.. E-boxes assist but are not essential for MYC amplifier activity.
(A) Dex-inducible reporter plasmids without or with E-boxes (top and middle, respectively) were co-transfected with a basal and uninducible Renilla-expressing reporter (bottom). (B) Without Dex induction, MYC marginally influences reporter expression with or without E-boxes. (C). With Dex, E-boxes depressed and then augmented reporter expression at low and high levels of MYC, respectively. Graphs are averages of 4 paired experiments ± S.E.M. in U2OS cells transiently transfected with 2 ng of GR plasmid, 100 ng GREtkLUC reporter without or with an E-box. All data were normalized to the value for 10 ng MYC with Dex on GREtkLUC reporter before averaging (R2 values for polynomial curve fits are ≥0.98).
Figure 2—figure supplement 1.
Figure 2—figure supplement 1.. MYC operates most effectively when bound within a couple of hundred bases of a transcription start site (Nie et al., 2012).
If the net action of MYC at a gene reflects its overall avidity for the given promoter, then an E-box will augment MYC activity by ~1.5 x, as shown in Figure 2.
Figure 3.
Figure 3.. Cooperation between Myc Boxes (MBs) is required for amplifier activity.
(A) Summary of mutations introduced into the MBs of transfected MYC. B-H. Effect of various mutations in MBs, individually or in combination, on MYC amplifier activity. Total Renilla or Luciferase activity with EtOH or high Dex concentrations (50 or 100 nM) in U2OS cells, transiently transfected with 2 ng of GR plasmid, 100 ng GREtkLUC reporter, and the indicated amounts of MYC plasmid, were determined as described in Materials and methods, normalized to that for 10 ng plasmid, averaged, and plotted ± SEM (n = 2, 3, or 4) for B) wild-type, (C) MBI mutation, (D) MBII mutation, (E) MBIII mutation, (F) MBIV mutation, (G) MBI+III mutation, and H) MBI+IV mutation. R2 values for polynomial fits of Dex/Luc curves were all ≥0.96 except for E and F, which were fit to smooth curves. (I). MYC protein levels (immunoblot) of transfected wild-type (WT) and mutant plasmids. (J) Inverse relationship between MYC protein level and amplifier activity for wild-type and mutant proteins. Data are averages ± S.E.M. from 2 to 5 experiments (n = 9 for wt MYC).
Figure 4.
Figure 4.. MYC-Box mutations change both non-E and E-box promoter-output at the RNA level.
(A and B) Cells were transfected as noted with 80 ng of empty vector, MYC, MBII or MBIII expressing vectors, 100 ng of non-E-box or E-box reporter and 2 ng of GR plasmids . Luciferase and renilla luciferase were assayed. (C). Transfected cells as in B were harvested and RNA extracted for RT-qPCR using Luna Universal One-Step RT-qPCR Kit (New England Biolabs). Experiments were performed in biological triplicate. Standard deviations are indicated. *,** and *** indicate p≤0.05, 0.01, 0.001, respectively, one-tailed t-test. Experiments performed in triplicate (A and B, n = 3; C, n = 1).
Figure 5.
Figure 5.. MYC amplifies synthetic transcription factor GAL4/VP16 output.
(A) Cells were co-transfected with varying amounts of plasmids expressing the GAL4/VP16 chimeric protein that includes the DNA binding domain of GAL4 and the transactivation domain of VP16, as well as Gal4UAS-luc and tsRen. (B) GAL4/VP16 transactivation of Gal4UAS-luc (10 ng) saturates at ≈2 ng of transfected GAL4/VP16. Renilla TS was present at 10 ng. Activity is relative to 10 ng GAL4/VP16. Data points are averages of triplicate determinations ± SD of one experiment. (C) MYC amplifies GAL4/VP16 output. (D) Mutation of MBIII unrestrains the gain of MYC amplification of GAL4/VP16. (E). Unrestrained amplification of GAL4/VP16 activation by MBIII-mutant MYC requires intact MBI. In C-D, total amount of MYC vector was kept constant by addition of decreasing amounts of pd4EGFP plasmid. Data were normalized to that for 30 ng (C), 20 ng (D), or 10 ng (E) of MYC construct plasmid, each with 10 ng each of GAL4/VP16 and of GAL4UAS-luc plasmid, averaged, and plotted ±range (n = 2).
Figure 6.
Figure 6.. MYC amplifies the expression of chromosomally-integrated integrated reporters.
(A) Lentiviruses encoding a fluorescent reporter driven by a TATA-box and a single Gal4UAS (top) or a single Gal4UAS and an E-box (middle) were inserted into cells bearing a doxycycline-inducible MYC-EGFP (bottom). Expression was monitored microscopically in single-cells. (B) Expression without an E-box requires both Gal4/VP16 and induced-MYC-EGFP. (C) E-boxes supplement but are not essential for MYC amplification. (D). MYC-amplification is resilient to single MB mutation. Lentivirus-expressed WT or MB-mutant MYC-EGFP induced by doxycycline were and transfected GAL4/VP16 were used to activate mCherry driven by a GAL4UAS and a single E-box. Error bars along the graphed lines indicate SEM and the shaded areas indicate the SD. (E) Western blot of uninduced and doxycycline-induced WT and MB-mutant MYC-EGFP relative to the endogenous MYC. Representative experiments are shown. For all experiments n ≥ 3.
Figure 7.
Figure 7.. MYC-EGFP binding at chromosomally integrated-reporters parallels activity and emulates native promoters.
Top: diagram of integrated-lentivirus CFP reporters. (A) Left-ChIP-PCR to assay MYC-EGFP binding in the absence of activator of uninduced (lanes 2 and 6) versus doxycycline-induced (lanes 4 and 8) MYC-EGFP, at non-E-box (lanes 2 and 4) versus E-box-bearing (lanes 6 and 8) lentivirus-integrated reporter promoters. Right-ChIP-PCR to assay MYC-EGFP binding in the presence of GAL4/VP16 of uninduced (lanes 10 and 14) versus doxycycline-induced (lanes 12 and 16) MYC-EGFP at non-E-box (lanes 10 and 12) versus E-box bearing (lanes 14 and 16) lentivirus integrated reporter-promoters. (B) EZH2 RNA levels from cells expressing non-induced or doxycycline induced MYC-EGFP(WT) or MYC-EGFP-mutants MBI, MBII, MBIII or MBIV and assayed by RT-qPCR using Luna Universal One-Step RT-qPCR Kit (New England Biolabs). (C) Binding of uninduced and induced MYC-EGFP to endogenous promoters. The asterisk (*) indicates that binding to BEX in heterochromatin was so low as to be virtually unexpressed as previously reported (Nie et al., 2012). (D). Uninduced or doxycycline-induced MYC-EGFP(WT) or MYC-EGFP-mutants (MBI, MBII, MBIII, or MBIV) binding to the native EZH2 promoter assayed by ChIP-PCR. The mean and SD for representative experiments performed in triplicate are shown, n ≥ 2.
Figure 8.
Figure 8.. Competition assays reveal site of MYC action in the transcription-cycle in relation to other factors.
(A – C) Competition of MYC vs 10058-F4. Double reciprocal plots (averaged) showing Amax (A), Amax/EC50 (B), and 1/EC50 (C) of MYC with varying inhibitor 10058-F4 from competition assays (as described in Materials and methods) in U2OS cells with MYC and co-transfected F4, GR, and GREtkLUC. Data from each experiment (n = 4) were normalized to the value for the lowest amounts of MYC and 10058-F4 and the averages (± SEM) were plotted. (D–F) Competition of MYC vs sSMRT. Double reciprocal (averaged) plots of Amax (D), Amax/EC50 (E), and 1/EC50 (F) with varying sSMRT were made for the competition assays, as in A-C, of MYC and decelerator sSMRT along with co-transfected GR and GREtkLUC. Data from each experiment (n = 5) were normalized to the value for the lowest amount of MYC and sSMRT and the averages (± SEM) were plotted. It should be noted that these plots require that the amounts transfected plasmid shown on the X-axis must correspond to the total amount of protein (endogenous plus exogenous) or added chemical. As shown in Figures 1B, 10 ng of MYC cDNA corresponds to zero total MYC protein. Therefore, the X-axis origin corresponds to 0 MYC protein, which equals 10 ng MYC cDNA. The data of the competition experiments of MYC vs 10058-F4 of Fig. 8A-C were expressed as EC50/Amax, averaged, and plotted as averaged ± SEM (n = 4). The R2 for the curve fits are all > 0.99. (G) Cartoon of sites and modes of action of MYC and 10058-F4 (F4). Starting with the Dex-bound GR (GRS), the induction of LUC protein (P) proceeds through numerous, undefined steps (arrows and ". . .”) both before and after the CLS. After the CLS, each step can either proceed to protein or involve another regulatory cofactor before ending in the production of protein. The top panel depicts F4 acting as a competitive decelerator at two steps before or at the CLS while MYC acts as an accelerator at two steps after the CLS. The bottom panel is for MYC acting at two sites as an activator of GRE as it enters the CLS with F4 inhibiting MYC at two sites.
Figure 8—figure supplement 1.
Figure 8—figure supplement 1.. Competition assays reveal site of MYC action in the transcription cycle in relation to other factors.
The data of the competition experiments of MYC vs 10058-F4 of Figure 8A–C were expressed as EC50/Amax, averaged, and plotted as averag ± SEM (n = 4). The R2 for the curve fits are all >0.99.

References

    1. Agrawal P, Yu K, Salomon AR, Sedivy JM. Proteomic profiling of Myc-associated proteins. Cell Cycle. 2010;9:4908–4921. doi: 10.4161/cc.9.24.14199. - DOI - PMC - PubMed
    1. Alon U. An Introduction to Systems Biology : Design Principles of Biological Circuits. Chapman & Hall/CRC; 2007.
    1. Baluapuri A, Hofstetter J, Dudvarski Stankovic N, Endres T, Bhandare P, Vos SM, Adhikari B, Schwarz JD, Narain A, Vogt M, Wang SY, Düster R, Jung LA, Vanselow JT, Wiegering A, Geyer M, Maric HM, Gallant P, Walz S, Schlosser A, Cramer P, Eilers M, Wolf E. MYC recruits SPT5 to RNA polymerase II to promote processive transcription elongation. Molecular Cell. 2019;74:674–687. doi: 10.1016/j.molcel.2019.02.031. - DOI - PMC - PubMed
    1. Barrett JF, Lee LA, Dang CV. Stimulation of myc transactivation by the TATA binding protein in promoter-reporter assays. BMC Biochemistry. 2005;6:7. doi: 10.1186/1471-2091-6-7. - DOI - PMC - PubMed
    1. Blackford JA, Guo C, Zhu R, Dougherty EJ, Chow CC, Simons SS. Identification of location and kinetically defined mechanism of cofactors and reporter genes in the cascade of steroid-regulated transactivation. Journal of Biological Chemistry. 2012;287:40982–40995. doi: 10.1074/jbc.M112.414805. - DOI - PMC - PubMed

Publication types

Substances