. 2020 Jul 27;16(7):e1008964.
doi: 10.1371/journal.pgen.1008964. eCollection 2020 Jul.

The evolution and functional divergence of the histone H2B family in plants

Affiliations

The evolution and functional divergence of the histone H2B family in plants

Danhua Jiang et al. PLoS Genet. .

Abstract

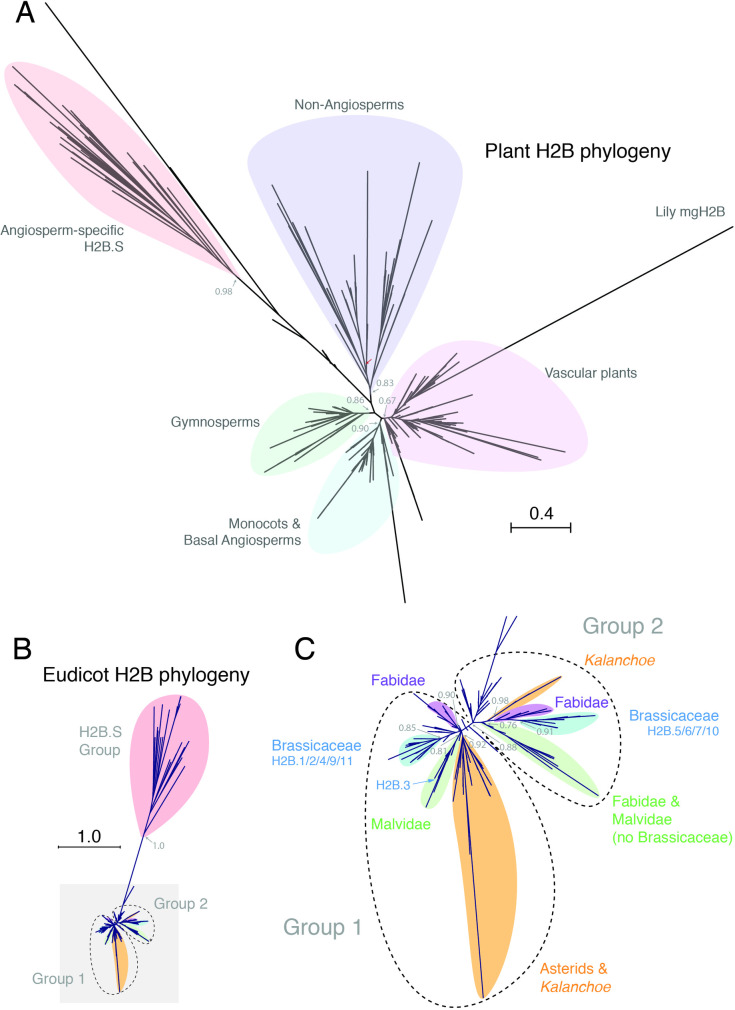
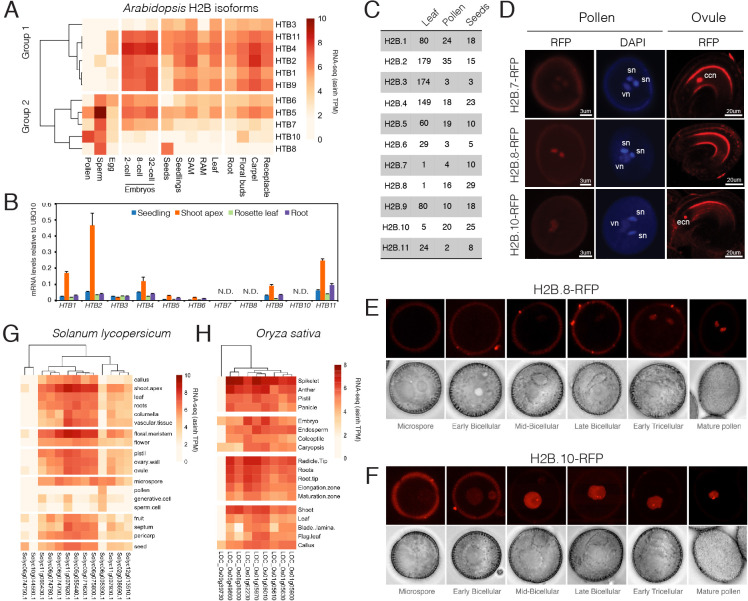
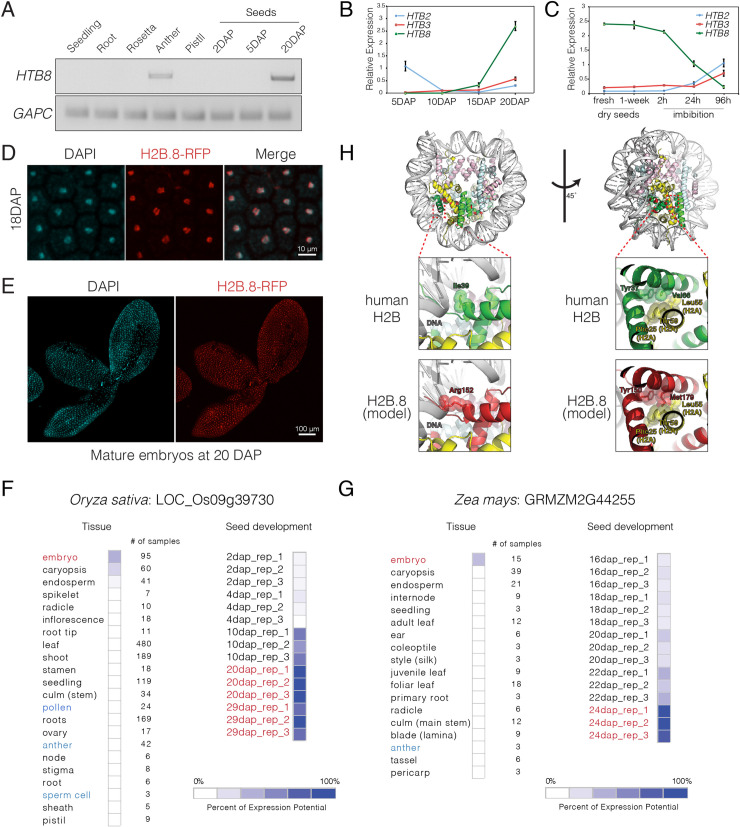
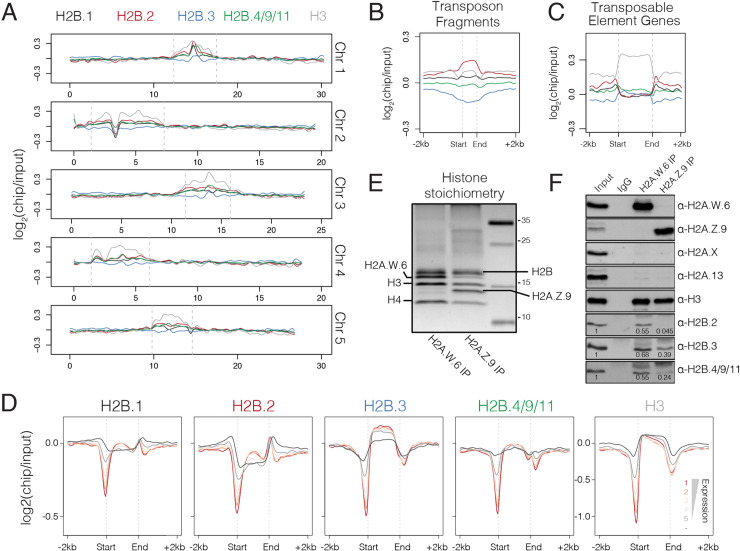
Chromatin regulation of eukaryotic genomes depends on the formation of nucleosome complexes between histone proteins and DNA. Histone variants, which are diversified by sequence or expression pattern, can profoundly alter chromatin properties. While variants in histone H2A and H3 families are well characterized, the extent of diversification of histone H2B proteins is less understood. Here, we report a systematic analysis of the histone H2B family in plants, which have undergone substantial divergence during the evolution of each major group in the plant kingdom. By characterising Arabidopsis H2Bs, we substantiate this diversification and reveal potential functional specialization that parallels the phylogenetic structure of emergent clades in eudicots. In addition, we identify a new class of highly divergent H2B variants, H2B.S, that specifically accumulate during chromatin compaction of dry seed embryos in multiple species of flowering plants. Our findings thus identify unsuspected diverse properties among histone H2B proteins in plants that has manifested into potentially novel groups of histone variants.


Conflict of interest statement

The authors declare that they have no conflict of interest.

Figures

Fig 1
Fig 1. Phylogenetic analysis of the histone H2B family in the plant kingdom.
(A) Maximum likelihood tree of H2Bs across the plant kingdom. Major clades are indicated by differently coloured shading. The non-angiosperm clade includes all sequences from Chlorophytes, Bryophytes, most Monilophytes, Charophytes, Lycophytes and several Gymnosperms. A highly divergent angiosperm-specific clade is also highlighted. Approximate likelihood ratio test values based on a Shimodaira-Hasegawa-like procedure are indicated on nodes to major clades. Scale bar indicates substitutions per site. Major plant groups are indicated with differently coloured shading. Red arrow indicates root as defined by the placement of the outgroup of Chlorophyte algae H2Bs. (B) Maximum likelihood tree of eudicot H2Bs. Three major clades are highlighted. Approximate likelihood ratio test value based on a Shimodaira-Hasegawa-like procedure is indicated on the H2B.S. Scale bar indicates substitutions per site. (C) Close-up view of two major groups of eudicot H2Bs highlighted with grey shading in the maximum likelihood tree shown in B. Family-specific clades are indicated with differently coloured shading. Approximate likelihood ratio test values based on a Shimodaira-Hasegawa-like procedure are indicated on nodes to major clades.
Fig 2
Fig 2. Developmental expression of Arabidopsis H2B-encoding genes.
(A) Heat map showing expression levels of Arabidopsis H2B genes determined by RNA-seq. SAM: shoot apical meristem, RAM: root apical meristem. (B) Expression of Arabidopsis H2B genes measured by qRT-PCR in somatic tissues. Data represents relative expression levels normalized to UBQ10. Error bars represent the standard deviation from three biological replicates. N.D.—not detected. 10-day-old seedlings were used for RNA extraction with at least 20 seedlings per biological replicate. For shoot apex, rosette leaf and root, tissues were dissected from 3-week-old plants, with at least 30 plants used for dissection in each biological replicate. (C) Qualitative mass spectrometry analysis of Arabidopsis H2Bs. Spectral counts of unique peptides for Arabidopsis H2Bs in each sample are indicated. Data for leaves were obtained by immunoprecipitation of H3 after MNase digestion of leaf nuclei. Data for pollen and seeds were obtained from acid extracted histones. See Materials and Methods for details. (D) Expression of H2B.7-RFP, H2B.8-RFP, and H2B.10-RFP in pollen and ovules. DAPI staining is used to indicate two sperm nuclei (sn) and one vegetative nucleus (vn) in pollen, respectively. ccn: central cell nucleus, ecn: egg cell nucleus. (E,F) Expression of H2B.8-RFP (E) and H2B.10-RFP (F) during the different stages of pollen development. (G) Heat map showing expression levels of rice (Solanum lycopersicum) H2B genes in the RNA-seq datasets deposited in Genevestigator. (H) Heat map showing expression levels of rice (Oryza sativa) H2B genes in the RNA-seq datasets deposited in Genevestigator.
Fig 3
Fig 3. Expression analysis of H2B.S histone variants in Arabidopsis, rice and maize.
(A) RT-PCR analysis of HTB8 expression in Arabidopsis tissues. GAPC is served as an endogenous control. DAP: days after pollination. Seedling, root and rosettes were collected as described in Fig 2B. At least 150 mature anthers and 30 mature pistils were used for RNA extraction. Seeds were collected based on the days after pollination, with at least 500 seeds at 2DAP and 5DAP, and 250 seeds at 20DAP used for RNA extraction. (B) Expression of HTB2, HTB3 and HTB8 during seed maturation. Data represents relative expression levels normalized to UBQ10, error bars represent the standard deviation (SD) from three biological replicates. At least 500 seeds at 5DAP and 10DAP, and 250 seeds at 15DAP and 20DAP were used in each biological replicate. (C) Expression of HTB2, HTB3, and HTB8 during seed storage and imbibition. Data represents relative expression levels normalized to UBQ10, error bars represent the SD from three biological replicates. At least 250 seeds at each time point were used in each biological replicate. (D) H2B.8-RFP expression in cotyledon nuclei of developing embryos at 18 DAP. DAPI staining indicates the position of nuclei. (E) H2B.8-RFP expression in a mature embryo alongside a corresponding DAPI stained image. (F-G) Expression of HTB8 relatives in rice (Oryza sativa) and maize (Zea mays) in selected tissues and different stages of seed development, respectively. Data represents microarray transcriptomes deposited in Genevestigator. (H) Modelled structure of an H2B.8-containing nucleosome with a close-up view of the predicted location of highly conserved amino acids in H2B.S orthologs, which are highlighted in red. Yellow indicates histone H2A, green indicates histone H2B, pink indicates histone H3 and blue indicates histone H4. The position of the ten highly conserved H2B.S amino acids within the nucleosome are marked in red.
Fig 4
Fig 4. Genomic distribution of somatic Arabidopsis H2Bs.
(A) Chromosomal distribution of somatic H2Bs alongside histone H3 over each of the five Arabidopsis chromosomes calculated in 100 kb bins. Plotted is the ChIP-seq log2 enrichment relative to input. Pericentromeric regions are indicated by dashed grey lines. (B-C) Distribution of somatic H2Bs and histone H3 over transposon fragments (B) and transposable element genes (C). Plotted is the ChIP-seq log2 enrichment relative to input. (D) Distribution of somatic H2Bs and histone H3 over genes grouped by their level of expression in Arabidopsis seedlings. Each group is colour coded using the scheme shown with non-expressed genes shown in dark grey. (E) Silver stained gel of immunoprecipitated H2A.W.6 and H2A.Z.9 mono-nucleosomes confirms histone stoichiometry. Identities of protein bands are indicated. (F) Western blotting analysis of samples in panel E with indicated antibodies. Enrichment of H2Bs was calculated relative to input and normalized to H3 in each sample.
Fig 5
Fig 5. Arabidopsis H2B.3 is preferentially expressed in non-dividing cells.
(A) Relative expression of Arabidopsis somatic H2Bs in the shoot apex, young leaf and mature leaf, which represent tissue with decreasing mitotic activity from shoot apex to mature leaf. Values represent fold-changes relative to expression in the shoot apex. Error bars represent the standard deviation (SD) from three biological replicates. Leaves and shoot apex were dissected from 4-week-old plants, with at least 30 plants used for dissection of each biological replicate. (B) Expression of H2B-RFP fusion proteins in emerging leaf and primary root tissue. DZ = differentiation zone, MZ = meristematic zone, RC = root cap. (C) Comparison of H2B.2-RFP and H2B.3-RFP expression in the root tip illustrates the absence of H2B.3 from the MZ but presence in non-dividing cells of the RC. (D) Relative expression of Arabidopsis somatic H2Bs in the rbr-2 mutant characterized by increased mitotic activity. Values represent fold-changes relative to expression in wild type Col-0. Error bars represent the SD from three biological replicates. (E) HA-tagged H3.1 and H3.3 were immunopurified and analysed for the presence of H2Bs. Black and white triangles on the H3 blot indicate bands of HA-tagged and endogenous histone H3, respectively. (F) Quantification of H2Bs precipitated with H3.1 and H3.3. Data represents the mean ± standard deviation of three independent experiments normalized to the total H3 signal. Statistical significance was assessed using a one-tailed paired Student’s t-test.

References

    1. Luger K, Mader AW, Richmond RK, Sargent DF, Richmond TJ. Crystal structure of the nucleosome core particle at 2.8 A resolution. Nature. 1997;389(6648):251–60. 10.1038/38444 . - DOI - PubMed
    1. Filipescu D, Muller S, Almouzni G. Histone H3 variants and their chaperones during development and disease: contributing to epigenetic control. Annual review of cell and developmental biology. 2014;30:615–46. 10.1146/annurev-cellbio-100913-013311 . - DOI - PubMed
    1. MacAlpine DM, Almouzni G. Chromatin and DNA replication. Cold Spring Harbor perspectives in biology. 2013;5(8):a010207 10.1101/cshperspect.a010207 - DOI - PMC - PubMed
    1. Venkatesh S, Workman JL. Histone exchange, chromatin structure and the regulation of transcription. Nature reviews Molecular cell biology. 2015;16(3):178–89. 10.1038/nrm3941 . - DOI - PubMed
    1. Talbert PB, Ahmad K, Almouzni G, Ausio J, Berger F, Bhalla PL, et al. A unified phylogeny-based nomenclature for histone variants. Epigenetics & chromatin. 2012;5:7 10.1186/1756-8935-5-7 - DOI - PMC - PubMed

Publication types