. 2021 May 25;117(6):1532-1545.
doi: 10.1093/cvr/cvaa233.

Gene expression profiling of hypertrophic cardiomyocytes identifies new players in pathological remodelling

Affiliations

Gene expression profiling of hypertrophic cardiomyocytes identifies new players in pathological remodelling

Marta Vigil-Garcia et al. Cardiovasc Res. .

Abstract

Aims: Pathological cardiac remodelling is characterized by cardiomyocyte (CM) hypertrophy and fibroblast activation, which can ultimately lead to maladaptive hypertrophy and heart failure (HF). Genome-wide expression analysis on heart tissue has been instrumental for the identification of molecular mechanisms at play. However, these data were based on signals derived from all cardiac cell types. Here, we aimed for a more detailed view on molecular changes driving maladaptive CM hypertrophy to aid in the development of therapies to reverse pathological remodelling.

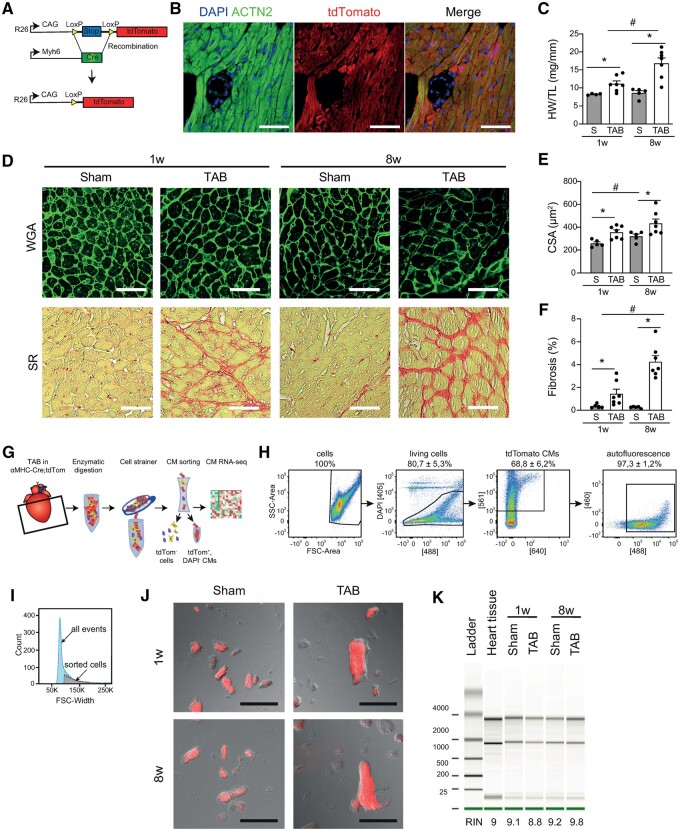
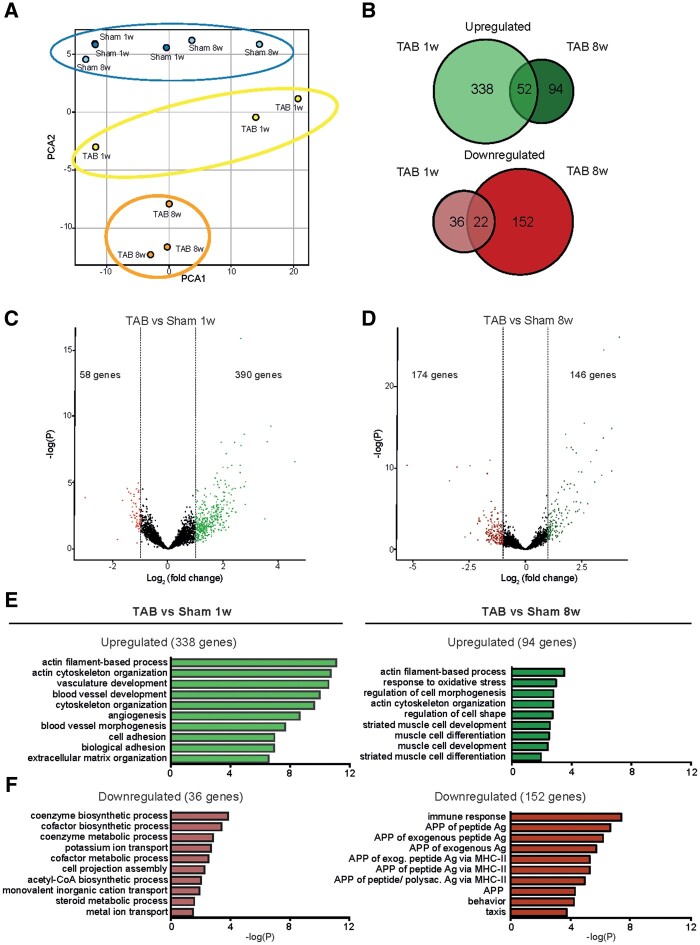
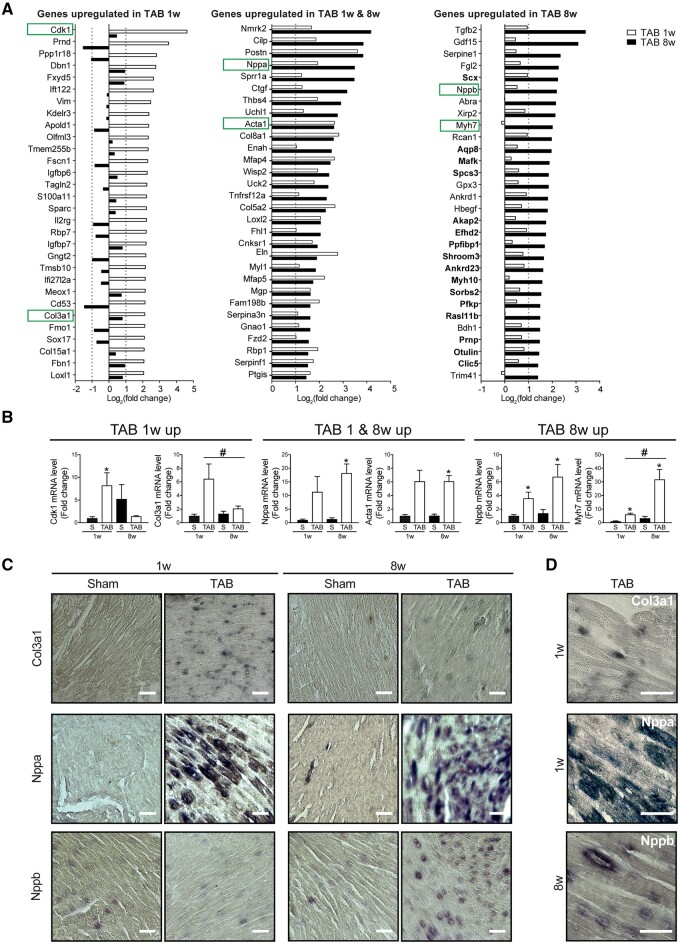
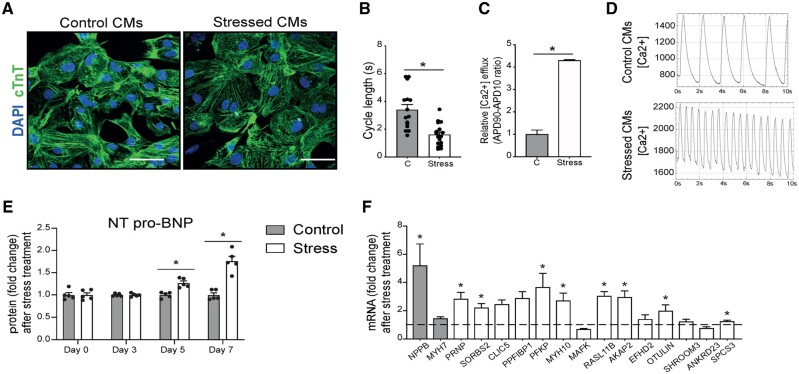
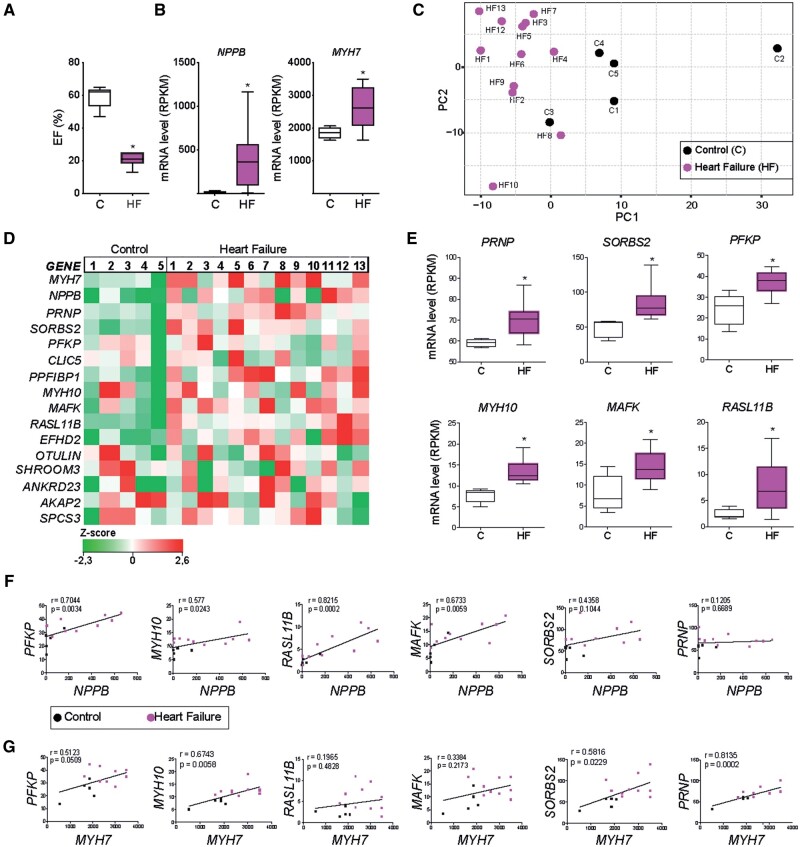
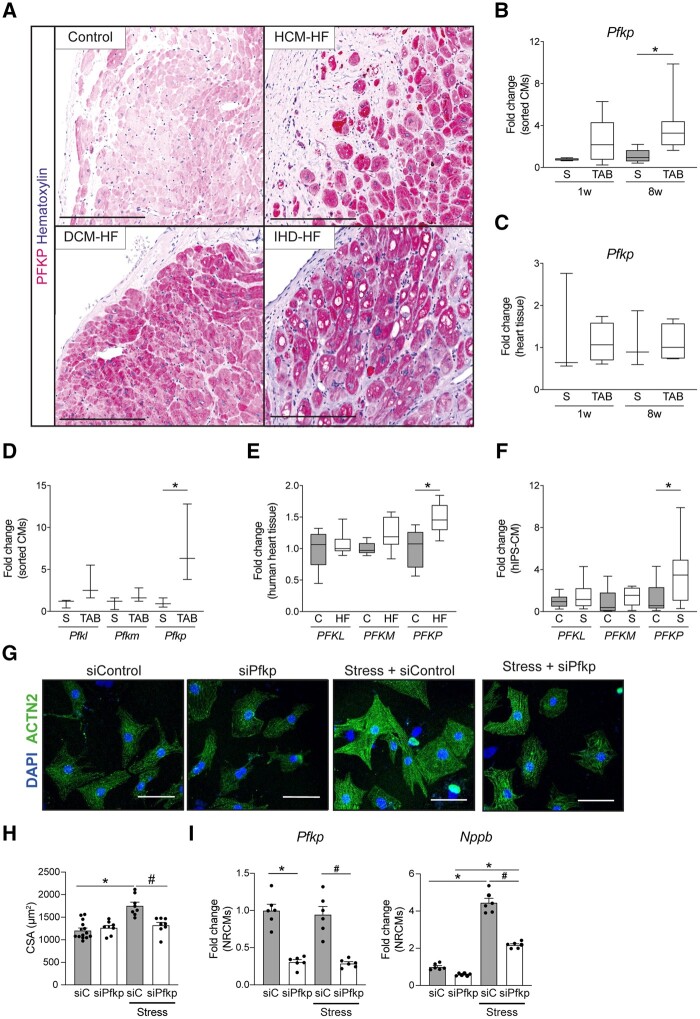
Methods and results: Utilizing CM-specific reporter mice exposed to pressure overload by transverse aortic banding and CM isolation by flow cytometry, we obtained gene expression profiles of hypertrophic CMs in the more immediate phase after stress, and CMs showing pathological hypertrophy. We identified subsets of genes differentially regulated and specific for either stage. Among the genes specifically up-regulated in the CMs during the maladaptive phase we found known stress markers, such as Nppb and Myh7, but additionally identified a set of genes with unknown roles in pathological hypertrophy, including the platelet isoform of phosphofructokinase (PFKP). Norepinephrine-angiotensin II treatment of cultured human CMs induced the secretion of N-terminal-pro-B-type natriuretic peptide (NT-pro-BNP) and recapitulated the up-regulation of these genes, indicating conservation of the up-regulation in failing CMs. Moreover, several genes induced during pathological hypertrophy were also found to be increased in human HF, with their expression positively correlating to the known stress markers NPPB and MYH7. Mechanistically, suppression of Pfkp in primary CMs attenuated stress-induced gene expression and hypertrophy, indicating that Pfkp is an important novel player in pathological remodelling of CMs.

Conclusion: Using CM-specific transcriptomic analysis, we identified novel genes induced during pathological hypertrophy that are relevant for human HF, and we show that PFKP is a conserved failure-induced gene that can modulate the CM stress response.

Keywords: PFKP; Cardiomyocyte; Heart failure; Hypertrophy; Pathological remodelling; RNA sequencing.


Figures

Figure 1
Figure 1
Sorting hypertrophic cardiomyocytes and cardiomyocytes showing signs of pathological remodelling. (A) Strategy for the generation of a CM-specific reporter mouse (Myh6-Cre-tdTomato). (B) Immunofluorescence indicating sarcomeric α-actinin (ACTN2; CMs) and tdTomato. Scale bar is 200 μm. (C) Heart weight to tibia length (HW/TL) ratios (n = 5–7). (D) Wheat germ agglutinin (WGA, upper row) and picrosirius red (SR, bottom row) staining of hearts 1 week or 8 weeks after transverse aortic banding (TAB) and corresponding sham controls. Scale bars are 200 µm. (E) Quantification of cross-sectional area (CSA) of CMs (≥50 cells per heart, n = 5–7). (F) Quantification of ventricular fibrosis (n = 5–7). (G) Schematic drawing of the CM isolation and sorting protocol. (H) Representative FACS plots showing the gating strategy to obtain tdTomato positive CMs. Selections are based on DAPI negativity, tdTomato positivity, and green auto-fluorescence. (I) Forward scatter (FSC)-width plot showing the fraction of sorted cells compared to all events. (J) Representative images of CMs after sort. (K) Bioanalyzer plot showing the RNA quality isolated from the sorted CMs 1 week or 8 weeks after TAB surgery and their respective sham controls. RIN, RNA Integrity Number. Data expressed as mean fold change ± SEM; *P <0.05 compared to sham (S) in unpaired t-test; #P <0.05 comparing sham 1 week to sham 8 weeks with unpaired t-test.
Figure 2
Figure 2
Bulk RNA sequencing analysis reveals differential gene regulation in hypertrophic and pathological CMs. (A) Principle component analysis (PCA) plot showing the distinct gene expression between groups. (B) Venn diagrams showing the intersection between significantly up-regulated genes (log2FC > 1), upper panel in green, and significantly down-regulated genes (log2FC < −1), lower panel in red, in CMs 1 week (TAB 1w) and 8 weeks (TAB 8w) after TAB when compared with corresponding control (sham 1w and sham 8w), respectively (n = 3 per group). (C) Volcano plot of all genes in TAB 1w samples compared to sham 1w. Significant up-regulated genes based on log2FC > 1; and significant down-regulated genes (red) based on log2FC < −1. (D) Volcano plot of all genes in TAB 8w samples compared to sham 8w. Significant up-regulated genes based on log2FC > 1; and significant down-regulated genes (red) based on log2FC < −1. (E) GO enrichment analysis for the up-regulated genes in CMs from TAB 1w and TAB 8w compared to corresponding control. (F) GO enrichment analysis for the down-regulated genes in CMs from TAB 1w and TAB 8w compared to corresponding control.
Figure 3
Figure 3
Known cardiac stress markers are differentially regulated in hypertrophic and pathological CMs. (A) Top 30 differentially up-regulated genes in CMs from TAB 1w (left panel), TAB 1w and TAB 8w (middle panel), and TAB 8w (right panel) compared to corresponding control. (B) Real-time PCR on sorted CMs of differentially up-regulated cardiac stress markers. (C) In situ hybridization analysis for Col3a1 (upper panels), Nppa (middle panels), or Nppb (lower panels) mRNA. Scale bars represent 200 µm. (D) Larger inset of representative images in C showing CMs expressing Col3a1 (upper panel), Nppa (middle panel), or Nppb (lower panel), respectively. Scale bars represent 50 µm. Data are expressed as mean fold change ± SEM; *P <0.05 compared to control (S) and #P <0.05 compared to TAB1w in a one-way ANOVA or unpaired t-test (n = 3).
Figure 4
Figure 4
Genes induced in pathological CMs are increased in stressed human iPS-derived CMs. (A) Representative images of hiPS-CMs in control conditions or after NE and AngII treatment. Immunofluorescence for cardiac troponin T (cTnT) and nuclei DAPI. (B) Calcium transient analysis of the frequency of spontaneous calcium transients and (C) calcium transient analysis of the calcium release of control (C) or NE/Ang II treated (Stress) CMs. (D) Representative spontaneous calcium transients in control (upper panel) and stressed (lower panel) iPS-derived CMs. (E) Human NT-proBNP content in the supernatant of control and NE/AngII (stress) treated CMs determined by ELISA assay (n = 5). (F) Real-time PCR analysis of stress markers and the newly identified genes on NE-AngII treated CMs. Data are expressed as mean fold change ± SEM; *P <0.05 compared to control (C) with unpaired t-test (n = 3–9) or in a two-way ANOVA.
Figure 5
Figure 5
Genes induced in pathological CMs are increased during human heart failure. (A) Average percentage ejection fraction (EF %) in non-failing controls (C) and heart failure patients (HF). (B) Expression analysis of cardiac failure markers NPPB and MYH7 from control and diseased hearts. RPKM, reads per kilobase million. (C) Unsupervised principal component analysis (PCA) plot. Each dot represents an expression profile of an individual sample plotted by PCA score showing diseased hearts cluster together and are distinct from controls. (D) Gene expression map representing the expression of MYH7 and NPPB and 14 novel genes identified in the failing CMs, in control and disease hearts. (E) RPKM levels of six novel genes showing a significant up-regulation in disease hearts (HF) when compared with control (C). (F) Correlation between the cardiac failure marker NPPB and the six significantly up-regulated genes identified in E. (G) Correlation between the cardiac failure marker MYH7 and the six significantly up-regulated genes identified in E. Spearman r values and P-values are shown in the graphs. Data are expressed as mean ± SEM or mean fold change ± SEM; *P <0.05 compared to control in an unpaired t-test (n = 5–13).
Figure 6
Figure 6
PFKP is expressed in human failing CMs. (A) Immunohistochemistry of PFKP in healthy and HF dilated cardiomyopathy (DCM-HF), hypertrophic cardiomyopathy (HCM-HF), and ischaemic heart disease (IHD-HF). (B) Real-time PCR of PFKP on mouse sorted CMs (n = 3) on sham (S) or TAB conditions. (C) Real-time PCR of PFKP on mouse heart tissue (n = 4–7) on sham (S) or TAB conditions. (D) Expression analysis of PFK isoforms PFKM (phosphofructokinase-muscle) and PFKL (phosphofructokinase-liver) from bulk RNA sequencing of mouse sorted CMs 8w post TAB (n = 3). (E) Expression analysis of PFK isoforms PFKM (phosphofructokinase-muscle) and PFKL (phosphofructokinase-liver) from RNA sequencing of human failing hearts (n = 5–13). (F) Real-time PCR of PFK- isoforms on NE/AngII treated hiPS-derived CMs (n = 6–9). (G) Representative images of control or PE-treated NRCMs transfected with scramble siRNA control or Pfkp siRNA. Immunofluorescence for sarcomeric α actinin (ACTN2) and nuclei DAPI. (H) Cardiomyocyte cross-sectional area (CSA) quantification (n = >120), and (I) real-time PCR analysis of the cardiac stress markers Nppb and Pfkp of control or PE-treated NRCMs transfected with Pfkp siRNA (siPFKP) or scrambled siRNA control (si-C) (n = 6). (BF) Data are expressed as average fold change with box (25–75 percentile) and whiskers (min–max); *P <0.05 in one way ANOVA with Sidak post hoc test. (H and I) Data are expressed as mean fold change ± SEM; *P <0.05 compared to control (C) or sham (S) and #P <0.05 compared to siRNA control-stressed (si-C-Stress) in a one-way ANOVA or unpaired t-test.

References

    1. Braunwald E. The war against heart failure: the Lancet lecture. Lancet 2015;385:812–824. - PubMed
    1. Burchfield JS, Xie M, Hill JA.. Pathological ventricular remodeling: mechanisms: part 1 of 2. Circulation 2013;128:388–400. - PMC - PubMed
    1. Fountoulaki K, Dagres N, Iliodromitis EK.. Cellular Communications in the Heart. Card Fail Rev 2015;1:64–68. - PMC - PubMed
    1. Bertero E, Maack C.. Metabolic remodelling in heart failure. Nat Rev Cardiol 2018;15:457–470. - PubMed
    1. Rosca MG, Hoppel CL.. Mitochondria in heart failure. Cardiovasc Res 2010;88:40–50. - PMC - PubMed

Publication types

MeSH terms