. 2020 Dec 15;202(12):1666-1677.
doi: 10.1164/rccm.201912-2441OC.

Respiratory Tract Dysbiosis Is Associated with Worse Outcomes in Mechanically Ventilated Patients

Affiliations

Respiratory Tract Dysbiosis Is Associated with Worse Outcomes in Mechanically Ventilated Patients

Georgios D Kitsios et al. Am J Respir Crit Care Med. .

Abstract

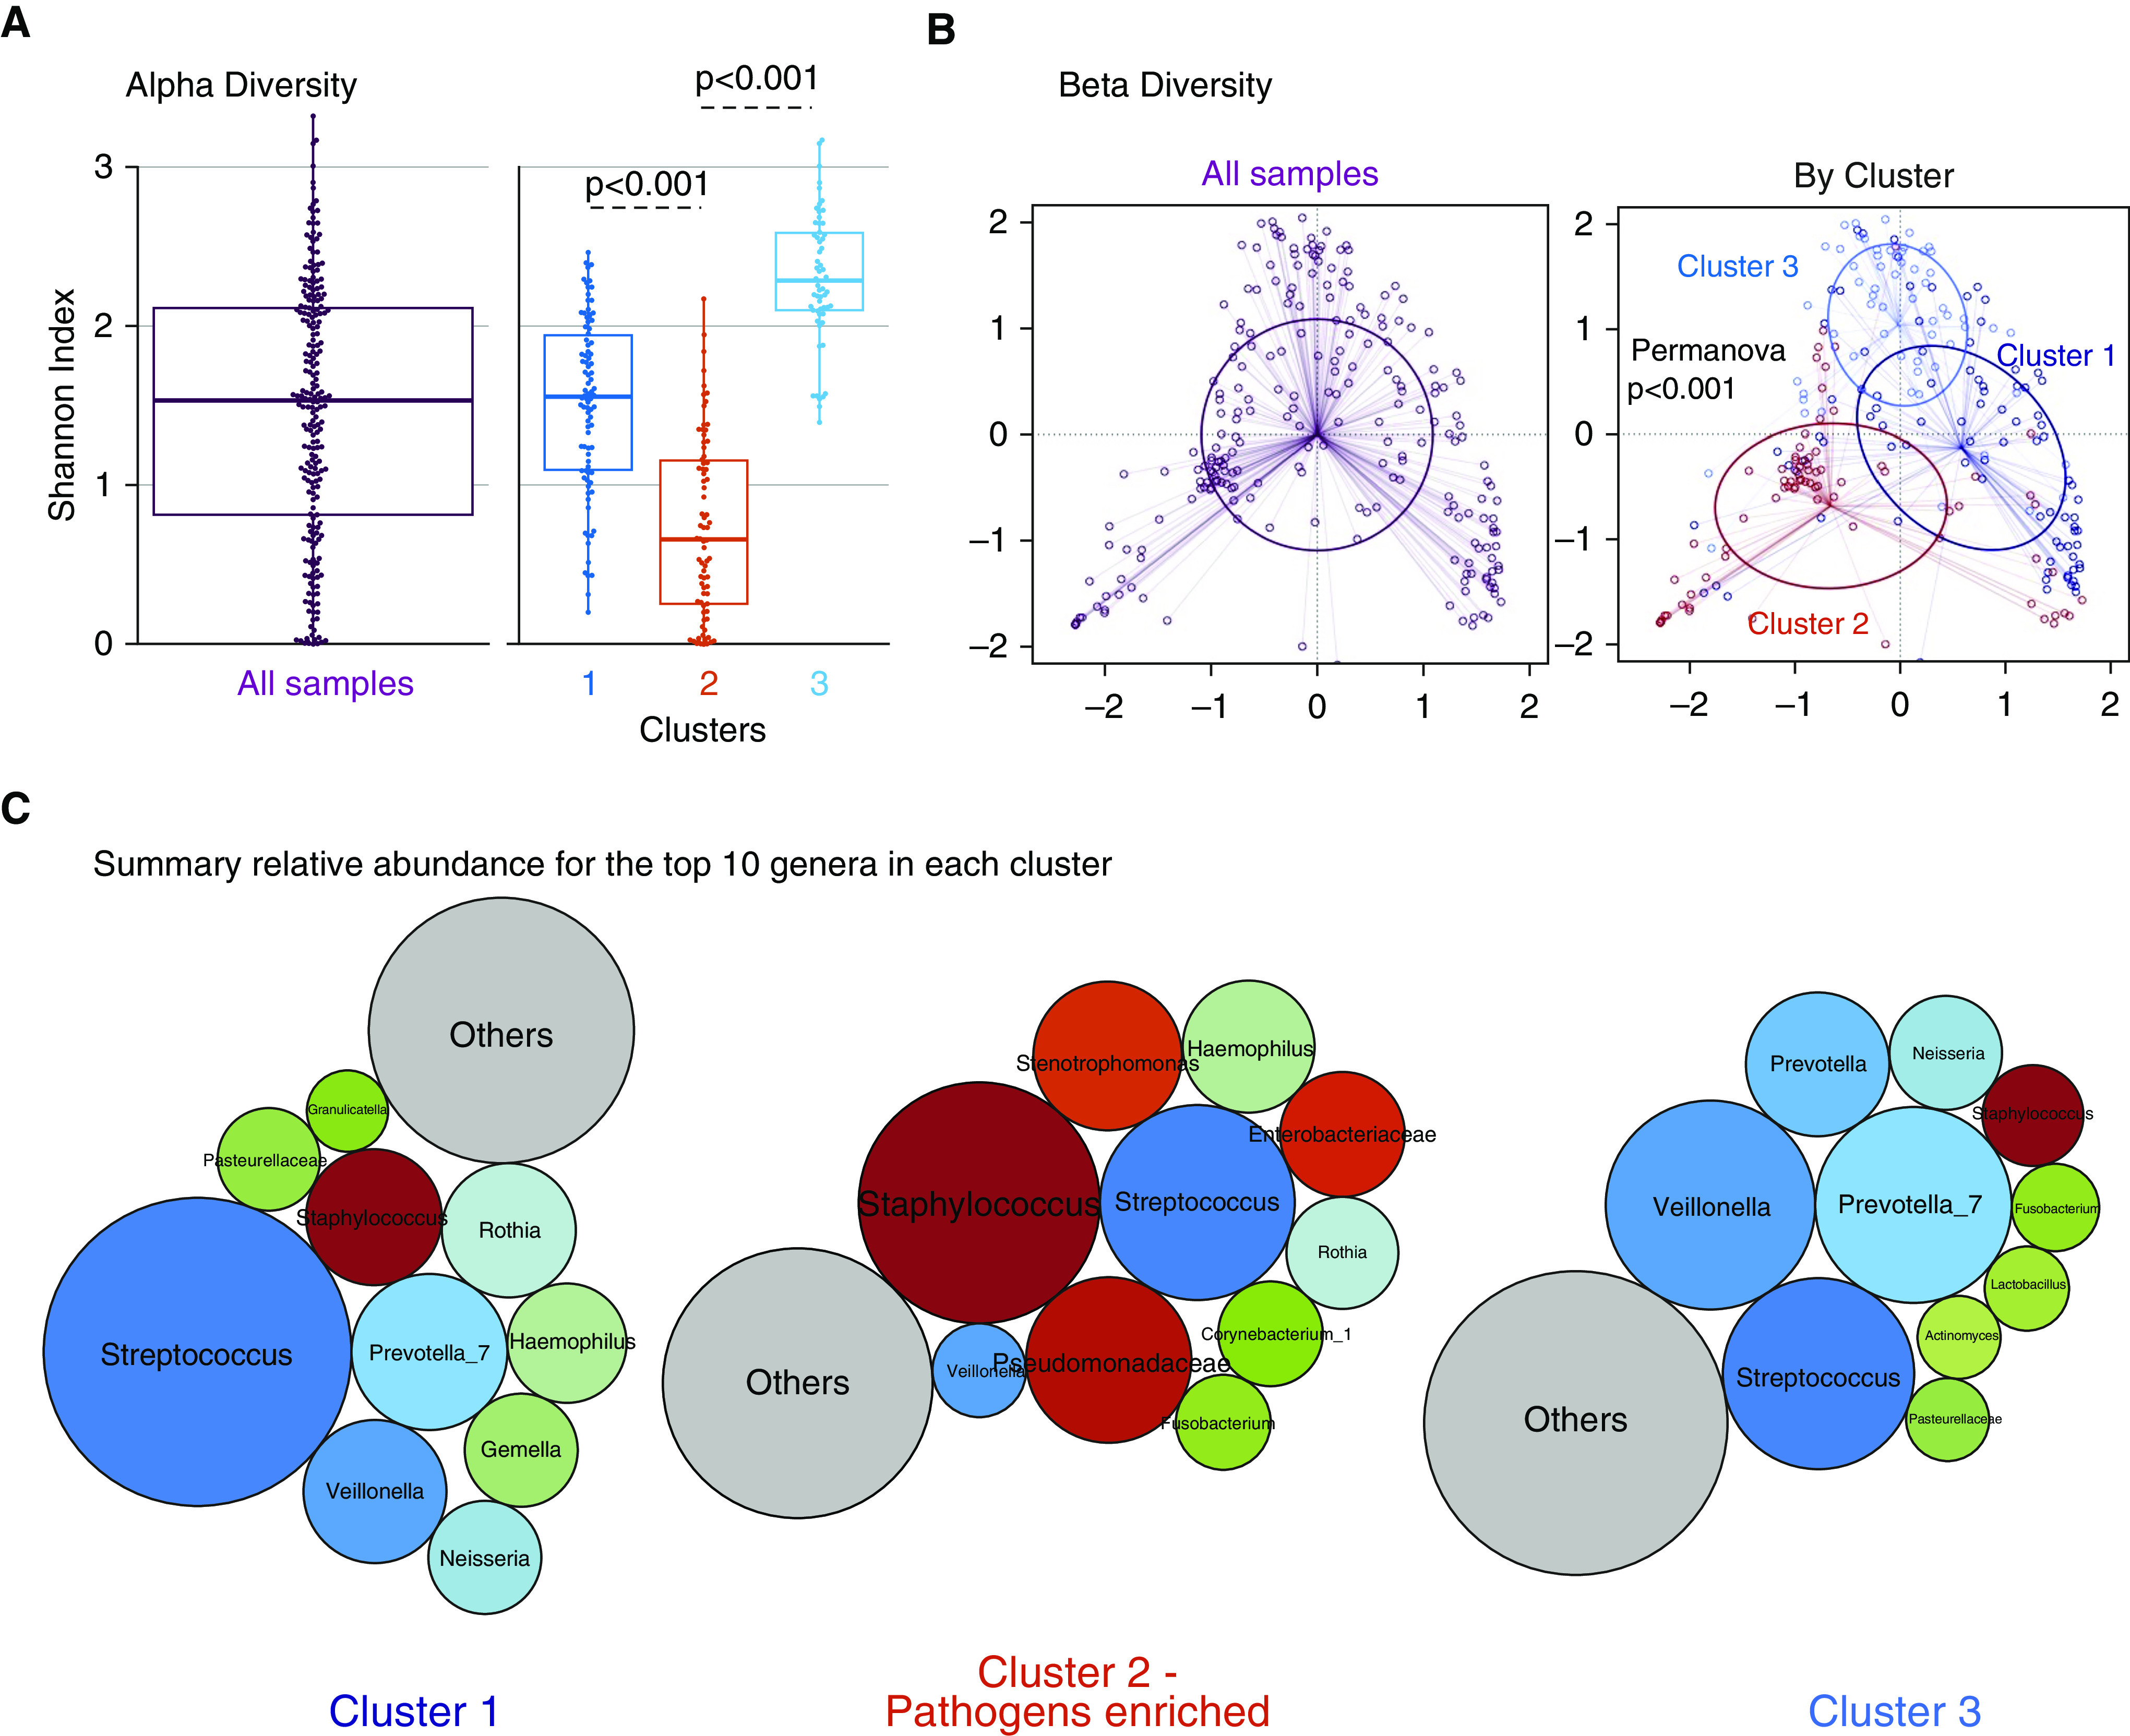
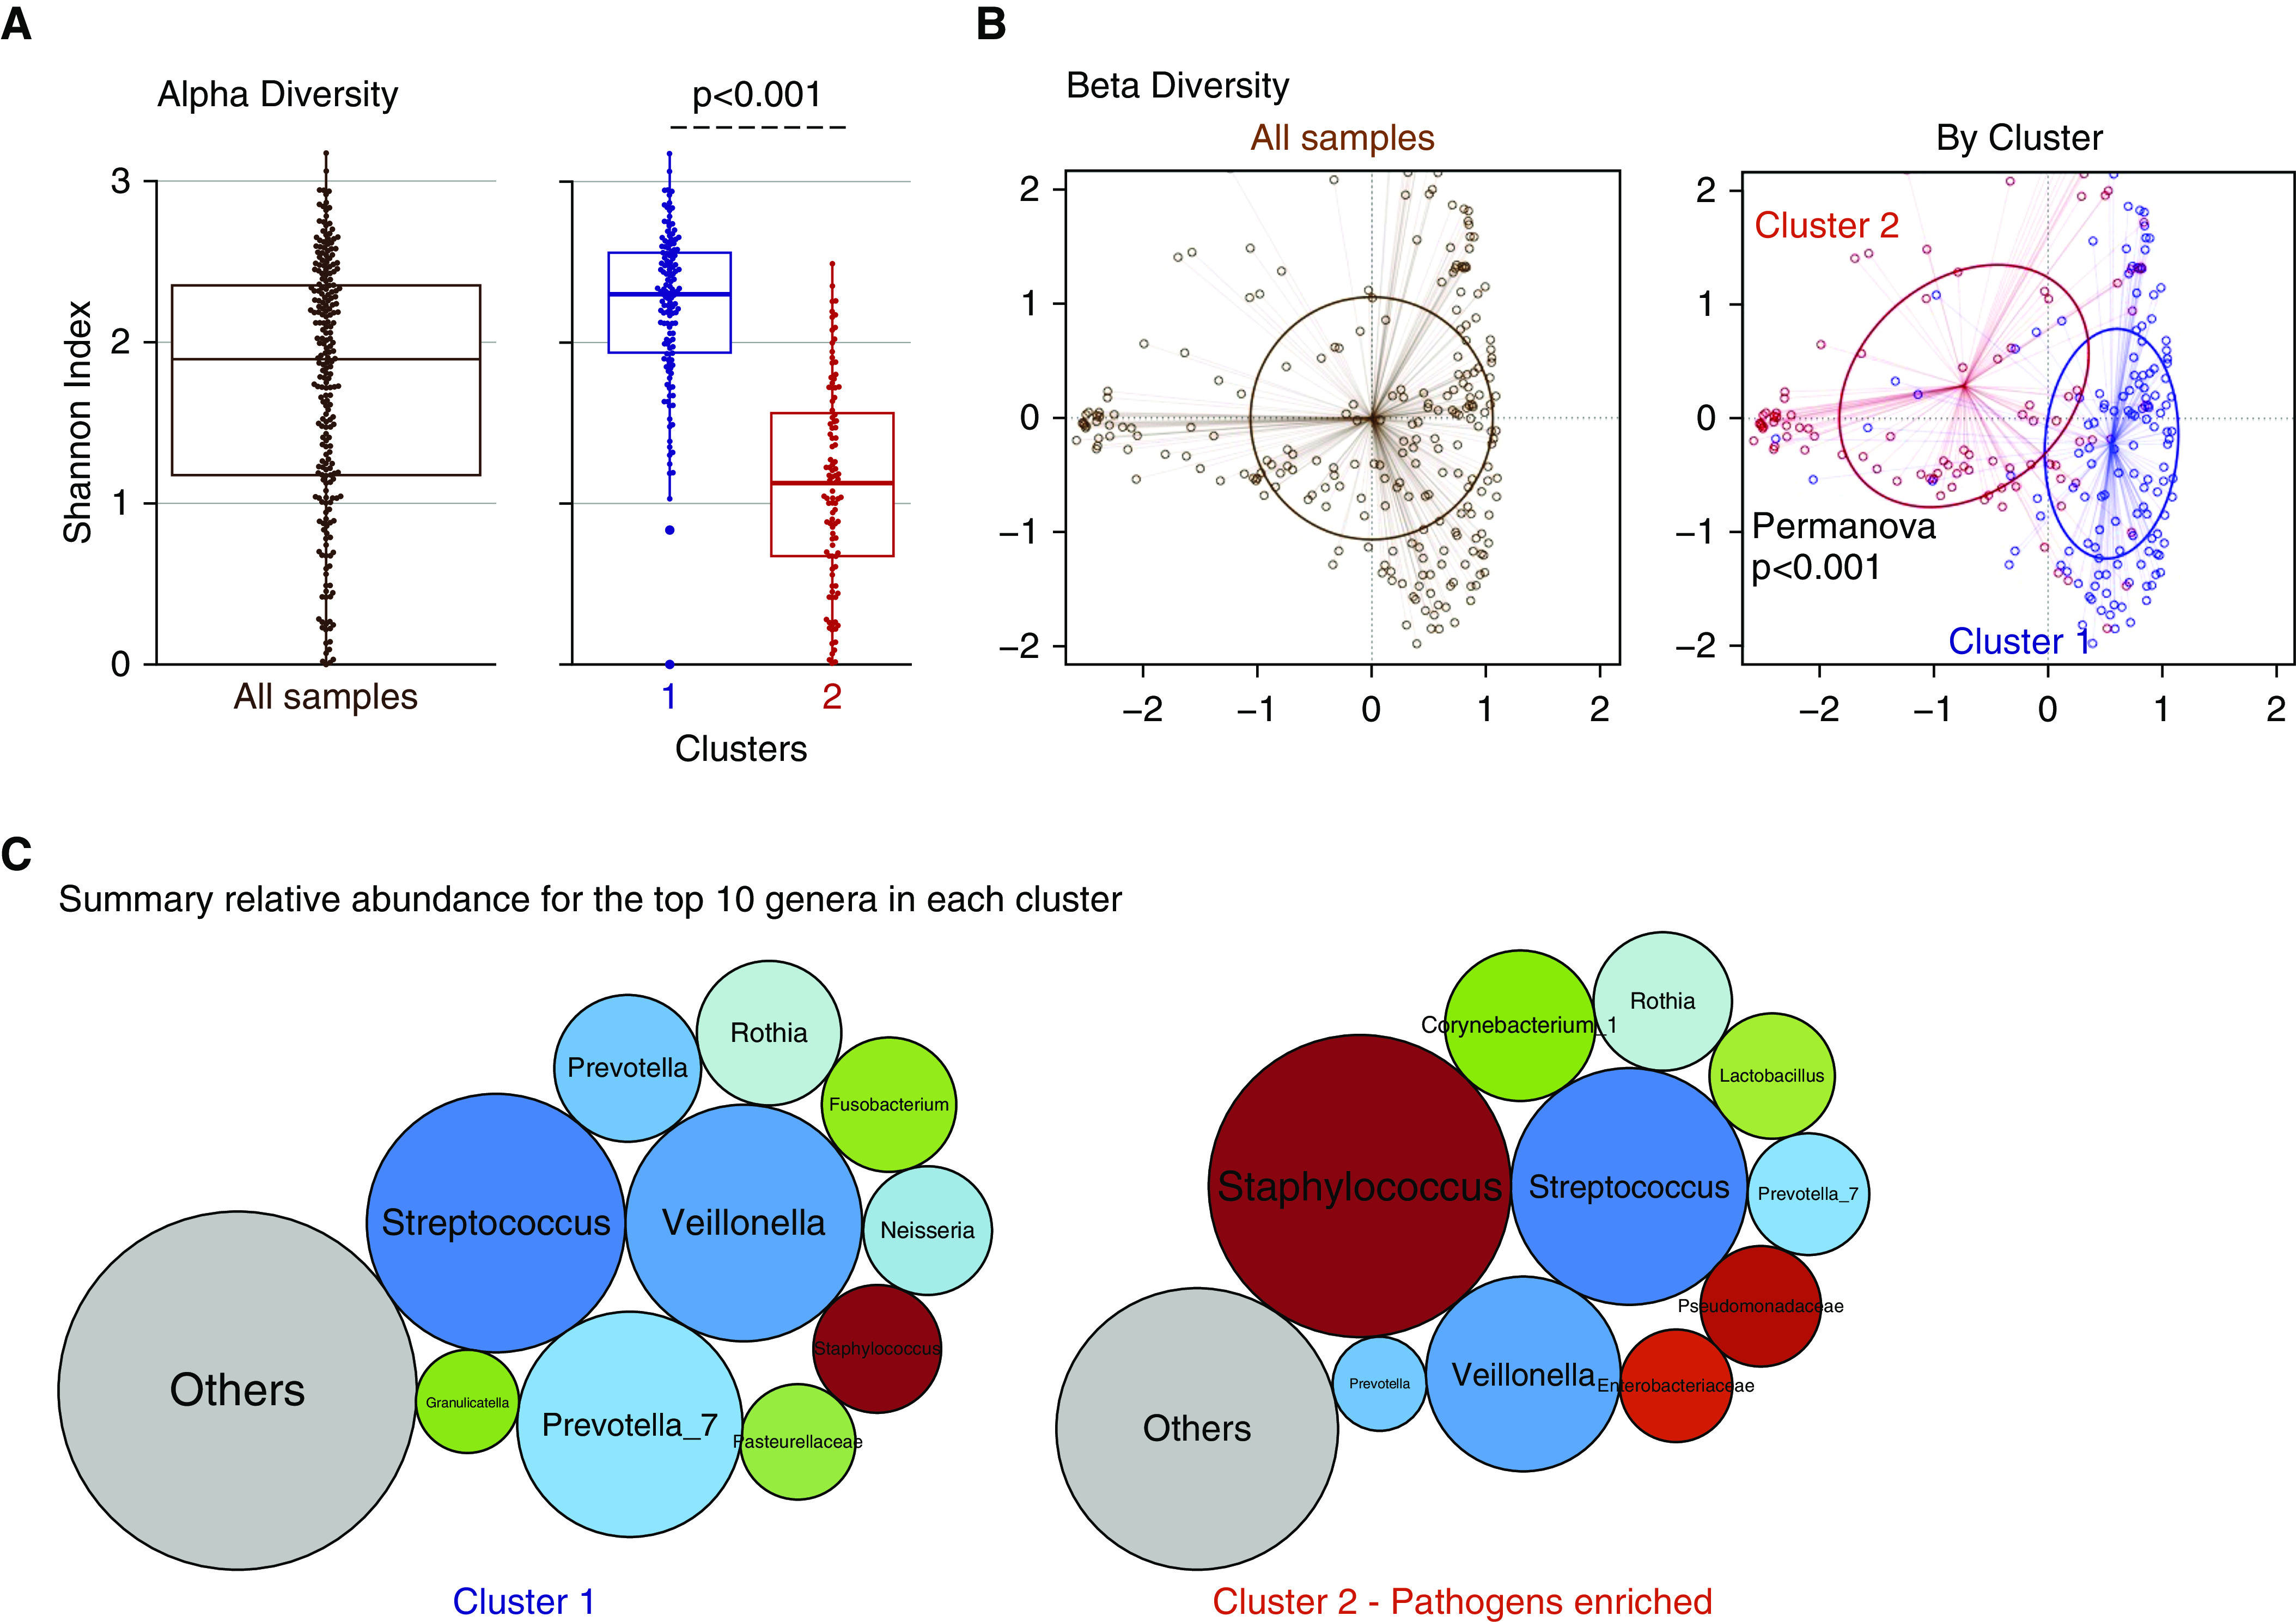
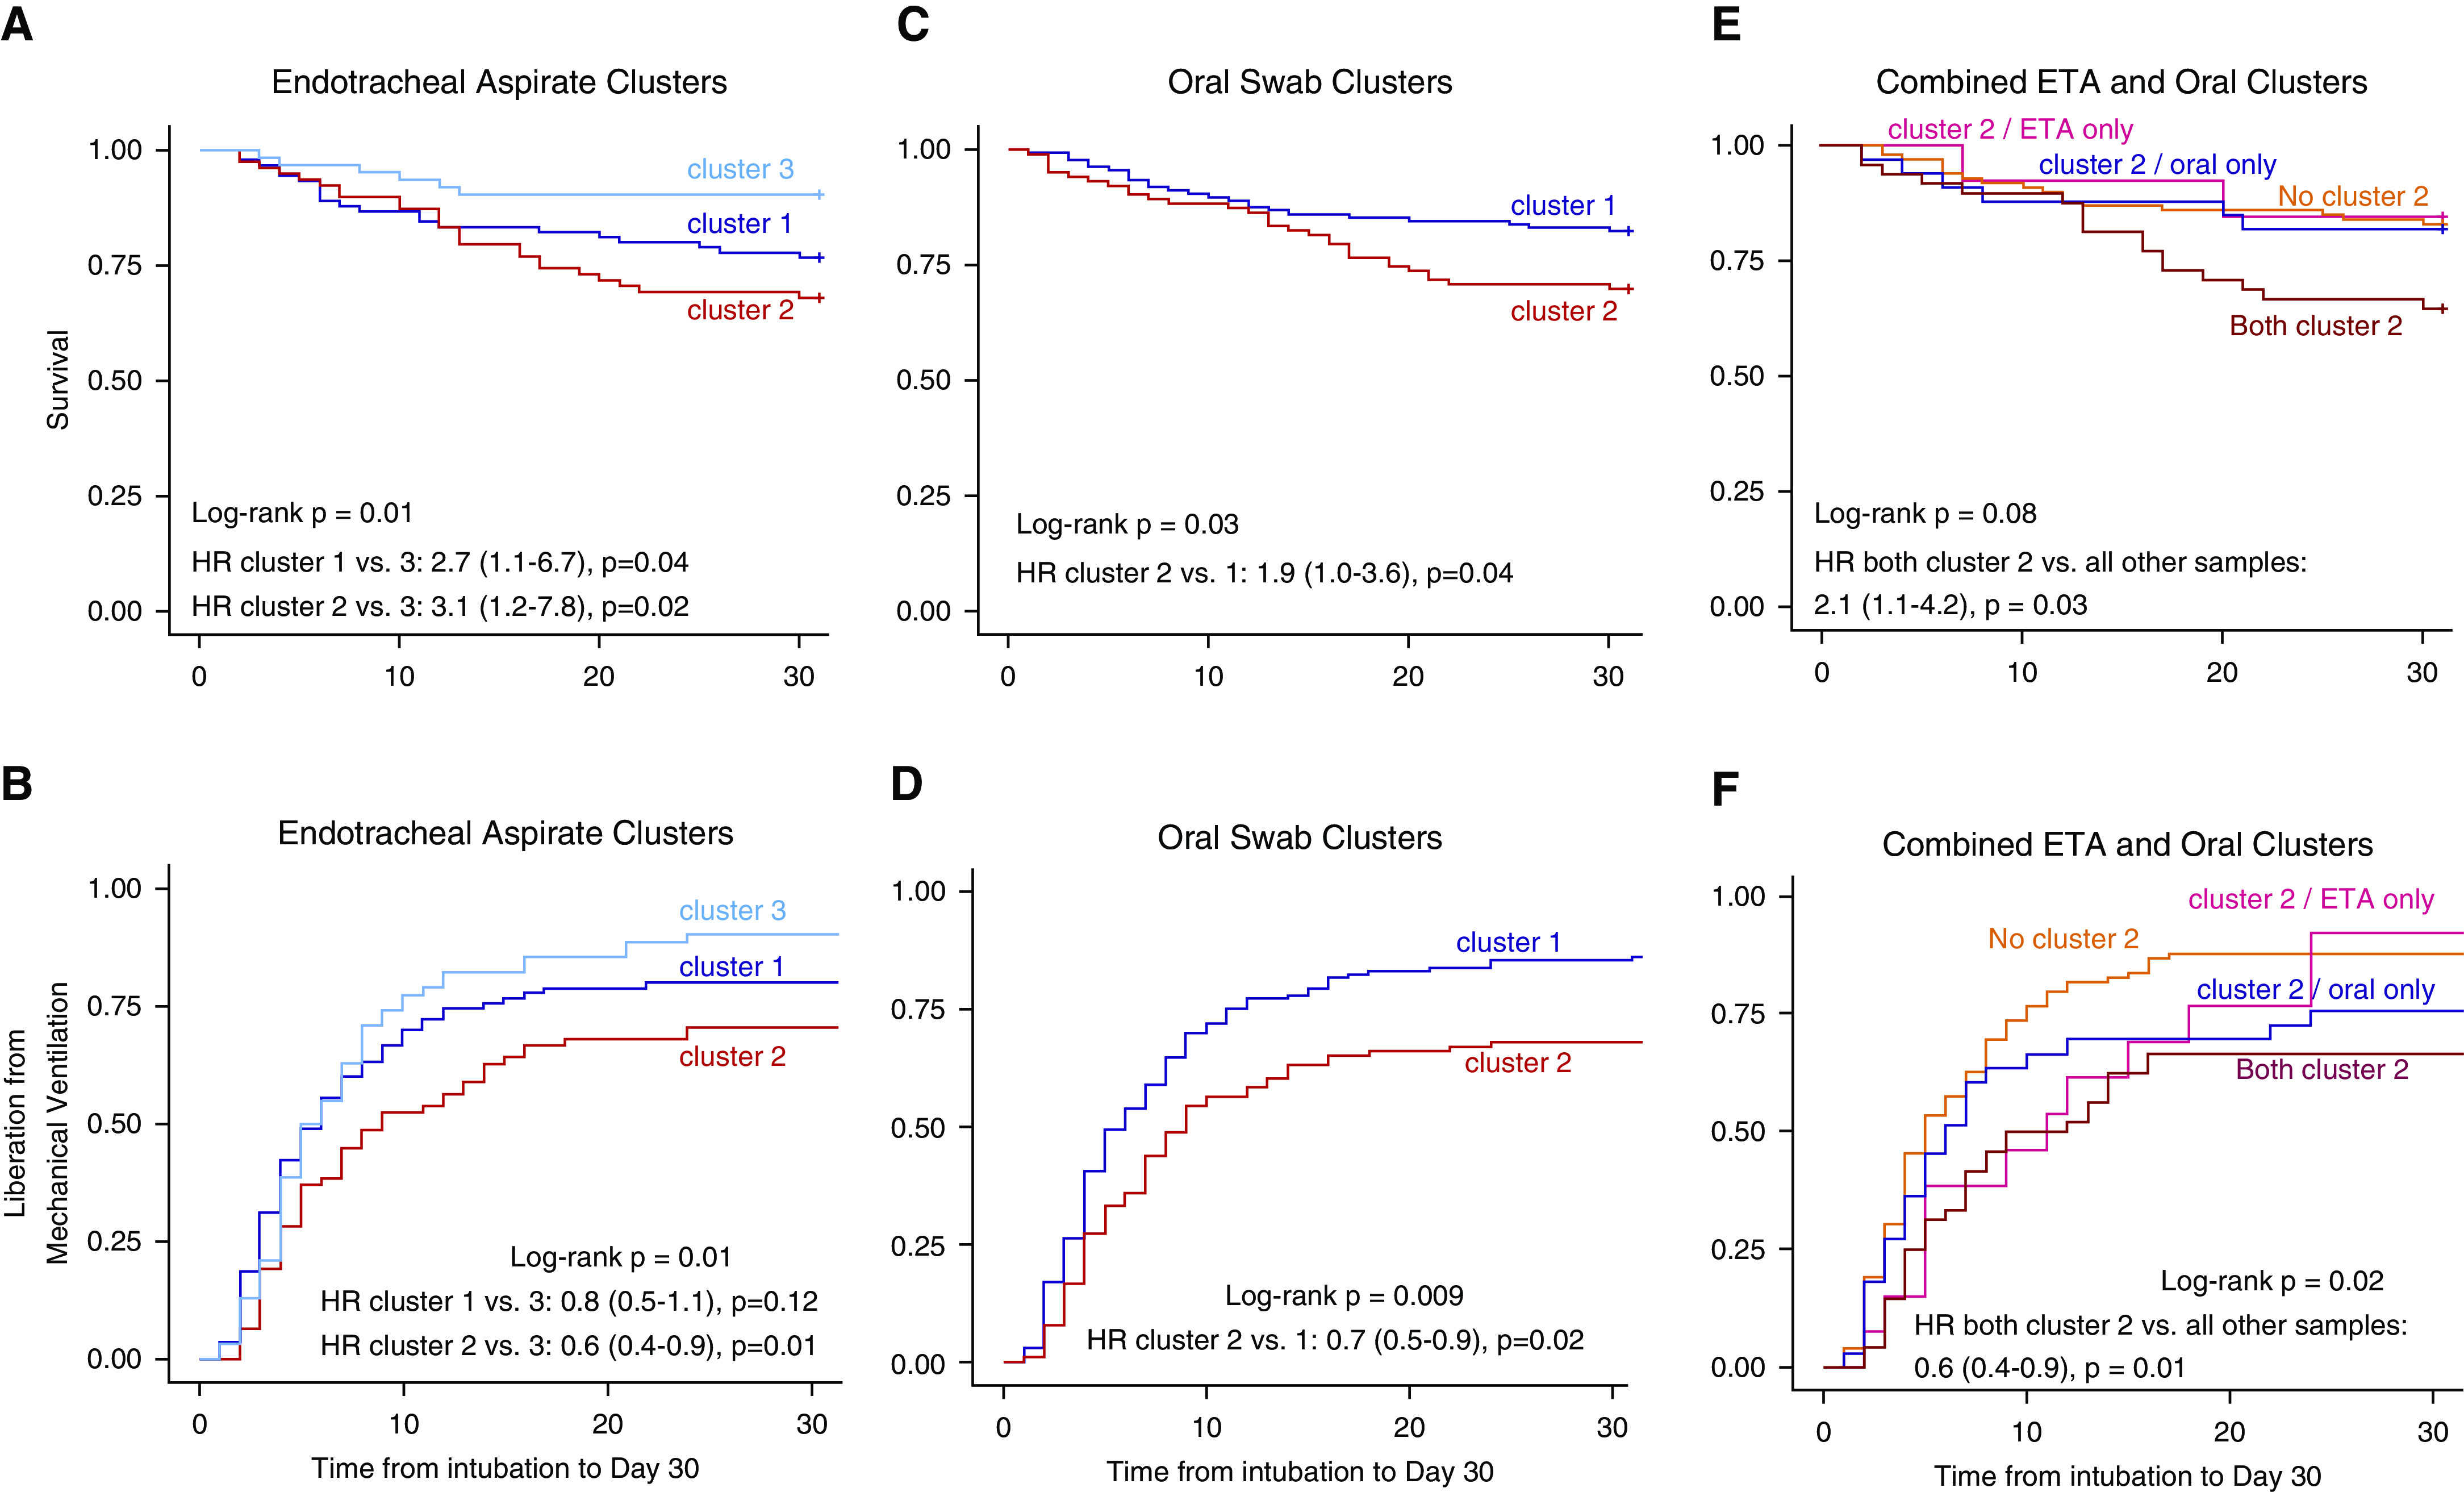
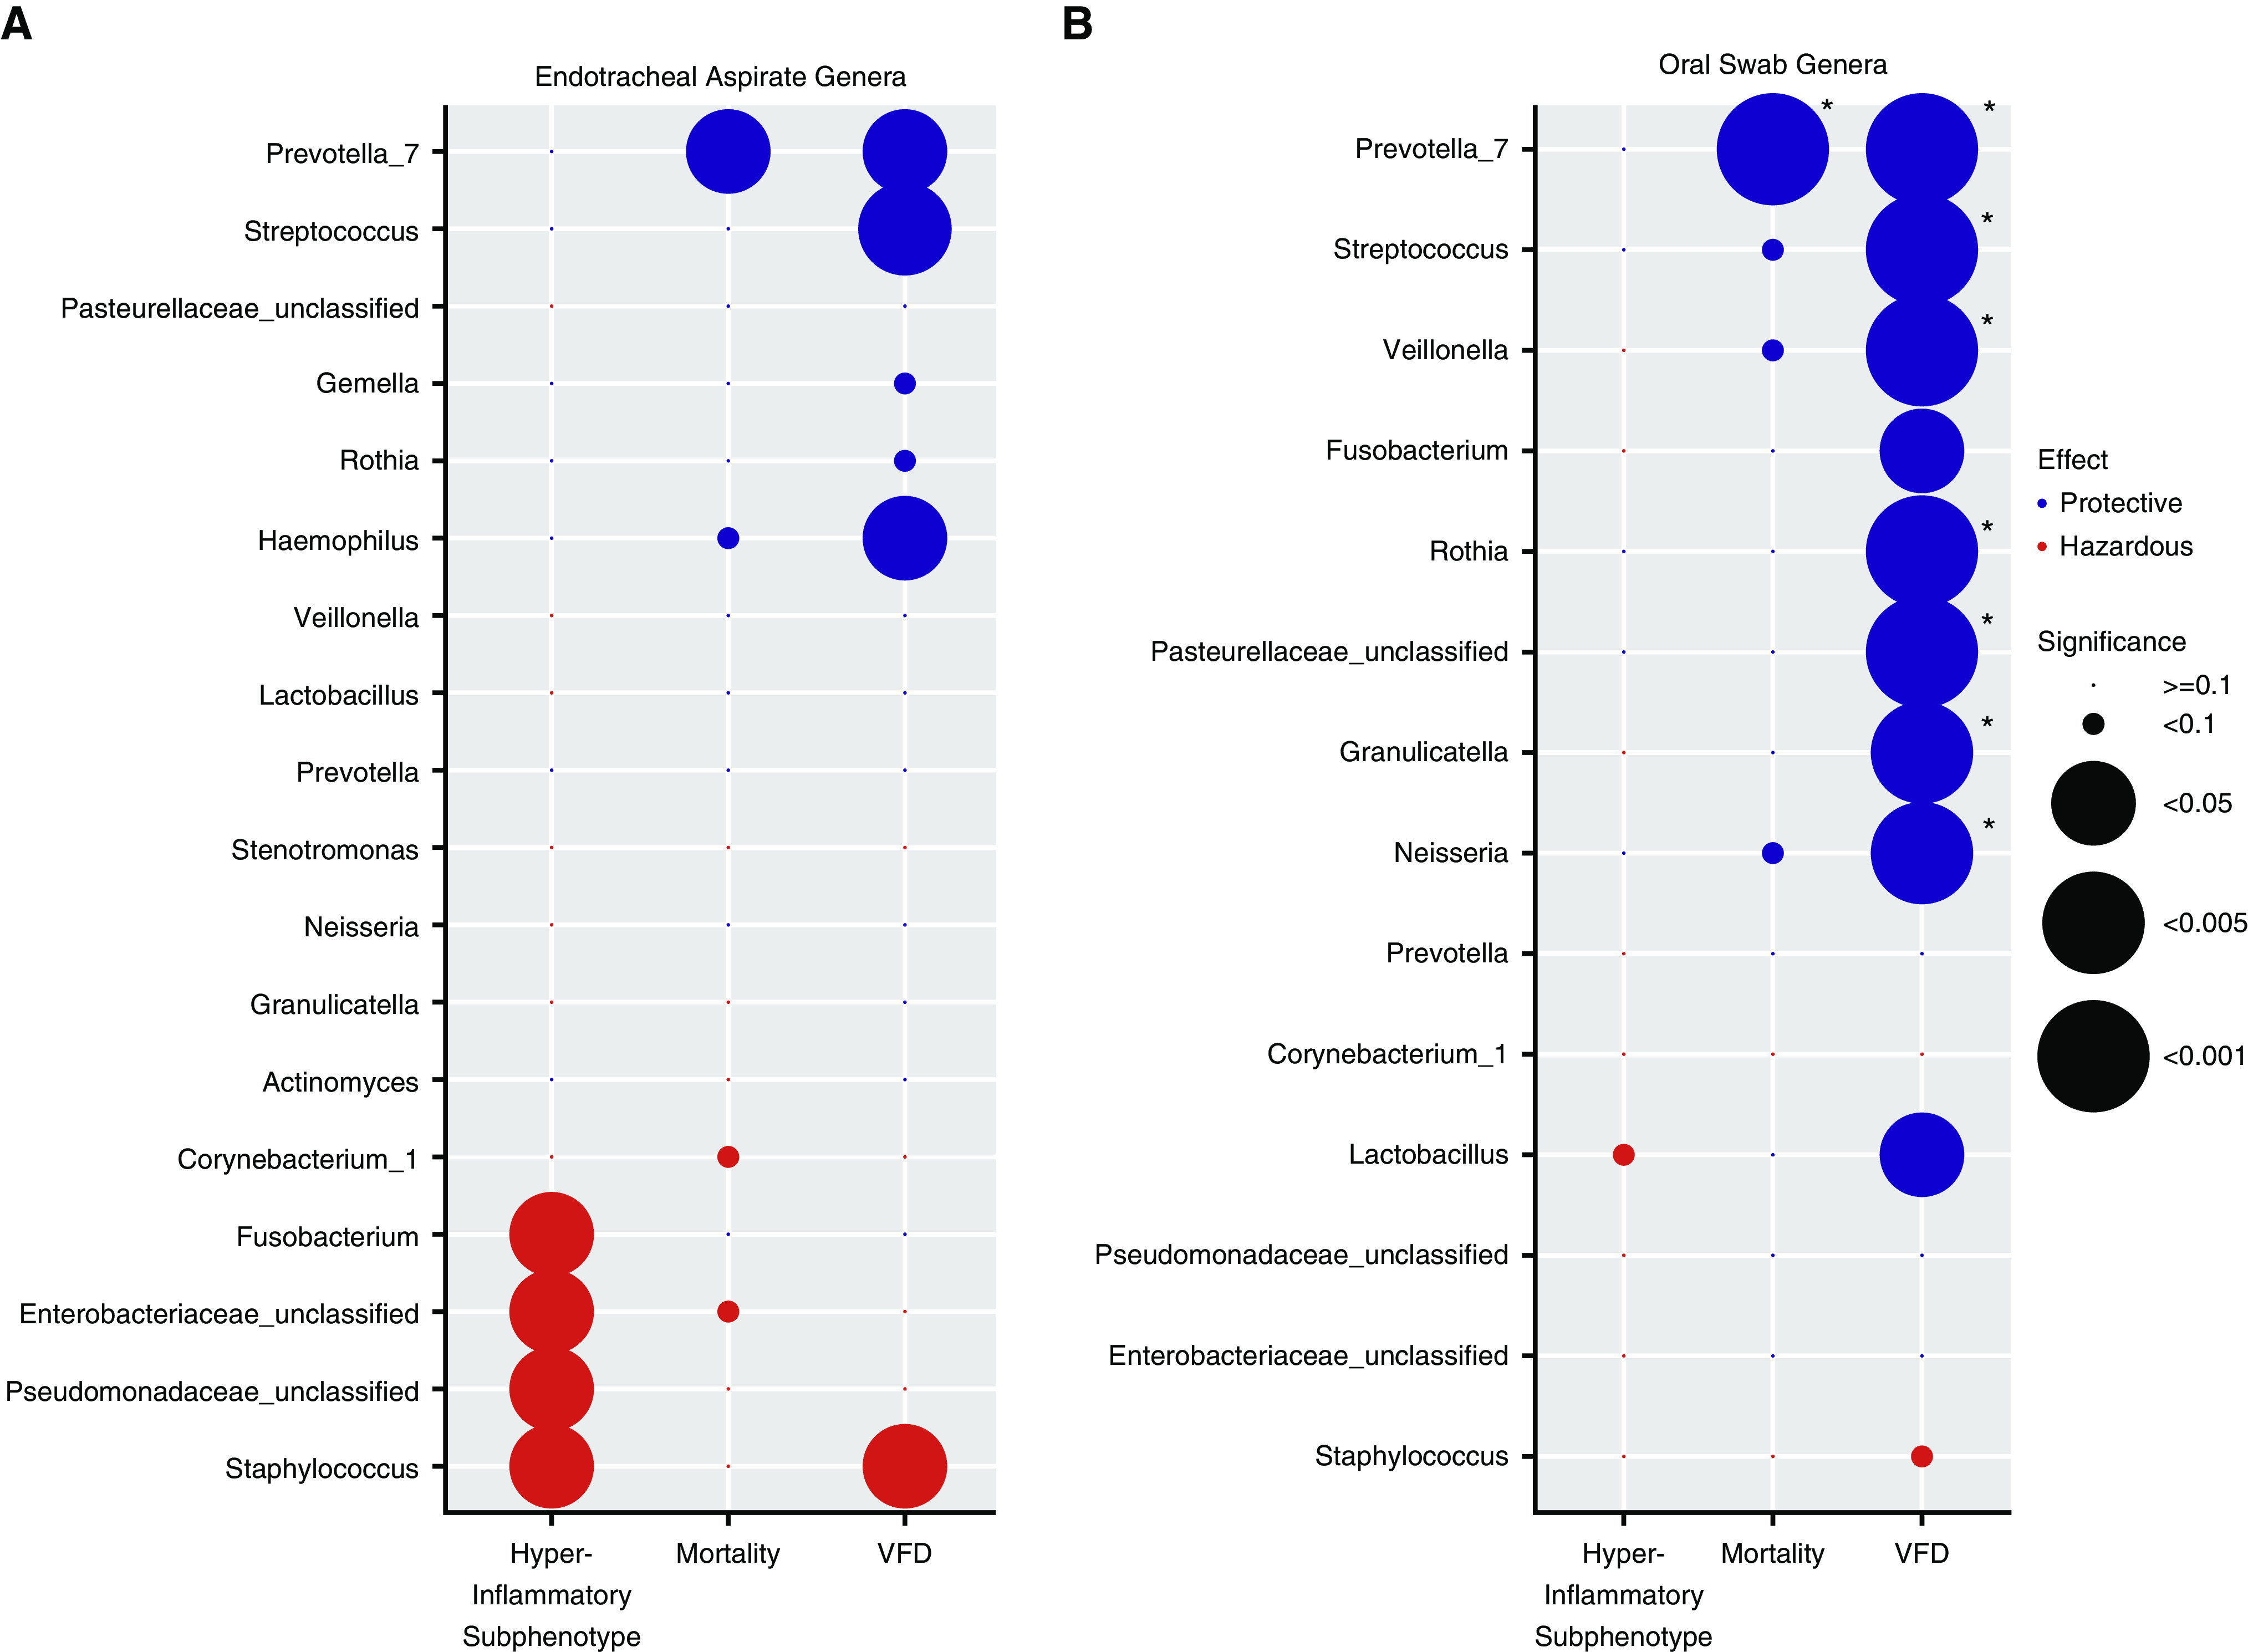
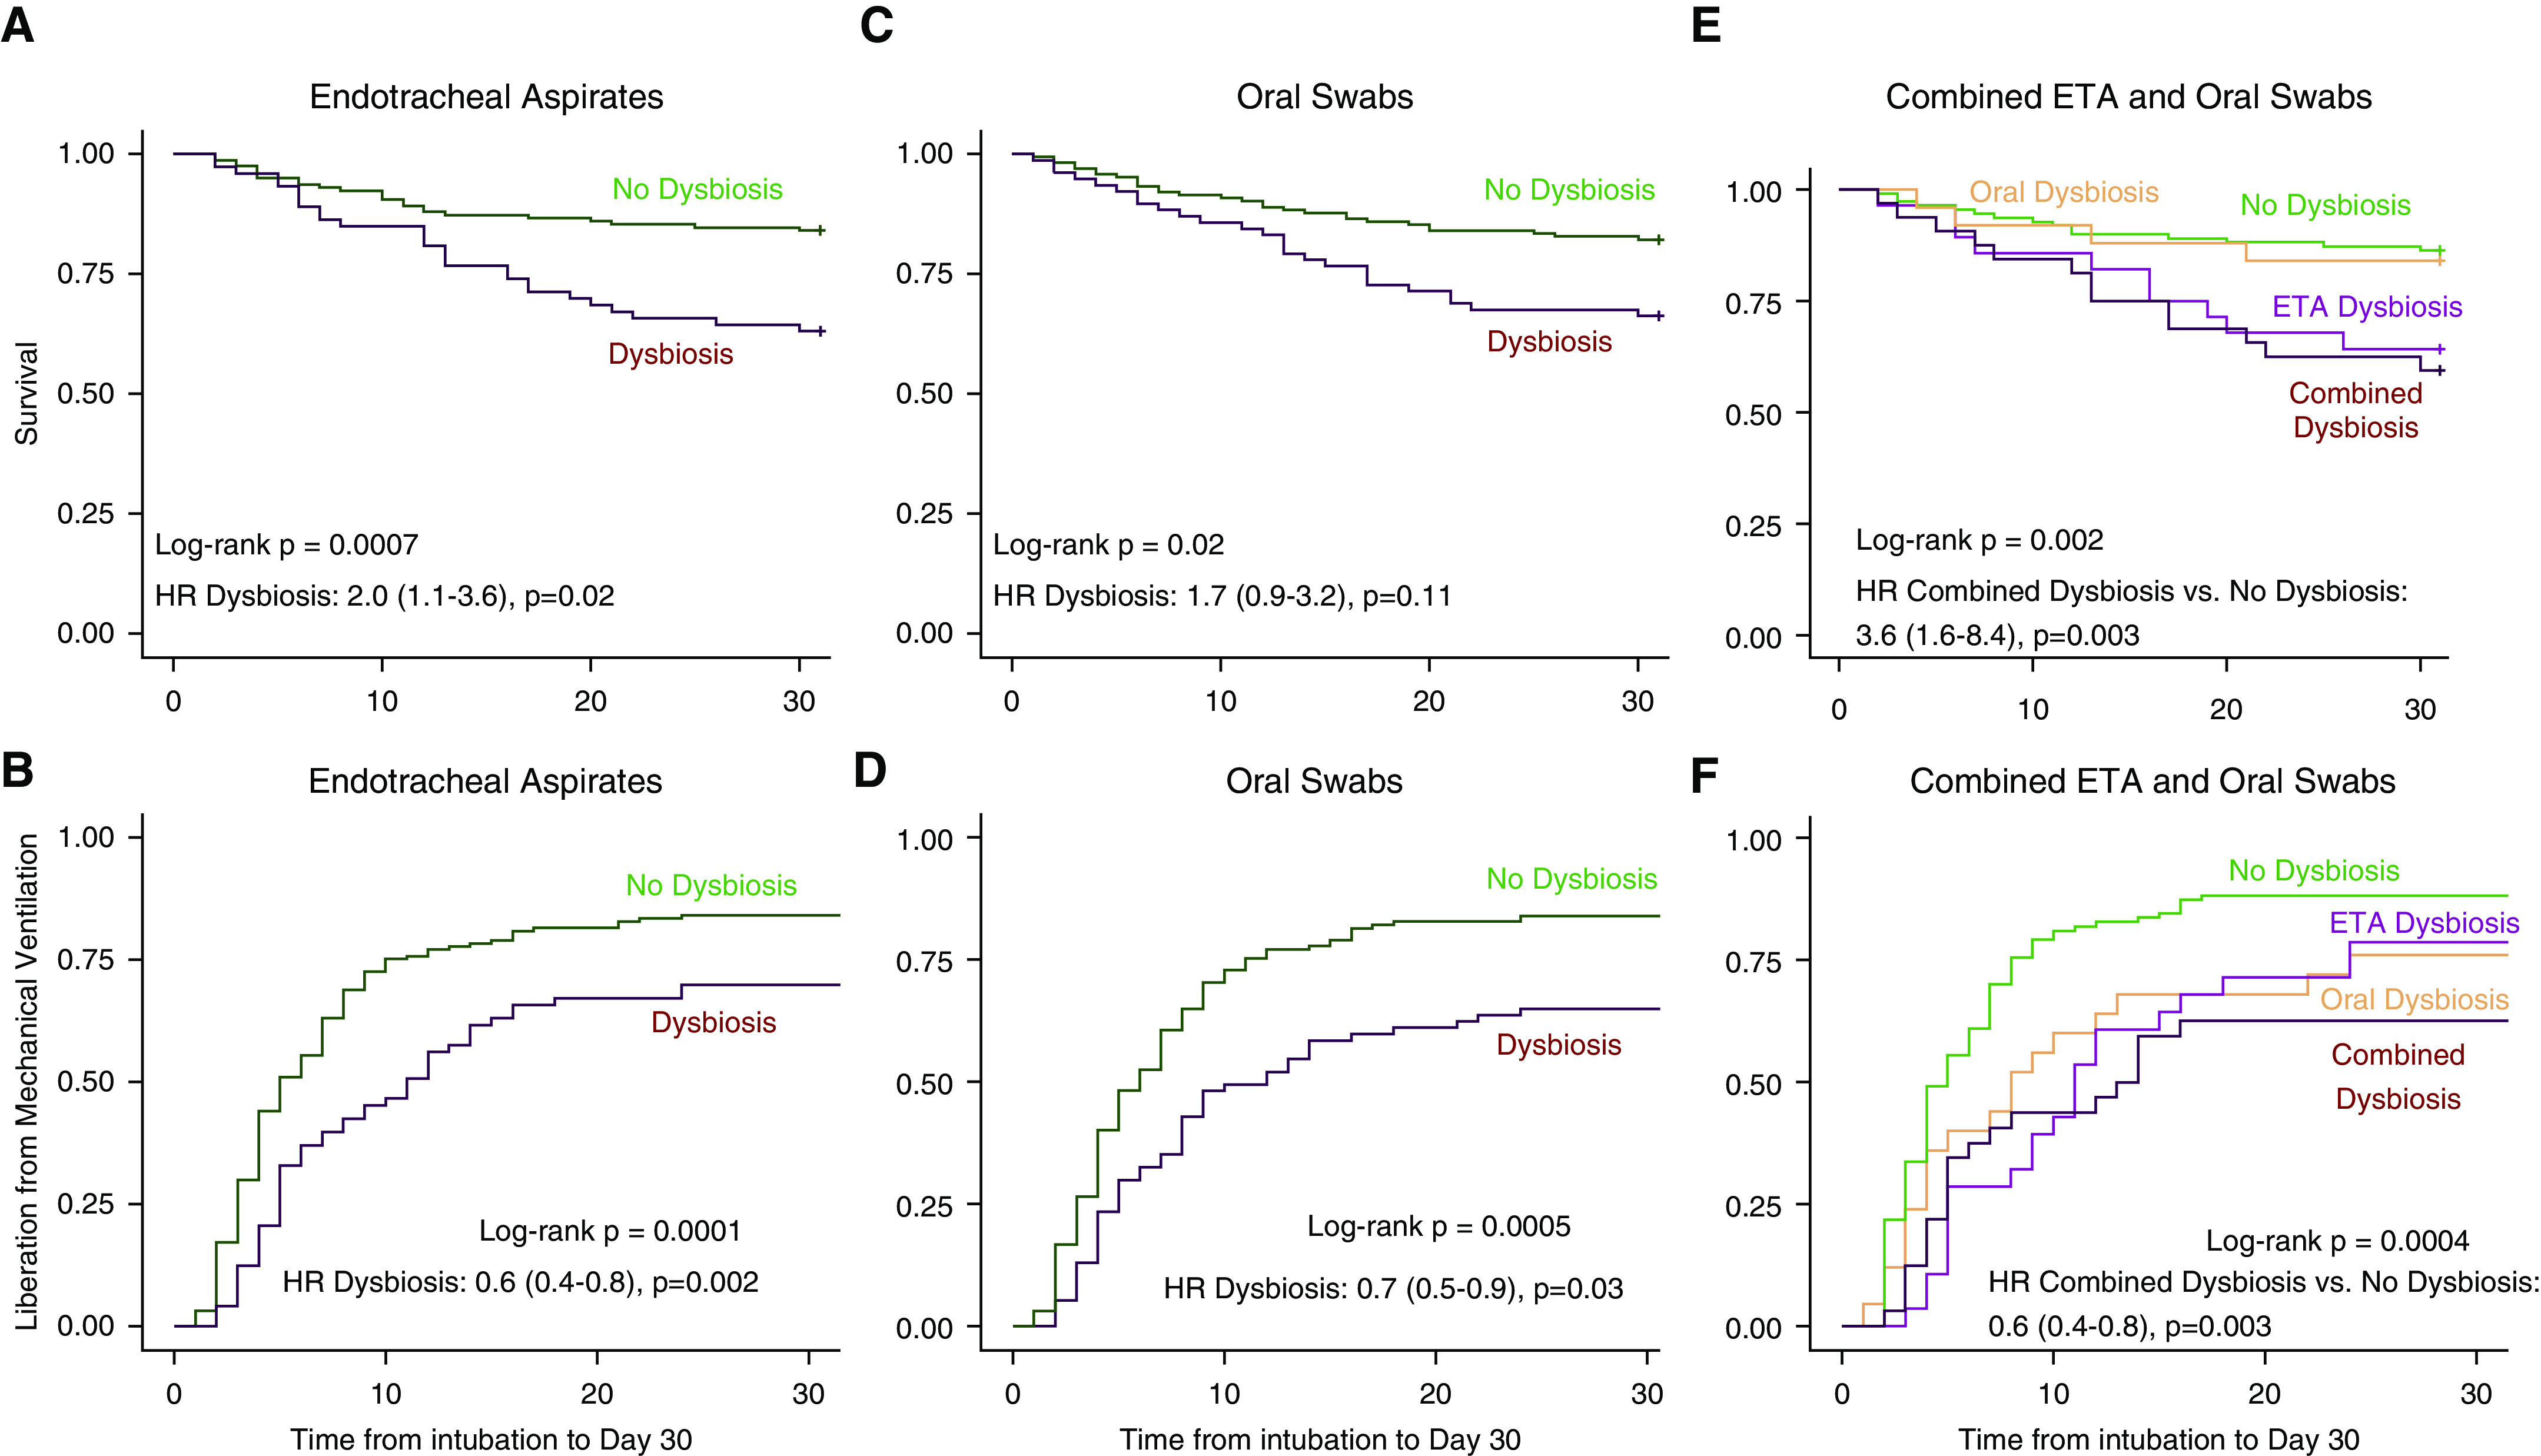
Rationale: Host inflammatory responses have been strongly associated with adverse outcomes in critically ill patients, but the biologic underpinnings of such heterogeneous responses have not been defined.Objectives: We examined whether respiratory tract microbiome profiles are associated with host inflammation and clinical outcomes of acute respiratory failure.Methods: We collected oral swabs, endotracheal aspirates (ETAs), and plasma samples from mechanically ventilated patients. We performed 16S ribosomal RNA gene sequencing to characterize upper and lower respiratory tract microbiota and classified patients into host-response subphenotypes on the basis of clinical variables and plasma biomarkers of innate immunity and inflammation. We derived diversity metrics and composition clusters with Dirichlet multinomial models and examined our data for associations with subphenotypes and clinical outcomes.Measurements and Main Results: Oral and ETA microbial communities from 301 mechanically ventilated subjects had substantial heterogeneity in α and β diversity. Dirichlet multinomial models revealed a cluster with low α diversity and enrichment for pathogens (e.g., high Staphylococcus or Pseudomonadaceae relative abundance) in 35% of ETA samples, associated with a hyperinflammatory subphenotype, worse 30-day survival, and longer time to liberation from mechanical ventilation (adjusted P < 0.05), compared with patients with higher α diversity and relative abundance of typical oral microbiota. Patients with evidence of dysbiosis (low α diversity and low relative abundance of "protective" oral-origin commensal bacteria) in both oral and ETA samples (17%, combined dysbiosis) had significantly worse 30-day survival and longer time to liberation from mechanical ventilation than patients without dysbiosis (55%; adjusted P < 0.05).Conclusions: Respiratory tract dysbiosis may represent an important, modifiable contributor to patient-level heterogeneity in systemic inflammatory responses and clinical outcomes.

Keywords: acute respiratory distress syndrome; bacterial infections; endotypes; inflammation; microbiota.


Figures

Figure 1.
Figure 1.
Dirichlet-multinomial-model clustering of endotracheal aspirate communities reveals a distinct cluster marked by pathogen abundance and low α diversity. (A) The α-diversity comparisons between clusters showed that cluster 2 had the lowest Shannon index, followed by cluster 1. (B) Principal coordinates analyses for β-diversity comparisons (Manhattan distances) with Permanova for all samples included and stratified by clusters. (C) Summary of the relative abundance for the top 10 genera in each cluster, visualized as bubble plots. The diameter of each circle corresponds to the mean relative abundance of each genus across all samples in the cluster. Streptococcus was the most abundant genus in cluster 1, and cluster 2 had high abundance for typical respiratory pathogens (shown in variations of red), such as Staphylococcus, Pseudomonadaceae, and Stenotrophomonas, whereas cluster 3 had high abundance of Prevotella_7, Veillonella, and Streptococcus genera. Genera beyond the top 10 genera demonstrated in these bubble plots were summarized to their overall relative abundance as a single bubble in gray and annotated as “Others.” Permanova = permutational ANOVA.
Figure 2.
Figure 2.
Dirichlet-multinomial-model clustering of oral-swab communities reveals a distinct cluster marked by pathogen abundance and low α diversity. (A) The α-diversity comparisons between clusters showed that cluster 2 had a significantly lower Shannon index. (B) Principal coordinates analyses for β-diversity comparisons (Manhattan distances) with Permanova for all samples included and stratified by cluster. (C) Summary of the relative abundance for the top 10 genera in each cluster, visualized as bubble plots. The diameter of each circle corresponds to relative abundance of each genus across all samples in the cluster. Streptococcus, Prevotella_7, and Veillonella were the most abundant genera in cluster 1, whereas Staphylococcus was the most abundant genus in cluster 2. Genera beyond the top 10 genera demonstrated in these bubble plots were summarized to their overall relative abundance as a single bubble in gray and annotated as “Others.” Permanova = permutational ANOVA.
Figure 3.
Figure 3.
Patients with respiratory tract profiles belonging to the pathogen-enriched cluster 2 have worse 30-day survival and longer time to liberation from mechanical ventilation. (A and B) Kaplan-Meier curves for 30-day survival and time to liberation stratified by Dirichlet-multinomial-model (DMM) clusters for endotracheal aspirates (ETAs). P values were derived from the log-rank test, and hazard ratios (HRs) with corresponding 95% confidence intervals were derived from the Cox proportional hazard model adjusted for age, history of chronic obstructive pulmonary disease (COPD), diagnosis of acute respiratory distress syndrome, extrapulmonary sepsis, antibiotic administration before ICU admission, and antibiotic-exposure score in the ICU before sampling. (C and D) Kaplan-Meier curves for 30-day survival stratified by DMM clusters for oral swabs. HRs were adjusted for age, history of COPD, immunosuppression, antibiotic administration before ICU admission, and antibiotic-exposure score. (E and F) Kaplan-Meier curves for 30-day survival stratified by DMM clusters for ETA and oral-swab samples stratified in four categories: 1) both ETA and oral samples belonging to cluster 2 (n = 50), 2) cluster 2 in oral samples only (n = 34), 3) cluster 2 in ETA samples only (n = 13), and 4) neither oral nor ETA samples belonging to cluster 2 (n = 100). HRs were adjusted for age, history of COPD, diagnosis of acute respiratory distress syndrome, extrapulmonary sepsis, antibiotic administration before ICU admission, and antibiotic-exposure score.
Figure 4.
Figure 4.
The relative abundance of individual genera is associated with clinical outcomes and host-response subphenotypes. (A) Endotracheal aspirate (ETA) genera. We examined data for associations between additive log ratio–transformed relative abundance for the top 10 genera in each cluster (total of 18 unique genera), which are shown on the y-axis with three outcome variables: hyperinflammatory subphenotype, 30-day mortality (logistic regression models), and ventilator-free days (VFDs; linear regression model). Models were adjusted for age, chronic obstructive pulmonary disease, and antibiotic exposures. In each column, the direction of the effect size of the coefficient and the statistical significance for each genus–outcome association are visually represented by color coding (with protective effects shown in blue and adverse effects shown in red) and the size of each circle, respectively. Typical pathogenic genera in ETA samples (Staphylococcus, Pseudomonadaceae, and Enterobacteriaceae) were associated with higher odds of having the hyperinflammatory subphenotype classification and fewer VFDs in the case of Staphylococcus genera, whereas typical members of the normal lung microbiome (e.g., Prevotella_7 and Streptococcus) were associated with improved outcomes. (B) Oral-swab genera. Among the 14 unique genera examined in oral swabs, a high relative abundance of typical members of the normal lung microbiome (e.g., Prevotella_7, Streptococcus, Veillonella, Rothia, etc.) was associated with improved outcomes (mainly more VFDs). Associations that remained significant after adjustment for multiple testing with the Benjamini-Hochberg method are highlighted with asterisks (*adjusted P < 0.05). In the case of Pseudomonadaceae_unclassified, Enterobacteriaceae_unclassified, and Pasterellaceae_unclassified, classification to specific genera within these families was not accomplished, and we thus used family-level descriptors for these genera.
Figure 5.
Figure 5.
Patients with upper and lower respiratory tract dysbiosis have worse 30-day survival and longer time to liberation from mechanical ventilation. (A and B) Kaplan-Meier curves for 30-day survival and time to liberation stratified by the dysbiosis index (Shannon index ≥ 1.98 and protective-bacteria relative abundance ≥ 30%) for endotracheal aspirates (ETAs). P values were derived from the log-rank test, and hazard ratios (HRs) with corresponding 95% confidence intervals were derived from the Cox proportional hazard model adjusted for age, history of chronic obstructive pulmonary disease (COPD), diagnosis of acute respiratory distress syndrome, extrapulmonary sepsis, antibiotic administration before ICU admission, and antibiotic-exposure score in the ICU before sampling. (C and D) Kaplan-Meier curves for 30-day survival stratified by the dysbiosis index (Shannon index ≥ 1.98 and protective-bacteria relative abundance ≥ 70%) for oral swabs. HRs were adjusted for age, history of COPD, immunosuppression, antibiotic administration before ICU admission, and antibiotic-exposure score. (E and F) Kaplan-Meier curves for 30-day survival for ETA and oral-swab samples stratified in four categories: 1) both ETA and oral samples with dysbiosis (n = 34), 2) oral-swab samples with dysbiosis only (n = 28), 3) ETA samples with dysbiosis only (n = 28), and 4) neither oral nor ETA samples with dysbiosis (n = 110). HRs were adjusted for age, history of COPD, diagnosis of acute respiratory distress syndrome, extrapulmonary sepsis, antibiotic administration before ICU admission, and antibiotic-exposure score.

Comment in

References

    1. Matthay MA, McAuley DF, Ware LB. Clinical trials in acute respiratory distress syndrome: challenges and opportunities. Lancet Respir Med. 2017;5:524–534. - PubMed
    1. Meyer NJ, Calfee CS. Novel translational approaches to the search for precision therapies for acute respiratory distress syndrome. Lancet Respir Med. 2017;5:512–523. - PMC - PubMed
    1. Calfee CS, Delucchi K, Parsons PE, Thompson BT, Ware LB, Matthay MA NHLBI ARDS Network. Subphenotypes in acute respiratory distress syndrome: latent class analysis of data from two randomised controlled trials. Lancet Respir Med. 2014;2:611–620. - PMC - PubMed
    1. Bos LD, Schouten LR, van Vught LA, Wiewel MA, Ong DSY, Cremer O, et al. MARS consortium. Identification and validation of distinct biological phenotypes in patients with acute respiratory distress syndrome by cluster analysis. Thorax. 2017;72:876–883. - PMC - PubMed
    1. Famous KR, Delucchi K, Ware LB, Kangelaris KN, Liu KD, Thompson BT, et al. ARDS Network. Acute respiratory distress syndrome subphenotypes respond differently to randomized fluid management strategy. Am J Respir Crit Care Med. 2017;195:331–338. - PMC - PubMed

Publication types