Comparative Study
. 2020 Sep;17(9):1086-1095.
doi: 10.1016/j.jacr.2020.07.001. Epub 2020 Jul 9.

Early-Stage Radiology Volume Effects and Considerations with the Coronavirus Disease 2019 (COVID-19) Pandemic: Adaptations, Risks, and Lessons Learned

Affiliations
Comparative Study

Early-Stage Radiology Volume Effects and Considerations with the Coronavirus Disease 2019 (COVID-19) Pandemic: Adaptations, Risks, and Lessons Learned

Alexander M Norbash et al. J Am Coll Radiol. 2020 Sep.

Abstract

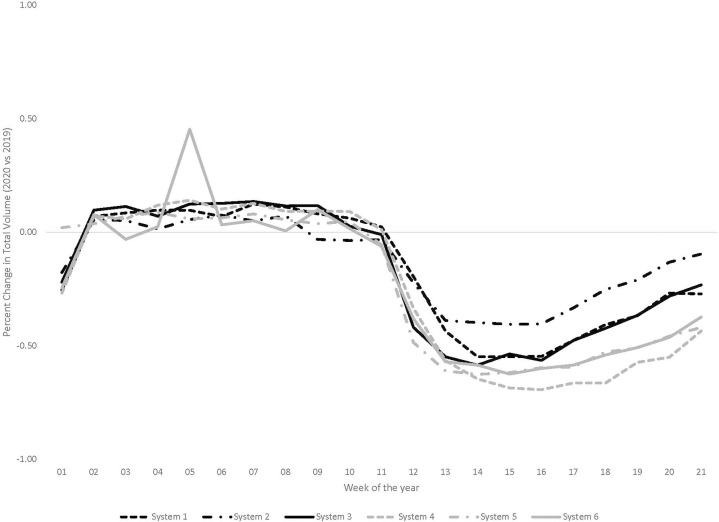
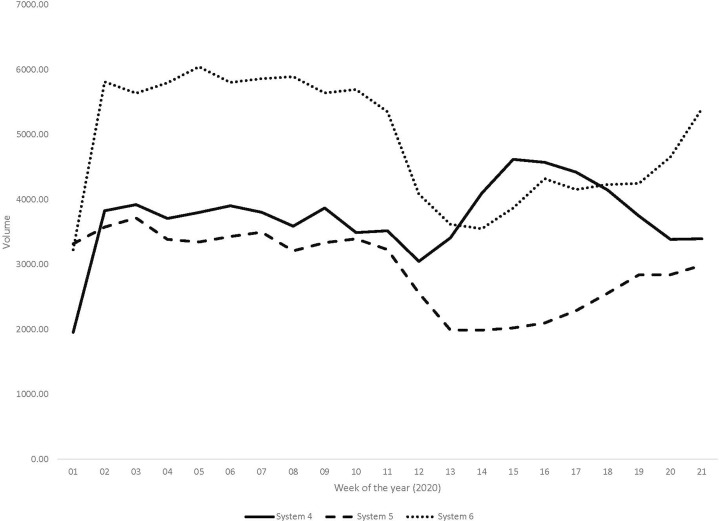
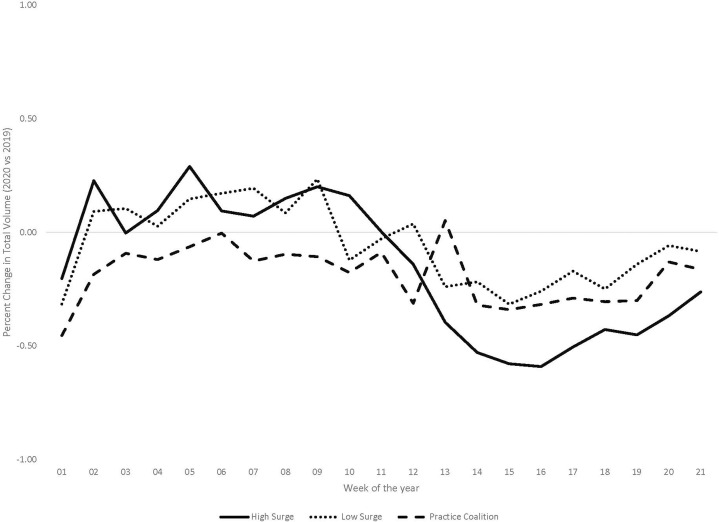
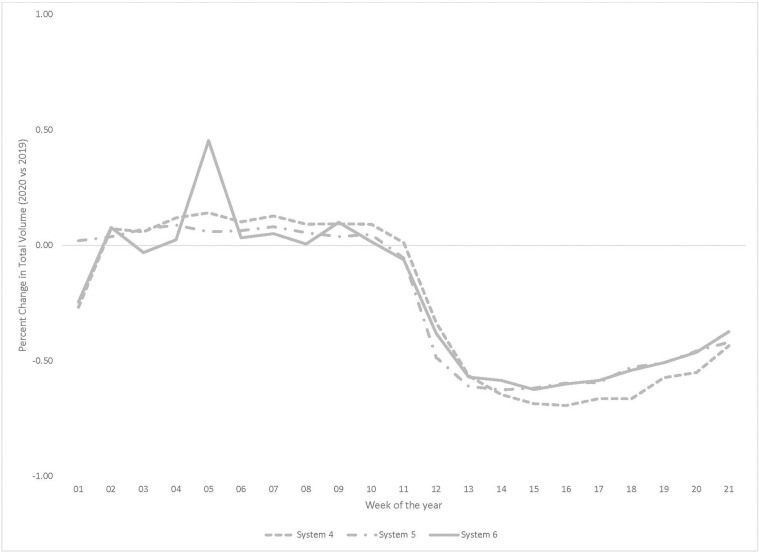
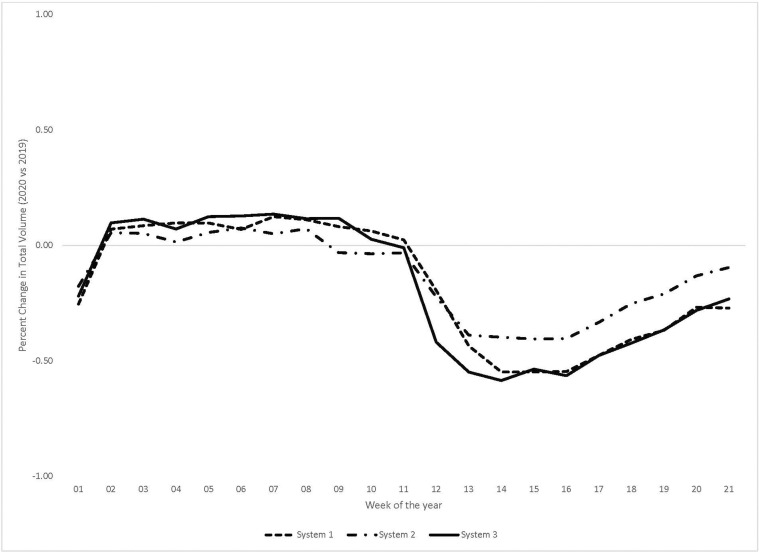
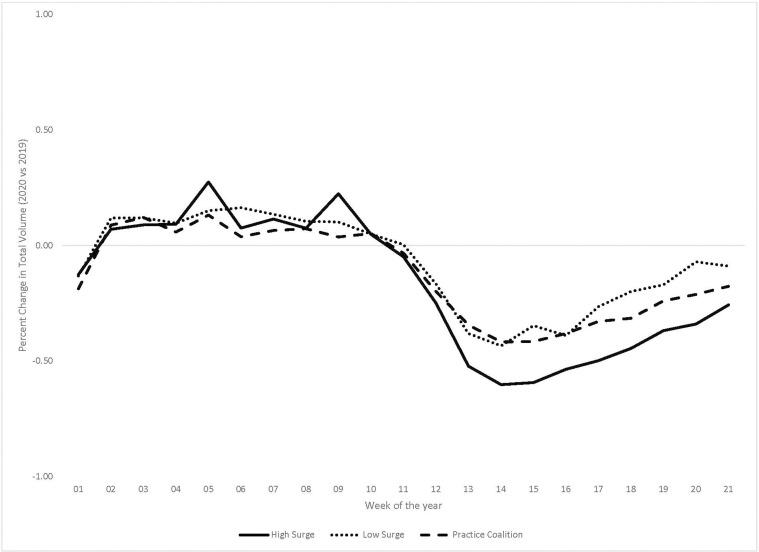
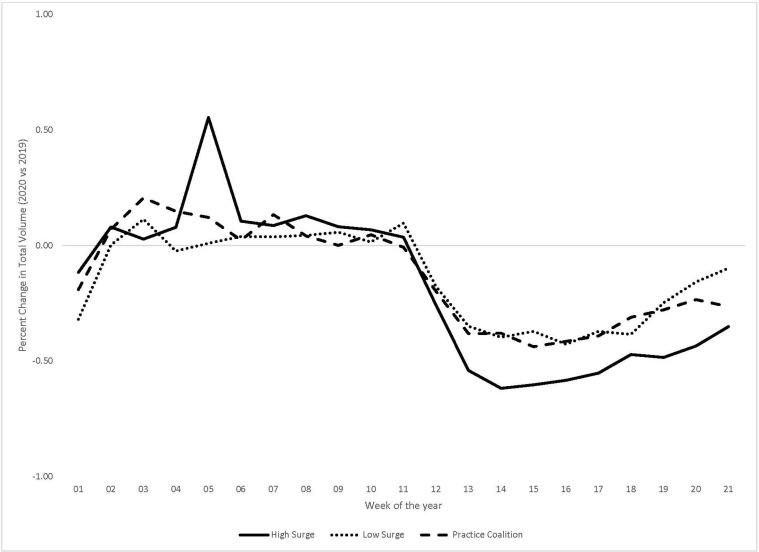
Objective: The coronavirus disease 2019 (COVID-19) pandemic resulted in significant loss of radiologic volume as a result of shelter-at-home mandates and delay of non-time-sensitive imaging studies to preserve capacity for the pandemic. We analyze the volume-related impact of the COVID-19 pandemic on six academic medical systems (AMSs), three in high COVID-19 surge (high-surge) and three in low COVID-19 surge (low-surge) regions, and a large national private practice coalition. We sought to assess adaptations, risks of actions, and lessons learned.

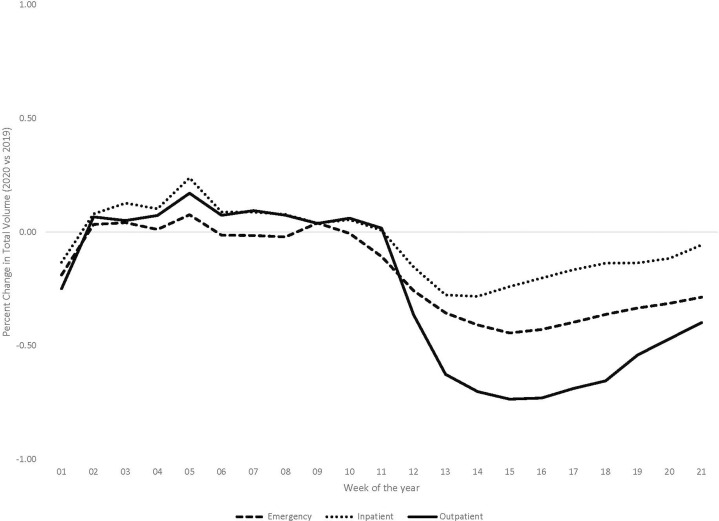
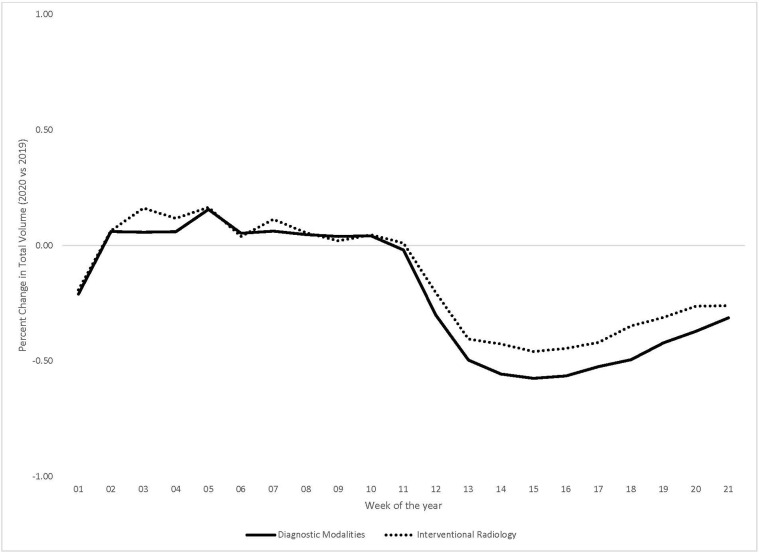
Methods: Percent change of 2020 volume per week was compared with the corresponding 2019 volume calculated for each of the 14 imaging modalities and overall total, outpatient, emergency, and inpatient studies in high-surge AMSs and low-surge AMSs and the practice coalition.

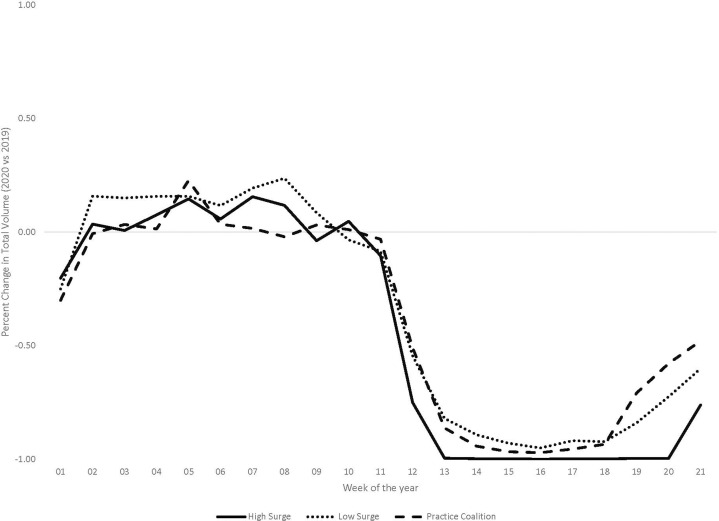
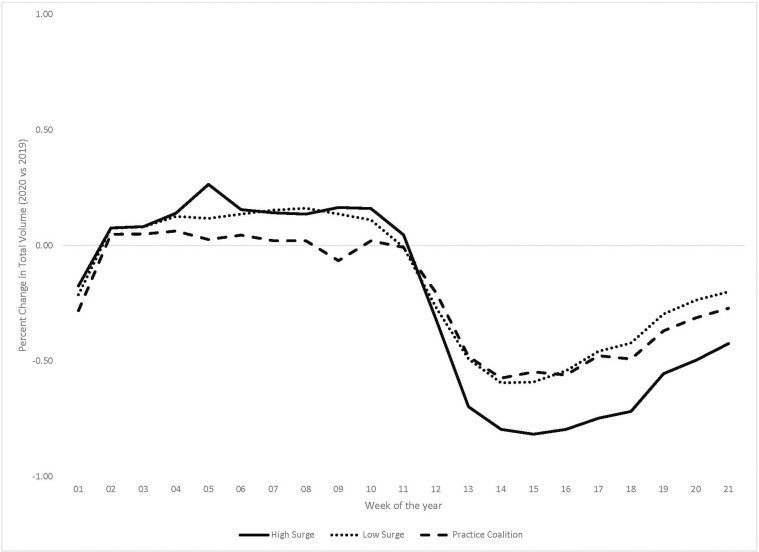
Results: Steep examination volume drops occurred during week 11, with slow recovery starting week 17. The lowest total AMS volume drop was 40% compared with the same period the previous year, and the largest was 70%. The greatest decreases were seen with screening mammography and dual-energy x-ray absorptiometry scans, and the smallest decreases were seen with PET/CT, x-ray, and interventional radiology. Inpatient volume was least impacted compared with outpatient or emergency imaging.

Conclusion: Large percentage drops in volume were seen from weeks 11 through 17, were seen with screening studies, and were larger for the high-surge AMSs than for the low-surge AMSs. The lowest drops in volume were seen with modalities in which delays in imaging had greater perceived adverse consequences.

Keywords: Adaptations; COVID-19; pandemic; recovery; volume.


Figures

Fig 1
Fig 1
Volumes of all radiology studies for 2020 calendar weeks 1 to 21 are depicted in this graph showing each of six academic medical systems (AMSs) compared against the prior year’s similar-interval volume as a result of the coronavirus disease 2019 pandemic. The AMSs include three low-surge AMSs (system 1, system 2, and system 3), and three high-surge AMSs (system 4, system 5, and system 6). The lowest-volume AMS, system 2, suffered the least drop in volume and most rapid approach to recovery, and the largest AMS, system 4, suffered the largest drop in volume.
Fig 2
Fig 2
Inpatient imaging volumes for each of three high-surge academic medical systems (AMSs) are shown. System 4 (solid line), the highest-surge AMS assessed in study, demonstrated a unique increase to supernormal volumes starting week 13, continuing to a new peak at 125% by week 15, with a return to normal levels by week 18. This is in contradistinction to AMS 5 (dashed line) and AMS 6 (dotted line), both of which experienced decreases. No other AMS or modality demonstrated a similar supernormal bump. This volume bump was presumably due to the high-magnitude coronavirus disease 2019 surge and the increased volume of inpatient work resulting from the large number of coronavirus disease 2019 inpatients.
Fig 3
Fig 3
Volumes for each of three sets of differentiated radiology studies, specifically emergency, outpatient, and inpatient studies, are depicted in this graph showing aggregated data from six academic medical systems (AMSs). The volume is measured against the prior year’s matched-period volume as a result of the coronavirus disease 2019 pandemic for emergency (dashed line), inpatient (dotted line), and outpatient (solid line) imaging studies. The greatest drop in volume was for outpatient studies, and the lowest drop in volume was for the inpatient studies. Both outpatient and inpatients studies demonstrated more rapid recovery slopes toward baseline than the emergency studies, which showed the slowest rate of return toward baseline.
Fig 4
Fig 4
PET/CT volumes are measured against the prior year’s matched-period volume as a result of the coronavirus disease 2019 pandemic for three high-surge academic medical systems (AMSs; solid line), three low-surge AMSs (dotted line), and a large national private practice coalition (dashed line). The greatest relative drop was seen by the high-surge AMSs, with the low-surge AMSs and the practice coalition showing similar relative drops in volume. PET/CT in the low-surge AMSs demonstrated the least decrease in volume of any modality. Presumably, this is in part related to the high volume of cancer patients undergoing PET/CT studies and patient intolerance for the effect that delays in care including delayed PET/CT imaging could potentially have on their survival.
Fig 5
Fig 5
Breast screening study volumes are measured against the prior year’s matched-period volume as a result of the coronavirus disease 2019 pandemic for three high-surge academic medical systems (AMSs; solid line), three low-surge AMSs (dotted line), and a large national private practice coalition (dashed line). Precipitous drops in volume were seen across the board in all three types of systems. Presumably, this is related to the screening or elective nature of such studies, in which delays in imaging, on the order of months, is likely seen to be of little medical consequence. The greatest delays in establishing a recovery slope was seen with high-surge AMSs, which showed an approximately 7-week period at nadir, before initiation of a recovery slope.
Supplementary Figure 1a
Supplementary Figure 1b
Supplementary Figure 2
Supplementary Figure 3
Supplementary Figure 4
Supplementary Figure 5

References

    1. Naidich J.J., Boltyenkov A., Wang J.J., Chusid J., Hughes D., Sanelli P.C. Impact of the COVID-19 pandemic on imaging case volumes. J Am Coll Radiol. 2020;17:865–872. - PMC - PubMed
    1. Stempniak M. 4 steps radiology providers can take to return from “COVID-19 induced imaging austerity.” Radiology Business. https://www.radiologybusiness.com/topics/healthcare-economics/jacr-radio... Available at: Published May 5, 20202. Accessed July 28, 2020.
    1. Page L. COVID-19: what will happen to physician income this year? Medscape. https://www.medscape.com/viewarticle/930434 Published May 13, 2020.Available at: Accessed July 28, 2020.
    1. Lee C.I., Raoof S., Patel S.B. Coronavirus disease 2019 (COVID-19) and your radiology practice: Case triage, staffing strategies, and addressing revenue concerns. J Am Coll Radiol. 2020;17:752–754. - PMC - PubMed
    1. Stempniak M. Cancer screenings drop upward of 94% during pandemic, with concerns of lingering sluggishness. https://www.radiologybusiness.com/topics/healthcare-economics/cancer-scr... Available at: Published May 4, 2020. Accessed July 28, 2020.

Publication types

MeSH terms