. 2020 Nov 10:448:300-310.
doi: 10.1016/j.neuroscience.2020.07.032. Epub 2020 Jul 25.

Effect of Aging on Daily Rhythms of Lactate Metabolism in the Medial Prefrontal Cortex of Male Mice

Affiliations

Effect of Aging on Daily Rhythms of Lactate Metabolism in the Medial Prefrontal Cortex of Male Mice

Naomi K Wallace et al. Neuroscience. .

Abstract

Aging is associated with reduced amplitude and earlier timing of circadian (daily) rhythms in sleep, brain function, and behavior. We examined whether age-related circadian dysfunction extends to the metabolic function of the brain, particularly in the prefrontal cortex (PFC). Using enzymatic amperometric biosensors, we recorded lactate concentration changes in the PFC in Young (7 mos) and Aged (19 mos) freely-behaving C57BL/6N male mice. Both Young and Aged mice displayed diurnal and circadian rhythms of lactate, with the Aged rhythm slightly phase advanced. Under constant conditions, the Aged rhythm showed a reduced amplitude not seen in the Young mice. We simultaneously observed a relationship between arousal state and PFC lactate rhythm via electroencephalography, which was modified by aging. Finally, using RT-qPCR, we found that aging affects the daily expression pattern of Glucose Transporter 1 (GLUT-1).

Keywords: biosensor; circadian; neurometabolism; sleep; solute transporters.


Conflict of interest statement

Competing Interests Statement

The authors report no competing interests.

Figures

Fig.1.
Fig.1.
Some measures of sleep fragmentation are affected by aging. A. The number of bouts of each state over 24h is not significantly different between Control and Aged mice (two-way ANOVA, sleep state, p<0.0001; group, p=0.0052; interaction, p=0.1233; Tukey’s multiple comparisons test; Wake, p=0.1864; NREM, p=0.0922; REM, p>0.9999). B. The average length of NREM bouts over 24h is affected by age (Two-way ANOVA; light condition, p=0.1113; age, p=0.0409; interaction, p=0.2686), but comparisons between Control and Aged mice within light conditions were not significant (Tukey’s multiple comparisons test; LD, p=0.1092; DD, p=0.8952). C. During LD (but not DD), Aged mice have a higher percentage of bouts that are less than one minute in length (Two-way ANOVA; light, p=0.0347; age, p=0.0042; interaction, p=0.1299; Tukey’s multiple comparisons test; LD, p=0.0043; DD, p=0.4958). D. There are no statistically significant differences in the percentage of bouts longer than or equal to five minutes (Two-way ANOVA, light p=0.0608 age, p=0.1887; interaction, p=0.6985). Error bars = SEM.
Fig.2.
Fig.2.
Aging affects the time spent in sleep states. A. Over both light and dark periods, Aged mice spend significantly less time awake and more time in NREM than Control mice (Two-way ANOVA, sleep state, p<0.0001; age, p=0.6910; interaction, p<0.0001; Sidak’s multiple comparisons test; Wake, p=0.0008; NREM, p=0.0045; REM, p=0.9988). B. There was no significant effect of Age in the light phase (Two-way ANOVA; sleep state, p<0.0001; age, p=0.9988; interaction, p=0.0123; Sidak’s multiple comparisons test; Wake, p=0.1279; NREM, p=0.0726; REM, p=0.9922). C. The overall differences were driven by differences during the Dark period (Two-way ANOVA; sleep state, p<0.0001; age, p=0.5725; interaction, p<0.0001; Sidak’s multiple comparisons test; Wake, p=0.0002; NREM, p=0.0040; REM, p>0.9999). Error bars = SEM.
Fig.3.
Fig.3.
A circadian rhythm of extracellular lactate is present in the PFC, and this rhythm is affected by Aging and exposure to constant darkness (DD). A. Across 48h in a 12:12 LD cycle, Control mice (n= 8) displayed a rhythm of extracellular lactate (cosinor analysis; amplitude= 0.007758, acrophase= 19.922). B. Aged mice (n= 9) in a 12:12 LD cycle also displayed a rhythm (amplitude= 0.007888, acrophase= 17.55). The amplitude of Control and Aged rhythms was not significantly different (cosinor analysis with F test; p=0.9303), however the acrophase was significantly phase advanced by Aging (cosinor analysis with F test; p=0.0012). C. A separate cohort of mice were housed as previously, but after the first light cycle, the lights were turned off at ZT12 and did not come back on for the remainder of the experiment. Across 48h, Control mice (n= 7) continued to display a significant rhythm of extracellular lactate (amplitude= 0.006564, acrophase=18.403). For Control mice, exposure to DD did not result in significant changes to the amplitude or acrophase (cosinor analysis with F test; amplitude, p=0.3513; acrophase, p=0.0716). D. Aged mice (n= 10) continued to display a lactate rhythm in DD (amplitude= 0.004072; acrophase= 16.39). Under DD conditions, just like in LD conditions, the amplitude did not differ between Control and Aged groups (cosinor with F test; amplitude, p=0.0613) but the acrophase of the Aged mice was significantly phase advanced as compared to controls (cosinor analysis with F test; acrophase, p=0.0405). Under DD conditions, the amplitude of the Aged rhythm was significantly blunted as compared to Aged LD (cosinor with F test; amplitude, p=0.0032). There was no significant difference in the acrophase of Aged LD and Aged DD (cosinor with F test; acrophase, p=0.2054). Acrophases calculated by cosinor analysis are presented in ZT. Due to artifacts caused by a computer failure, some data points were removed from the graphs (see Methods for specifics). Error bars = SEM.
Fig.4.
Fig.4.
The relationship between sleep state and lactate is modified by Aging and exposure to constant darkness (DD). A. During NREM sleep, lactate levels fall in both groups (Control n=8, Aged n=9). There is no significant difference in the slope (beta coefficient) between Aged and Control mice in LD conditions (p=0.1576, 95% CI of Control slope = −0.2974 to −0.2099; 95% CI of Aged slope = −0.3244 to −0.2595). B. In DD during NREM sleep, lactate levels still fall in both groups. There is a significant difference in the slope between Control (n=7) and Aged (n=9) mice (p<0.0001; 95% CI of Control slope = −0.3128 to −0.2686; 95%CI of Aged slope = −0.4249 to −0.3527). C. During Wake, lactate levels rise in both groups. There is a significant difference in the Wake slope between Control and Aged mice under LD conditions (p=0.0006; 95% CI of Control slope = 0.09664 to 0.1784; 95% CI of Aged slope = 0.1997 to 0.2899). D. In DD, both groups continue to show an increase in lactate during Wake. Under DD conditions, the lactate slope of Control and Aged mice is not significantly different (p=0.9779, 95% CI of Control = 0.1629 to 0.2191; 95% CI of Aged = 0.1314 to 0.2488). Shading = SEM.
Fig.5.
Fig.5.
Lactate dehydrogenase enzyme transcripts are not strongly rhythmic. A. In Control mice (n=4/time), the expression of LDHA mRNA appears dynamic, while in the Aged mice it remains similar throughout the day (n= 5/time). This result was not statistically significant (Interaction p= 0.1369). B. There does not appear to be a diurnal pattern of LDHB mRNA expression in either Control or Aged mice. Error bars = SEM.
Fig.6.
Fig.6.
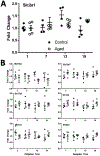
The daily expression pattern of Slc2a1 mRNA is affected by aging. A. The expression of Slc2a1 mRNA (Glucose Transporter 1) in Aged mice (n= 5/time) is significantly different from Controls (Control n= 4/time, Interaction p= 0.0438). B. Other solute transporters have statistically non-significant, but potentially biologically relevant, differences in their daily gene expression pattern as a result of increased age. Error bars = SEM.

Comment in

References

    1. Attwell D, & Laughlin SB (2001). An Energy Budget for Signaling in the Grey Matter of the Brain. Journal of Cerebral Blood Flow & Metabolism, 21(10), 1133–1145. 10.1097/00004647-200110000-00001 - DOI - PubMed
    1. Baud MO, Magistretti PJ, & Petit J-M (2015). Sustained Sleep Fragmentation Induces Sleep Homeostasis in Mice. Sleep, 38(4), 567–579. 10.5665/sleep.4572 - DOI - PMC - PubMed
    1. Bélanger M, Allaman I, & Magistretti PJ (2011a). Brain Energy Metabolism: Focus on Astrocyte-Neuron Metabolic Cooperation. Cell Metabolism, 14(6), 724–738. 10.1016/j.cmet.2011.08.016 - DOI - PubMed
    1. Bélanger M, Allaman I, & Magistretti PJ (2011b). Brain Energy Metabolism: Focus on Astrocyte-Neuron Metabolic Cooperation. Cell Metabolism, 14(6), 724–738. 10.1016/j.cmet.2011.08.016 - DOI - PubMed
    1. Bergersen LH (2007). Is lactate food for neurons? Comparison of monocarboxylate transporter subtypes in brain and muscle. Neuroscience, 145(1), 11–19. 10.1016/j.neuroscience.2006.11.062 - DOI - PubMed

Publication types