. 2020 Oct;586(7827):80-86.
doi: 10.1038/s41586-020-2579-z. Epub 2020 Jul 27.

Genome-wide detection of tandem DNA repeats that are expanded in autism

Affiliations

Genome-wide detection of tandem DNA repeats that are expanded in autism

Brett Trost et al. Nature. 2020 Oct.

Abstract

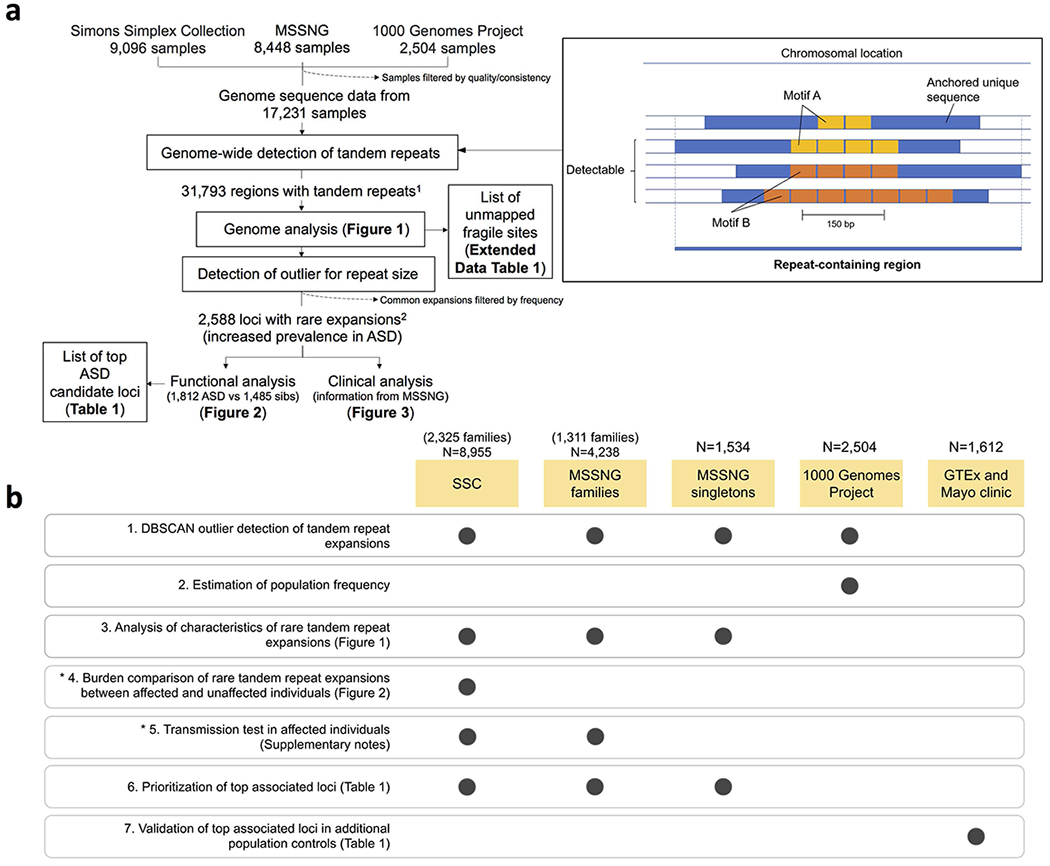
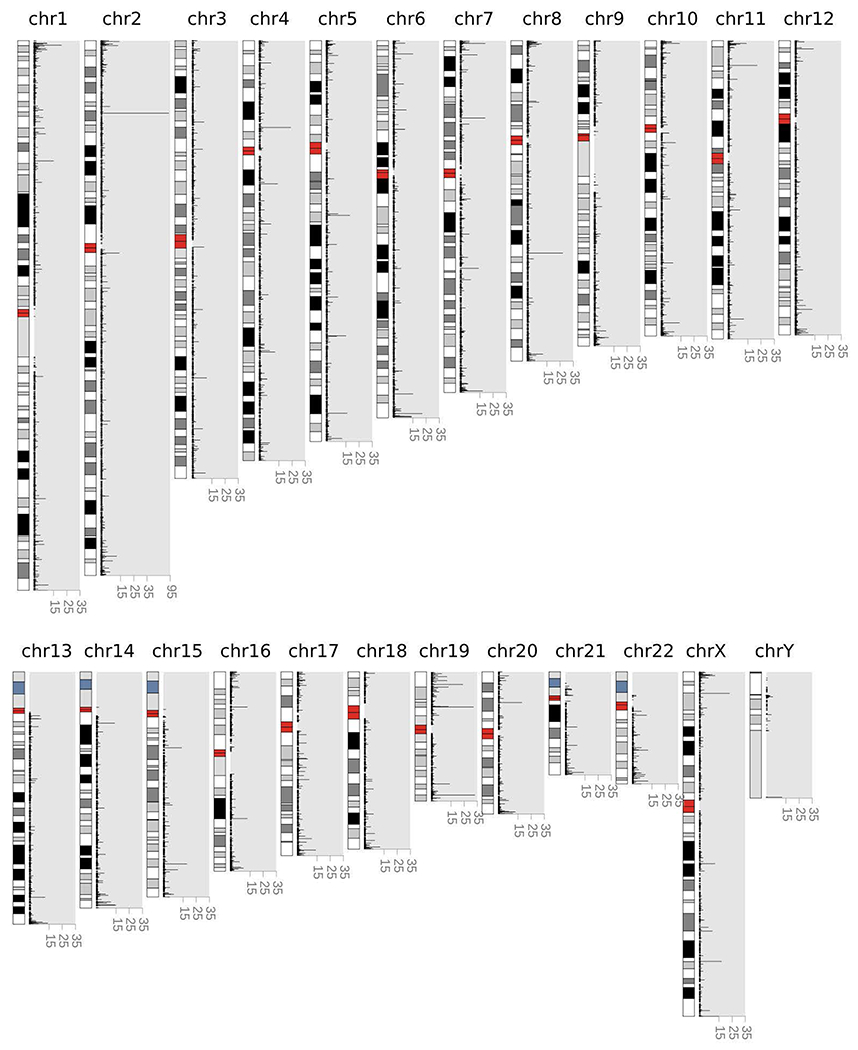
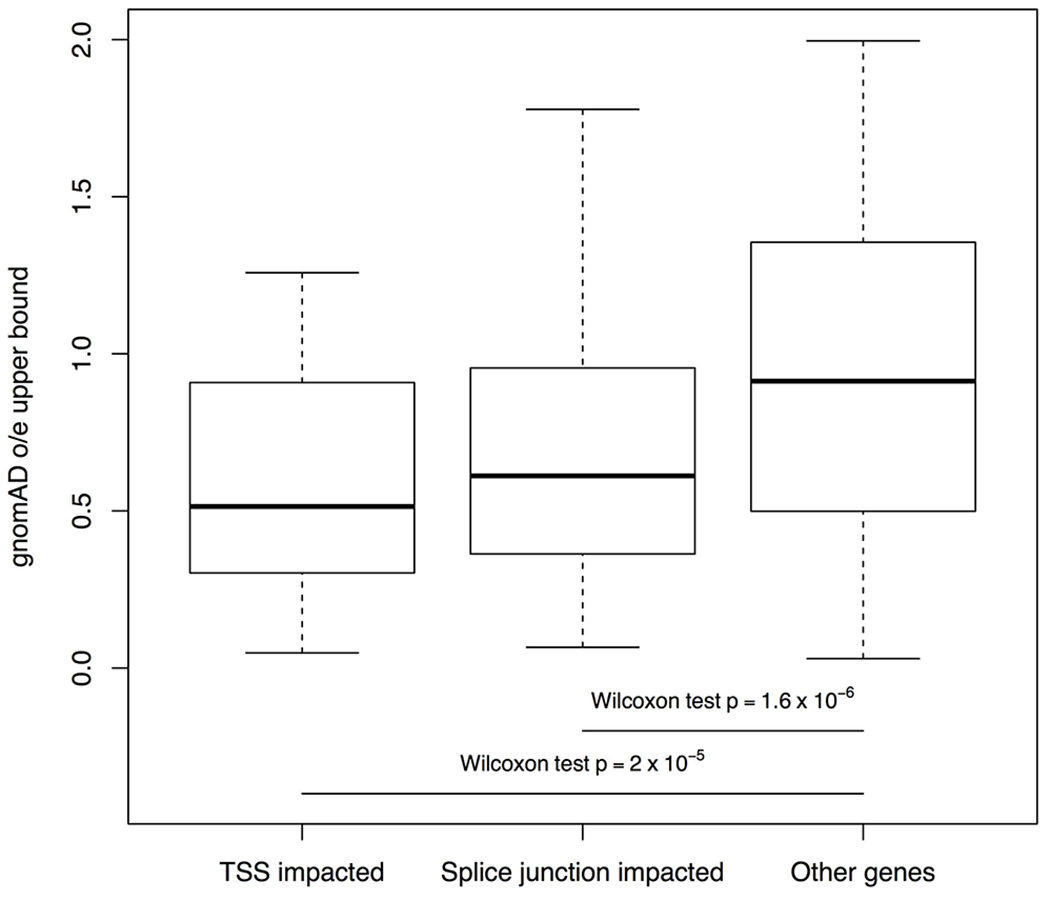
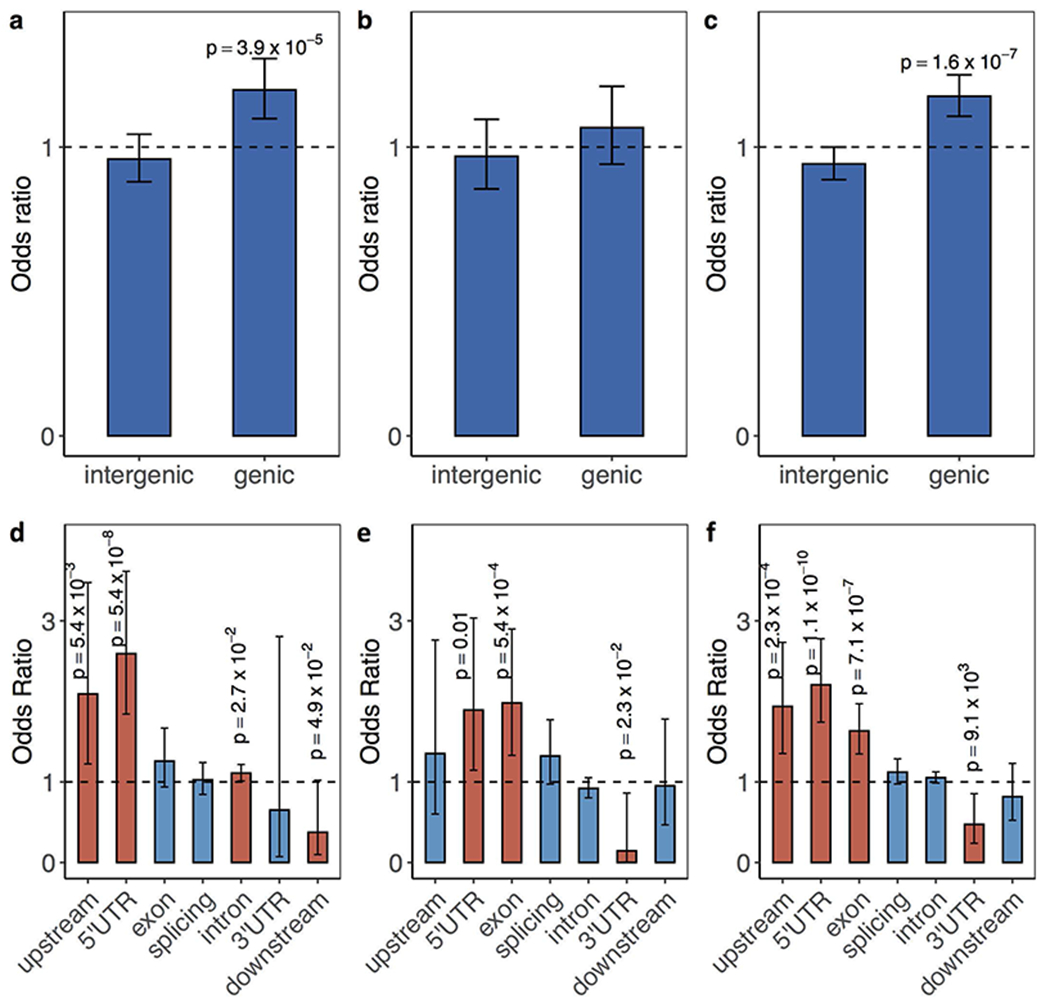
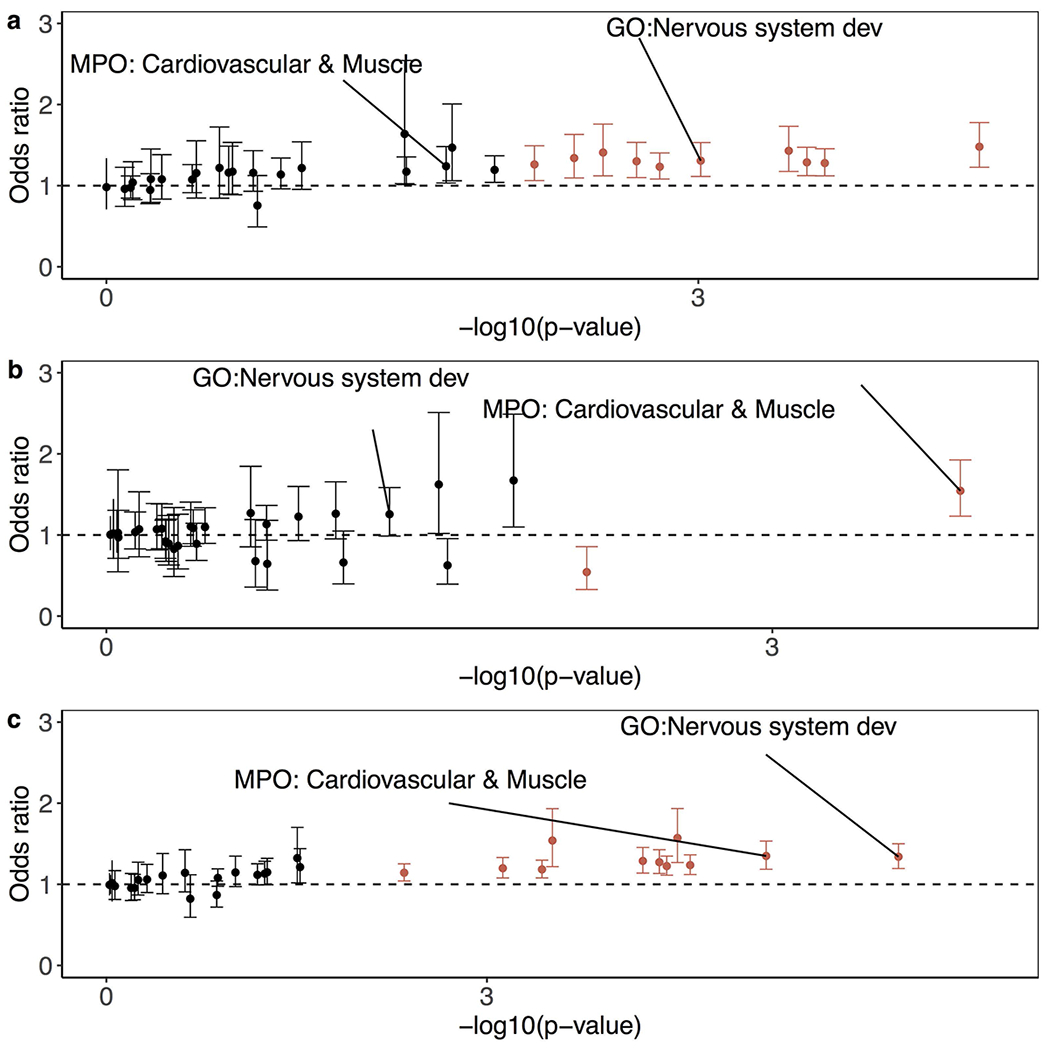
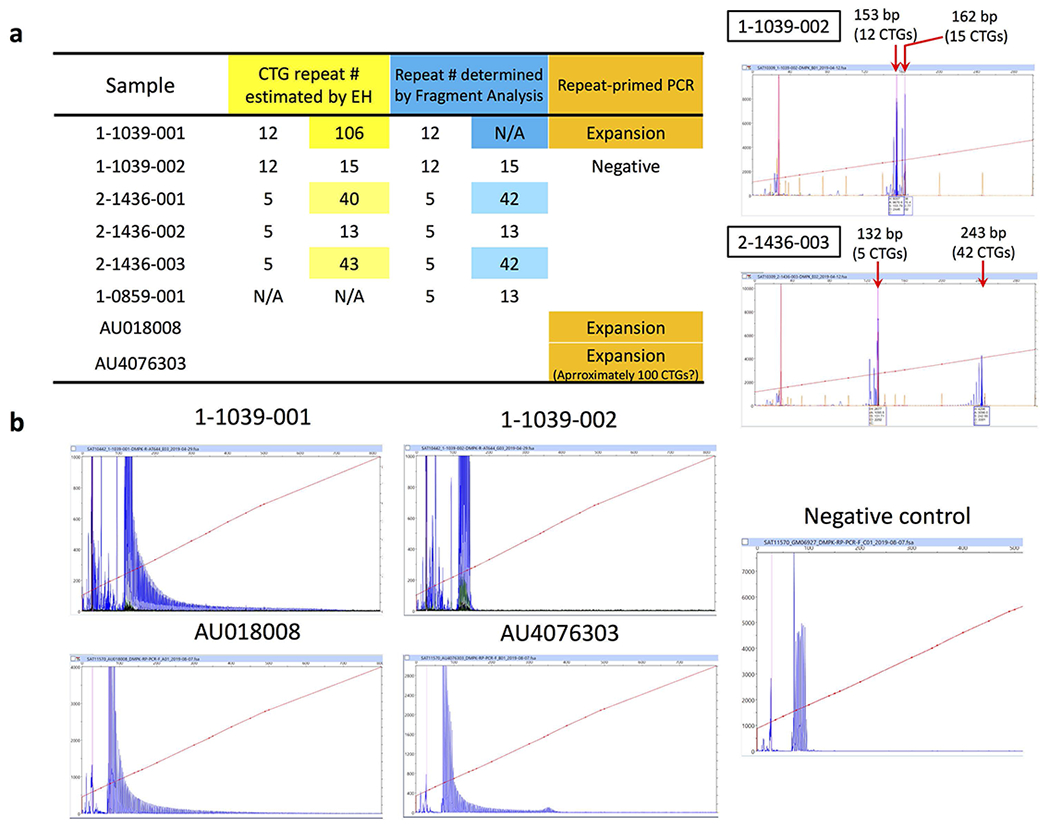
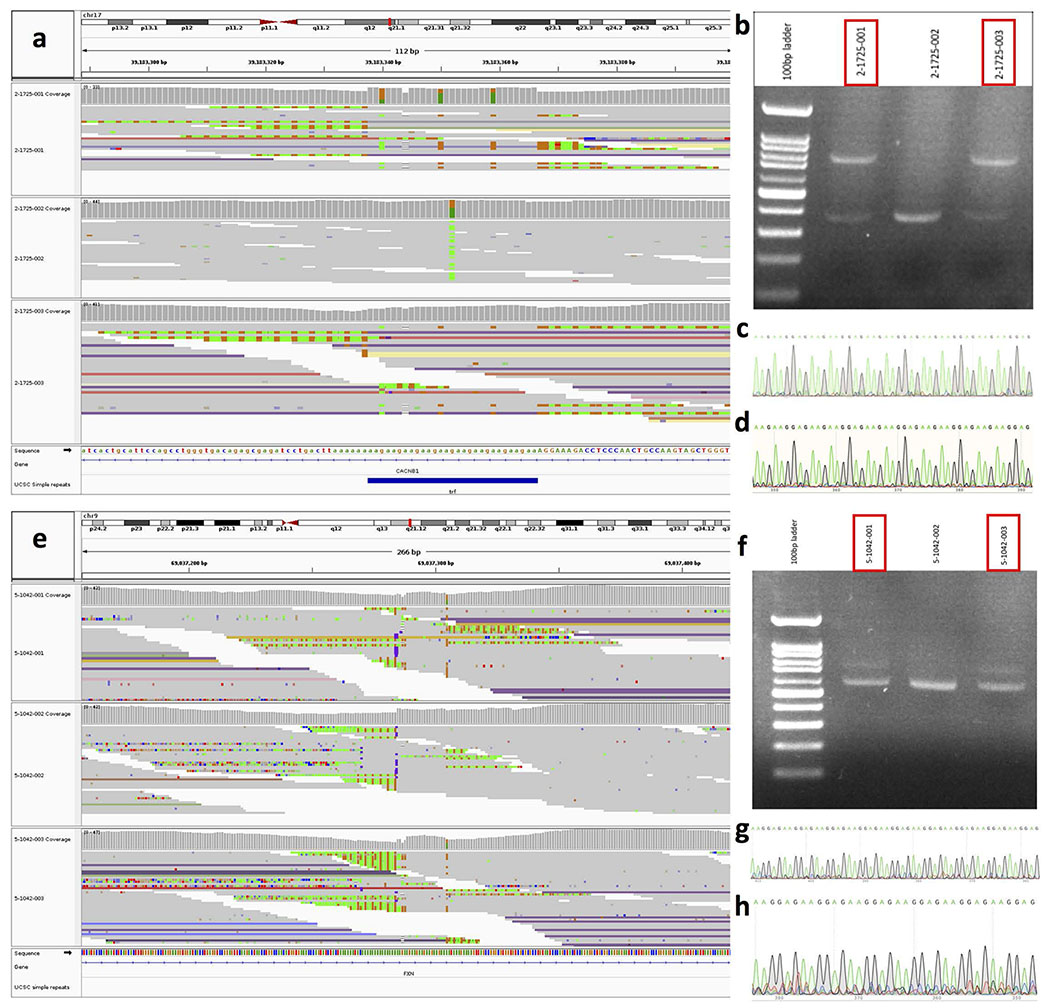
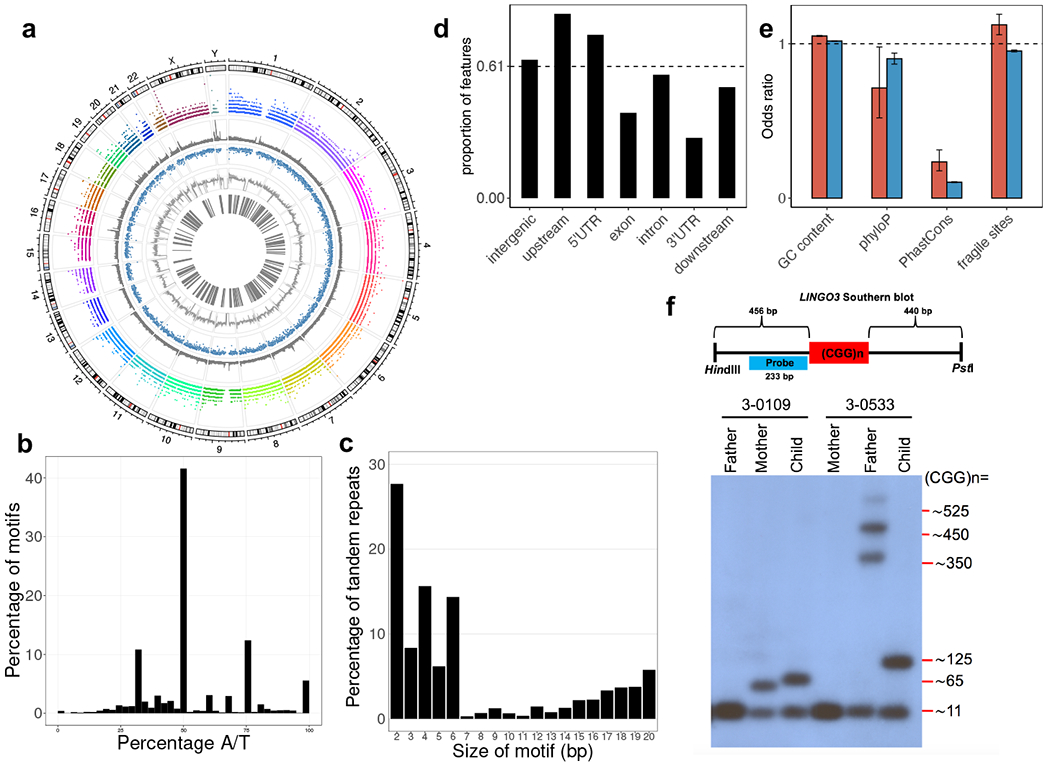
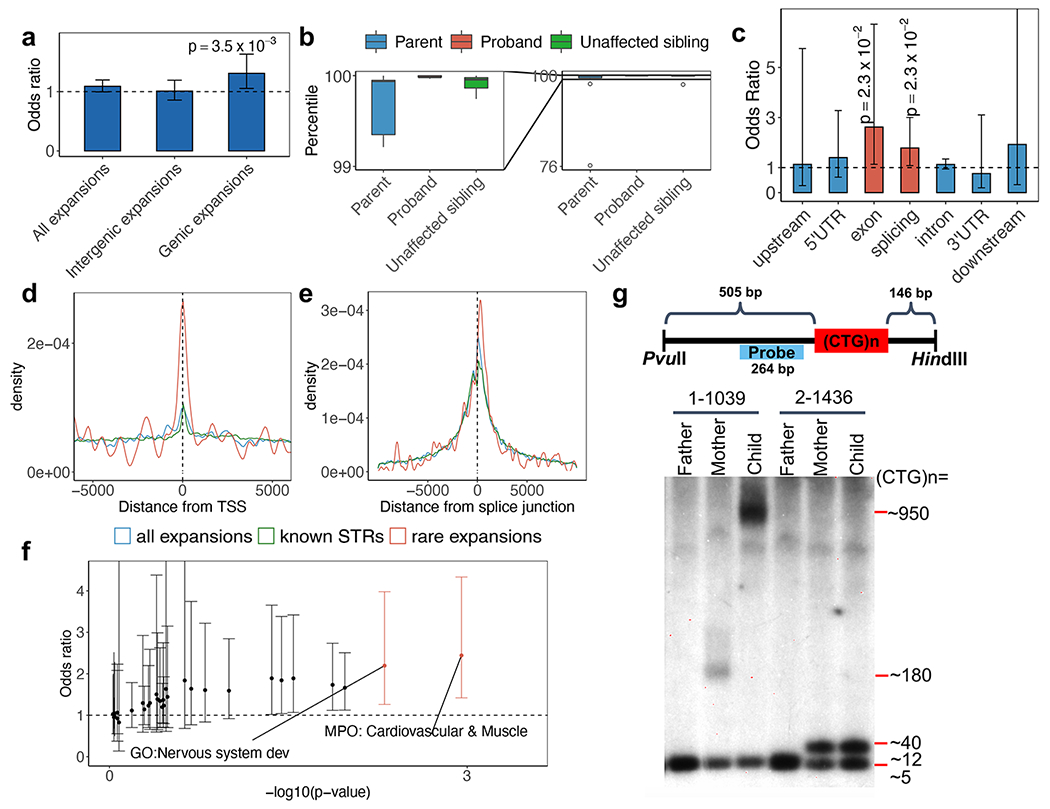
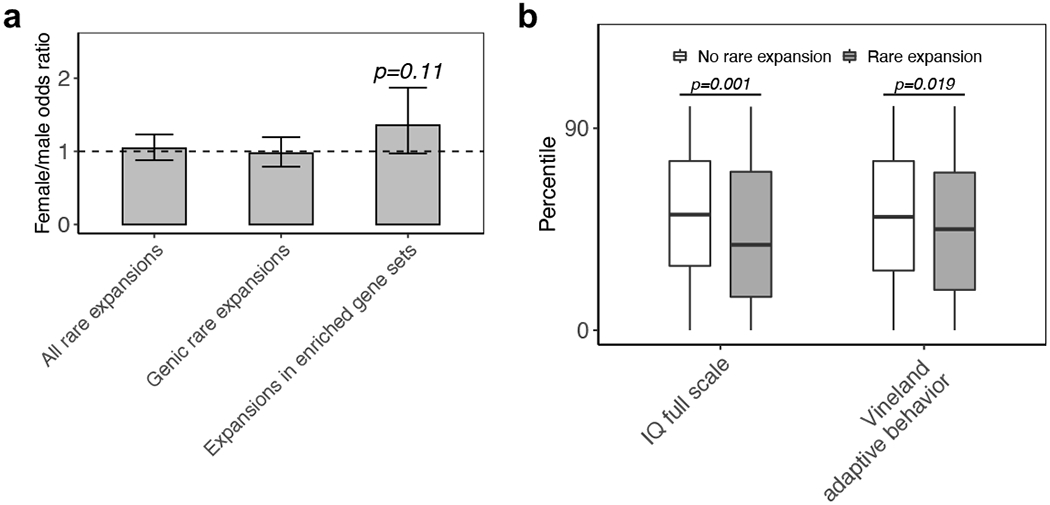
Tandem DNA repeats vary in the size and sequence of each unit (motif). When expanded, these tandem DNA repeats have been associated with more than 40 monogenic disorders1. Their involvement in disorders with complex genetics is largely unknown, as is the extent of their heterogeneity. Here we investigated the genome-wide characteristics of tandem repeats that had motifs with a length of 2-20 base pairs in 17,231 genomes of families containing individuals with autism spectrum disorder (ASD)2,3 and population control individuals4. We found extensive polymorphism in the size and sequence of motifs. Many of the tandem repeat loci that we detected correlated with cytogenetic fragile sites. At 2,588 loci, gene-associated expansions of tandem repeats that were rare among population control individuals were significantly more prevalent among individuals with ASD than their siblings without ASD, particularly in exons and near splice junctions, and in genes related to the development of the nervous system and cardiovascular system or muscle. Rare tandem repeat expansions had a prevalence of 23.3% in children with ASD compared with 20.7% in children without ASD, which suggests that tandem repeat expansions make a collective contribution to the risk of ASD of 2.6%. These rare tandem repeat expansions included previously undescribed ASD-linked expansions in DMPK and FXN, which are associated with neuromuscular conditions, and in previously unknown loci such as FGF14 and CACNB1. Rare tandem repeat expansions were associated with lower IQ and adaptive ability. Our results show that tandem DNA repeat expansions contribute strongly to the genetic aetiology and phenotypic complexity of ASD.


Figures

Extended Data Figure 1 |
Extended Data Figure 1 |. Study design.
a, Schematic workflow of the tandem repeat detection and analyses. 1Tandem repeats here are defined as those with 2–20 bp repeat motifs that span at least 150 bp. 2Rare expansions here are defined as tandem repeat expansions that are outliers according to size and occur in <0.1% of population controls from the 1000 Genomes Project. Note that ExpansionHunter Denovo only approximates the size and location of a given tandem repeat; thus, we use the term “region” to refer to a genomic segment detected in this way, and reserve “location” or “locus” for sites that have been more precisely mapped. b, Genome sequencing cohorts used for each analysis performed in this study. Numbers above each cohort represent the number of samples remaining after curation (Supplementary Notes).
Extended Data Figure 2 |
Extended Data Figure 2 |. Distribution of the number of tandem repeats detected by ExpansionHunter Denovo.
The number of tandem repeats detected by ExpansionHunter Denovo in a given sample is stratified by: a, cohort, sequencing platform, and DNA library preparation method (N=2,504, 594, 1,220, 6,634, and 9,096 for 1000G/Illumina NovaSeq/PCR-free, MSSNG/Illumina HiSeq 2000 or 2500/PCR-based, MSSNG/Illumina HiSeq X/PCR-based, MSSNG/Illumina HiSeq X/PCR-free, and SSC/Illumina HiSeq X/PCR-free, respectively), and b, predicted ancestry for samples in the “MSSNG/Illumina HiSeq X/PCR-free” category (N=157, 301, 247, 287, 4,841, 687, and 114 for ADMIXED, AFR, AMR, EAS, EUR, OTH, and SAS, respectively). Ancestry designations were derived from the 1000 Genomes “super populations” (https://www.internationalgenome.org/category/population): AFR, African; AMR, Admixed American; EAS, East Asian; EUR, European; OTH, other; SAS, South Asian. The centre of each boxplot indicates the median, the lower and upper hinges correspond to the first and third quartiles, and the minima and maxima are 1.5× the inter-quartile range below or above the median, respectively.
Extended Data Figure 3 |
Extended Data Figure 3 |. Tandem repeat detection quality control.
Histogram and normal QQ-plot of the number of tandem repeats detected by ExpansionHunter Denovo for a, all samples, b, samples for which the number of tandem repeats was within mean ± 2*SD, and c, samples for which the number of tandem repeats was within mean ± 3*SD. Of the 3 distributions, c is closest to the normal distribution.
Extended Data Figure 4 |
Number of unique motifs (y-axis) in each repeat-containing region (x-axis).
Extended Data Figure 5 |
Extended Data Figure 5 |. Distributions of GnomAD gene constraints.
The distributions of GnomAD observed/expected (o/e) upper bounds are shown for genes with rare tandem repeat expansions near transcription start sites (TSS, N=32 genes) and splice junctions (N=80 genes), compared to other genes (N=19,567 genes) (one-sided Wilcoxon rank sum test). The minima and maxima indicate 3×inter-quartile range-deviated o/e upper bounds from the median, and the centre indicates the median of the o/e upper bounds.
Extended Data Figure 6 |
Extended Data Figure 6 |. Transmission tests.
a-c, Odds ratios calculated as ratios of the transmission events of genic large tandem repeats and those in intergenic regions. Only affected individuals with European ancestry in a, SSC (N=1,808), b, MSSNG (N=2,010) and c, both SSC and MSSNG (N=3,818) were considered. d-f, Odds ratios calculated as ratios of the transmission events of large tandem repeats (99th percentile of length distribution) in a particular functional element to those in intergenic regions. Only affected individuals of European ancestry in d, SSC, e, MSSNG and f, both SSC and MSSNG were considered. Fisher’s exact test was applied to estimate the odds ratios and 95% confidence intervals indicated by error bars.
Extended Data Figure 7 |
Extended Data Figure 7 |. Transmission gene set enrichment.
Odds ratios calculated as ratios of the transmission events of large tandem repeats (99th percentile of length distribution) in particular gene sets to those in intergenic regions. Only affected individuals of European ancestry in a, SSC (N=1,808), b, MSSNG (N=2,010), and c, both SSC and MSSNG (N=3,818) were considered. Gene sets that were enriched from burden analysis of rare tandem repeat expansions between ASD-affected children and unaffected siblings in SSC are labelled. Red bars indicate significant enrichment in ASD-affected individuals (family-wise error rate < 25%). Fisher’s exact test was applied to estimate the odds ratios and 95% confidence intervals indicated by error bars.
Extended Data Figure 8 |
Extended Data Figure 8 |. Methods for sizing of the CTG repeat in DMPK.
a, While short CTG repeats were correctly sized by ExpansionHunter (the results were perfectly matched with fragment analysis), slight discrepancies were observed in the estimates for premutation alleles between ExpansionHunter and PCR-based fragment analysis. Note that the length of the premutation CTG repeats (42 CTGs) was close to the read length of the HiSeq X platform (150 bp). b, Predictions of the presence of longer CTG repeats were validated by repeat-primed PCR, although the estimated size by ExpansionHunter was shown to be an underestimate (the saw-tooth pattern of repeat-primed PCR extended longer than the predicted size). Repeat-primed PCR experiments were consistently reproduced at least three times for the large expansions. Repeat sizing experiments of PCR-amplifiable samples were consistently reproduced at least twice.
Extended Data Figure 9 |
Extended Data Figure 9 |. Validation of tandem repeats detected by EHdn.
a and e, Integrative Genomics Viewer read pile-up showing the reads aligning to the loci in CACNB1 and FXN in two families where tandem repeat expansions were detected in the child (bottom panels). In both families, the expansion is transmitted from the mother to the child (samples highlighted in red). b and f, Image of the gel-electrophoresis showing two bands corresponding to the expanded and unexpanded allele in the mother and child. The father has only the unexpanded allele. Results from PCR and gel electrophoresis were consistently reproduced at least twice for CACNB1 and FXN loci (see Supplementary Figures). c and g, Chromatogram of the Sanger sequencing of the expanded non-reference tandem repeat in the mother. d and h, Chromatogram of the Sanger sequencing of the expanded non-reference tandem repeat in the child. Sanger sequencing was performed using the DNA of the expanded alleles extracted from the gels.
Fig. 1 |
Fig. 1 |. Genome analysis of tandem repeats.
a, Circos plot showing the genomic distributions (1st layer) of 31,793 regions with tandem repeats (2nd layer), known simple sequence repeat regions (3rd layer), sequence conservation (4th layer), GC content (5th layer), and known fragile sites (6th layer). b, Nucleotide composition of the tandem repeats detected. c, Distribution of repeat unit (motif) sizes for the tandem repeats detected. d, Proportion of genic features overlapped by the tandem repeats detected. The proportion is derived from the size of tandem repeats over the total size of each genic feature. Dashed line indicates genome-average level. e, Correlation analysis between tandem repeats and different genomic features in a. By binning the genome into 1 kb windows, we tested the correlation/enrichment of different genomic features and the tandem repeats by regressing a genomic feature on the number of tandem repeats found per window. The odds ratios were derived from the logistic regression coefficients of the genomic features. Red bars represent tandem repeats detected (N=31,793 tandem repeat loci), while blue bars represent known simple sequence repeats (N=1,031,708 known short tandem repeats). Error bars indicate 95% confidence intervals. f, Validation of variable size in a tandem repeat detected. Schematic diagram (top) shows the design of a Southern blotting experiment in the targeted repeat in LINGO3, which overlaps with the location of fragile site FRA19B. Two families with different repeat sizes (3-0109 and 3-0533) are shown. In family 3-0533, the allele of size ~125 CGG repeats in the child appears to be a contraction of the father’s expanded allele, which displays multiple bands varying in repeat size (~350, ~450, and ~525 CGG repeats). Repeat length validation experiments for LINGO3 were consistently reproduced at least 3 to 5 times (see Supplementary Figure 8).
Fig. 2 |
Fig. 2 |. Functional analysis of rare (<0.1% frequency in 1000G) tandem repeat expansions.
a, Burden comparison of all rare expansions, intergenic rare expansions, and genic rare expansions. Odds ratio is for ASD-affected individuals (N=1,812) compared with their unaffected siblings (N=1,485). The trend for genic expansions is preserved regardless of the frequency threshold used to define a tandem repeat expansion as rare in population controls (Supplementary Table 10). b, Repeat size distribution in probands, their parents, and their unaffected siblings, where the probands have rare tandem repeat expansions (N=10 families). The diagram on the left shows a zoomed-in view of the repeat-size distribution between the 99th and 100th percentile. The minima and maxima indicate 3×inter-quartile range-deviated tandem repeat size from the median, and the centre indicates the median of the tandem repeat size. c, Rare tandem repeat expansion burden in different genomic features. Red bars indicate significant enrichment in ASD-affected individuals (family-wise error rate; FWER < 20%). The horizontal dashed line represents odds ratio=1. An ANOVA test comparing two logistic regression models was used to obtain the results in b and c. d-e, Distance of rare tandem repeat expansions (all individuals), all tandem repeats detected, and known simple sequence repeats to the nearest transcription start site (TSS) (d) and the nearest splice junction (e). Rare tandem repeat expansions (N=258 loci close to TSS and N=297 loci close to splice junctions) are significantly closer to TSS (Wilcoxon test, p=0.01 and 0.003 for all tandem repeats detected (N=5,805 loci) and known simple sequence repeats (N=133,264 loci), respectively) and splice junctions (Wilcoxon test, p=0.03 and 0.002 for all tandem repeats detected (N=7,279 loci) and known simple sequence repeats (N=161,932 loci), respectively). f, Gene set burden analysis of number of rare tandem repeat expansions affecting genes in a gene set comparing ASD-affected individuals (N=1,812) with their unaffected siblings (N=1,485). Orange points indicate odds ratios of gene-sets with FWER < 20%. g, Schematic diagram (top) shows the design of a Southern blotting experiment in the targeted tandem repeat in DMPK. Two families with different repeat sizes (1-1039 with expansions and 2-1436 without expansions) are shown. Repeat length validation experiments for DMPK were consistently reproduced at least 3 to 5 times (see Supplementary Figure 8). Error bars in a, c and f indicate 95% confidence intervals.
Fig. 3 |
Fig. 3 |. Clinical analysis of rare tandem repeat expansions in individuals with ASD.
a, Comparison of the fraction of samples having rare tandem repeat expansions in females (N=857) versus males (N=4,377) (Fisher’s exact test). An odds ratio of more than 1 indicates a higher burden of rare tandem repeat expansions in females. Error bars indicate 95% confidence intervals. b, Comparison of IQ and Vineland Adaptive Behavior standard scores of individuals with (N=139 individuals with IQ score and N=310 individuals with Vineland score) and without (N=426 individuals with IQ score and N=803 individuals with Vineland score) rare tandem repeat expansions (one-sided Wilcoxon test). The minima and maxima indicate 3×inter-quartile range-deviated scores from the median, and the centre indicates the median of the score percentiles.

Comment in

References

    1. López Castel A, Cleary JD & Pearson CE Repeat instability as the basis for human diseases and as a potential target for therapy. Nat Rev Mol Cell Biol 11, 165–70 (2010). - PubMed
    1. Yuen RKC et al. Whole genome sequencing resource identifies 18 new candidate genes for autism spectrum disorder. Nat Neurosci 20, 602–11 (2017). - PMC - PubMed
    1. Fischbach GD & Lord C The Simons Simplex Collection: a resource for identification of autism genetic risk factors. Neuron 68, 192–5 (2010). - PubMed
    1. 1000 Genomes Project Consortium. A global reference for human genetic variation. Nature 526, 68–74 (2015). - PMC - PubMed
    1. Bamshad MJ, Nickerson DA & Chong JX Mendelian gene discovery: fast and furious with no end in sight. Am J Hum Genet 105, 448–455 (2019). - PMC - PubMed

References for Methods

    1. Li H & Durbin R Fast and accurate short read alignment with Burrows-Wheeler transform. Bioinformatics 25, 1754–60 (2009). - PMC - PubMed
    1. Purcell S et al. PLINK: a tool set for whole-genome association and population-based linkage analyses. Am J Hum Genet 81, 559–75 (2007). - PMC - PubMed
    1. Alexander DH, Novembre J & Lange K Fast model-based estimation of ancestry in unrelated individuals. Genome Res 19, 1655–64 (2009). - PMC - PubMed
    1. Koren S et al. Canu: scalable and accurate long-read assembly via adaptive k-mer weighting and repeat separation. Genome Res 27, 722–736 (2017). - PMC - PubMed
    1. Ester M, Kriegel H, Sander J & Xu X A density-based algorithm for discovering clusters a density-based algorithm for discovering clusters in large spatial databases with noise. in Proceedings of the Second International Conference on Knowledge Discovery and Data Mining (AAAI Press, 1996).

Publication types