. 2020 Oct;586(7828):305-310.
doi: 10.1038/s41586-020-2578-0. Epub 2020 Jul 27.

CTCF orchestrates long-range cohesin-driven V(D)J recombinational scanning

Affiliations

CTCF orchestrates long-range cohesin-driven V(D)J recombinational scanning

Zhaoqing Ba et al. Nature. 2020 Oct.

Abstract

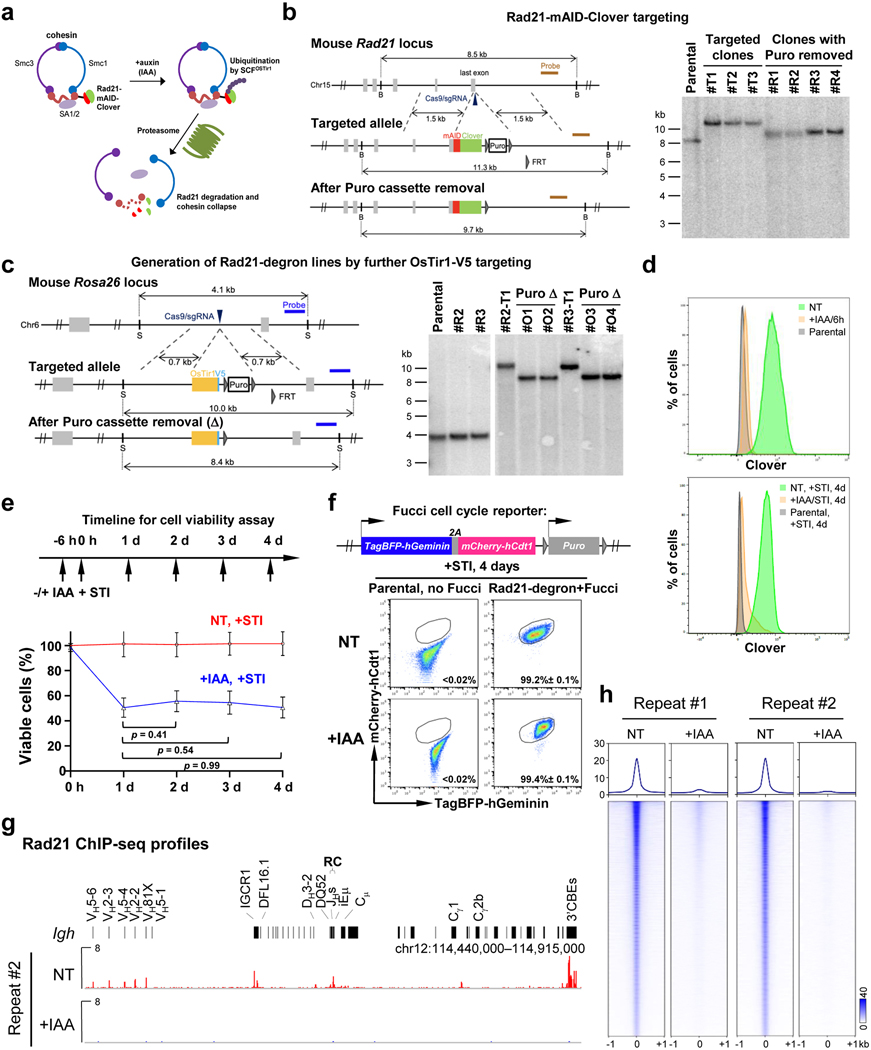
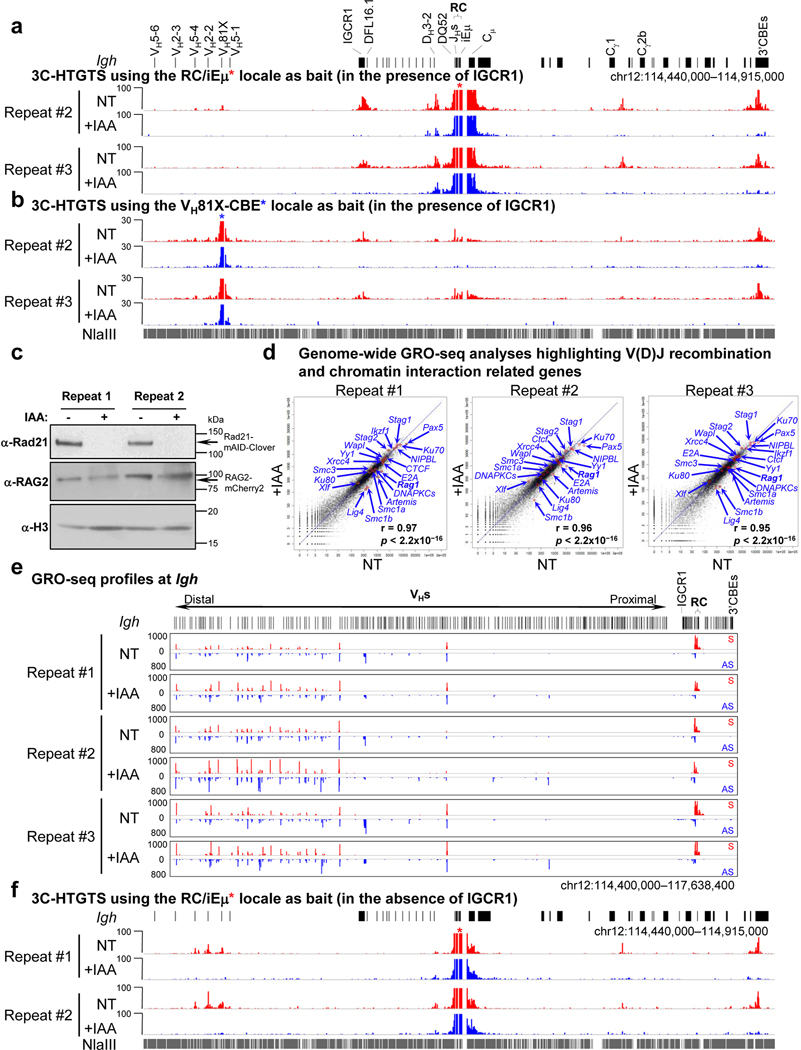
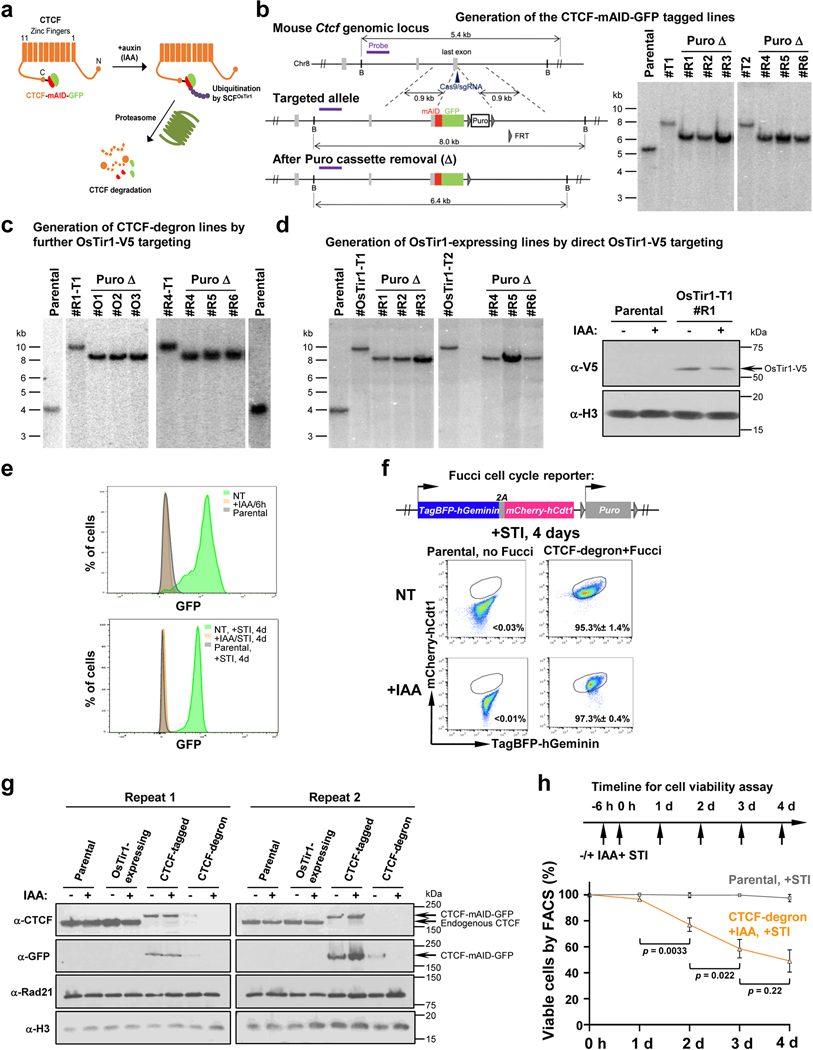
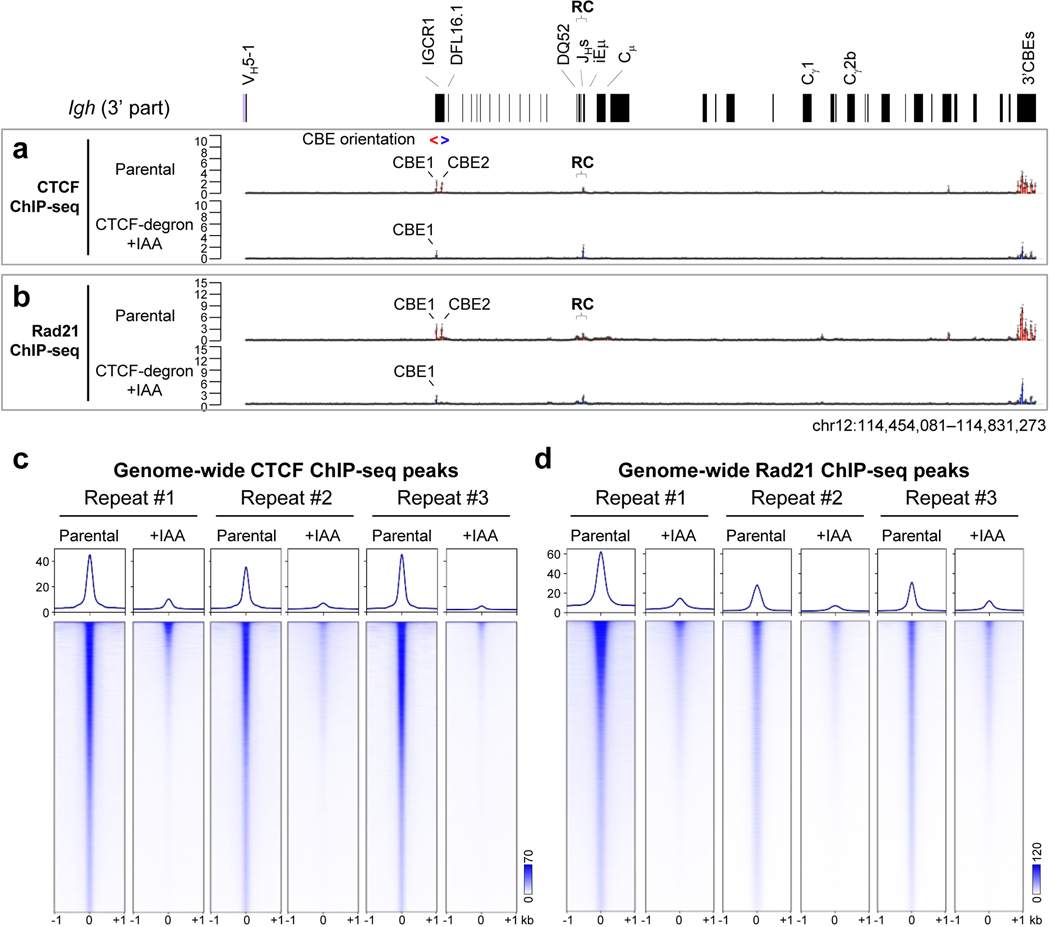
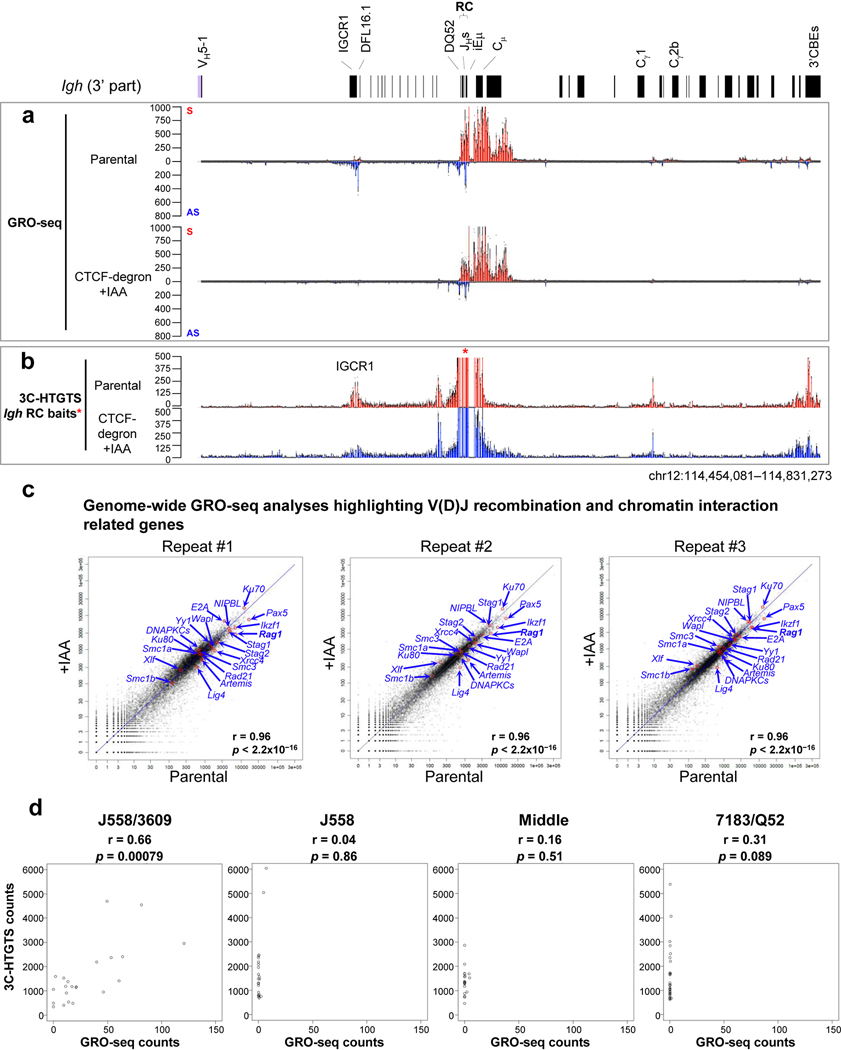
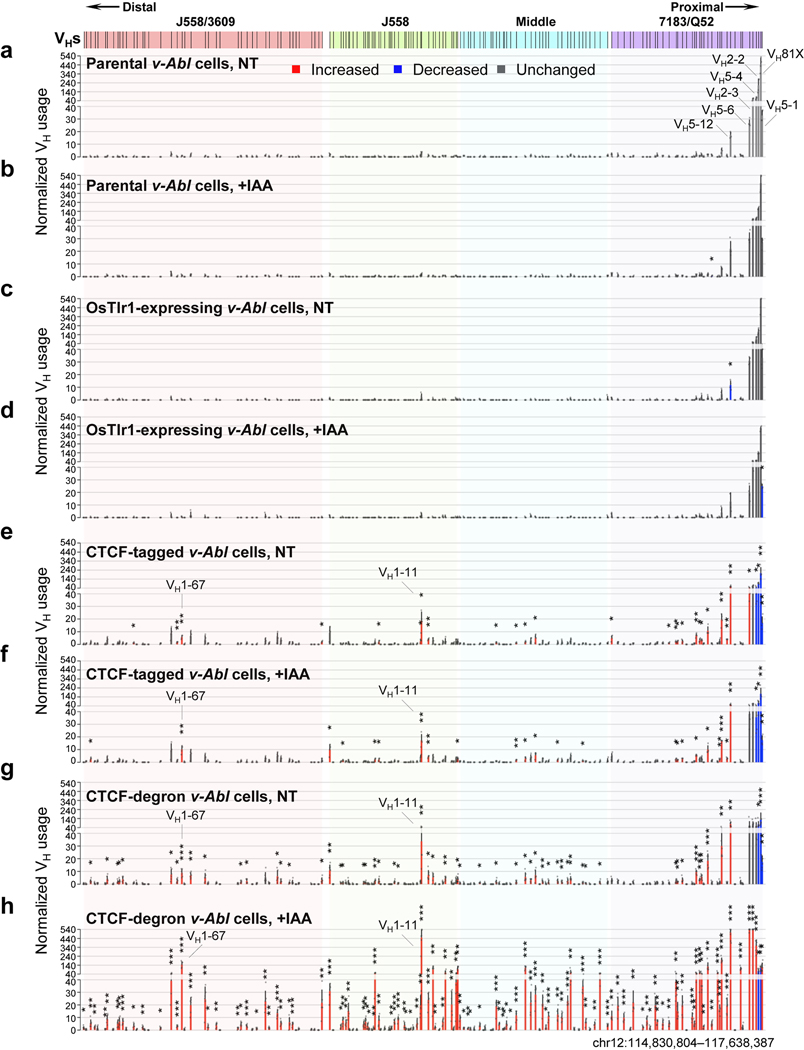
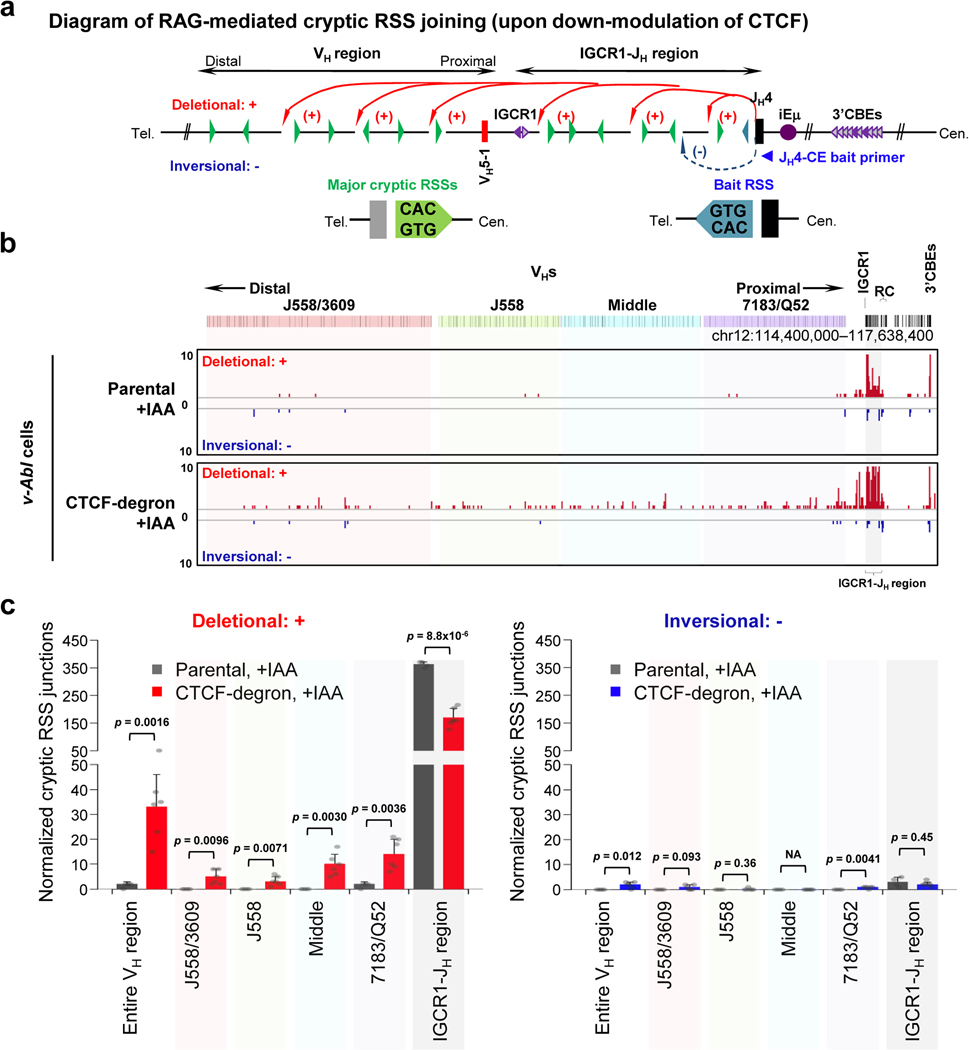
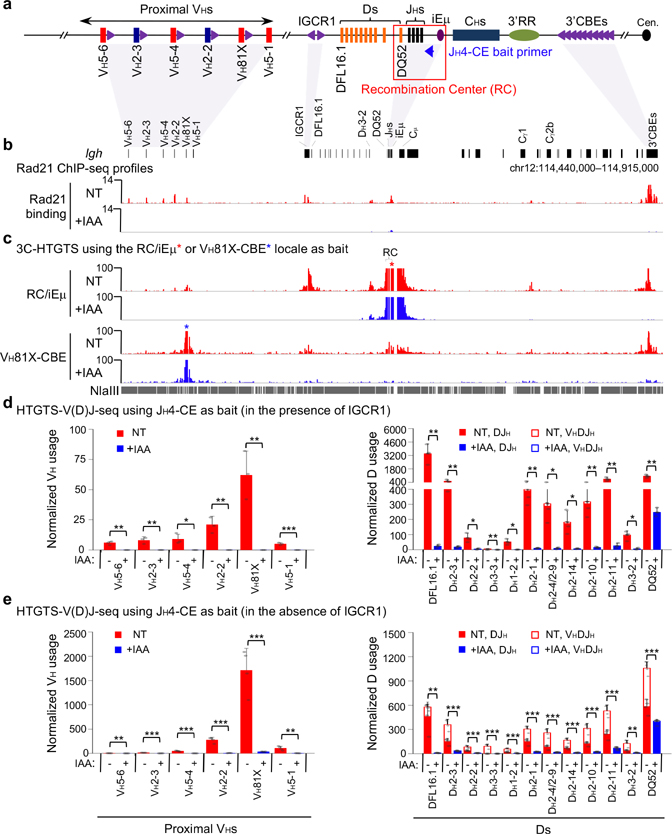
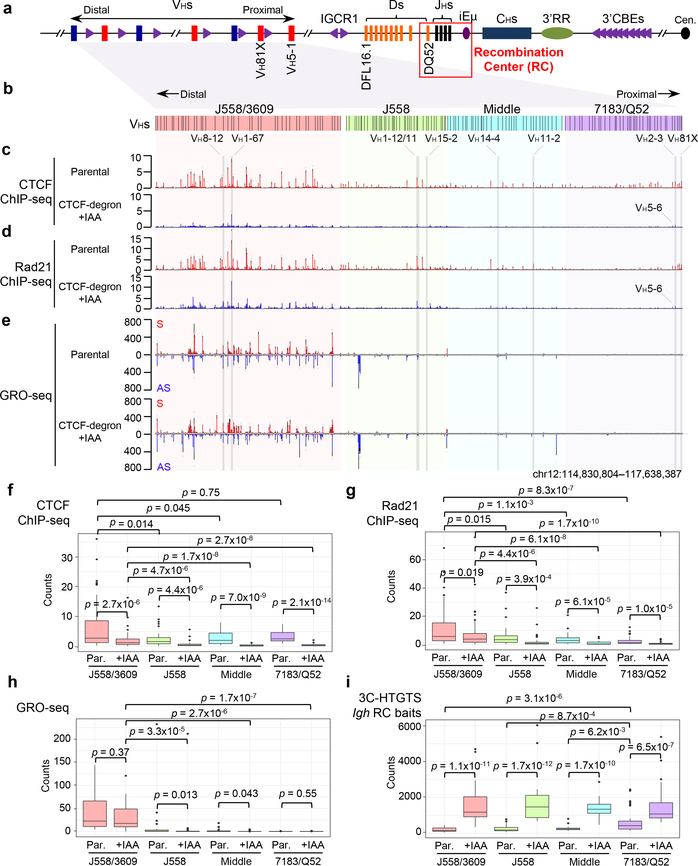
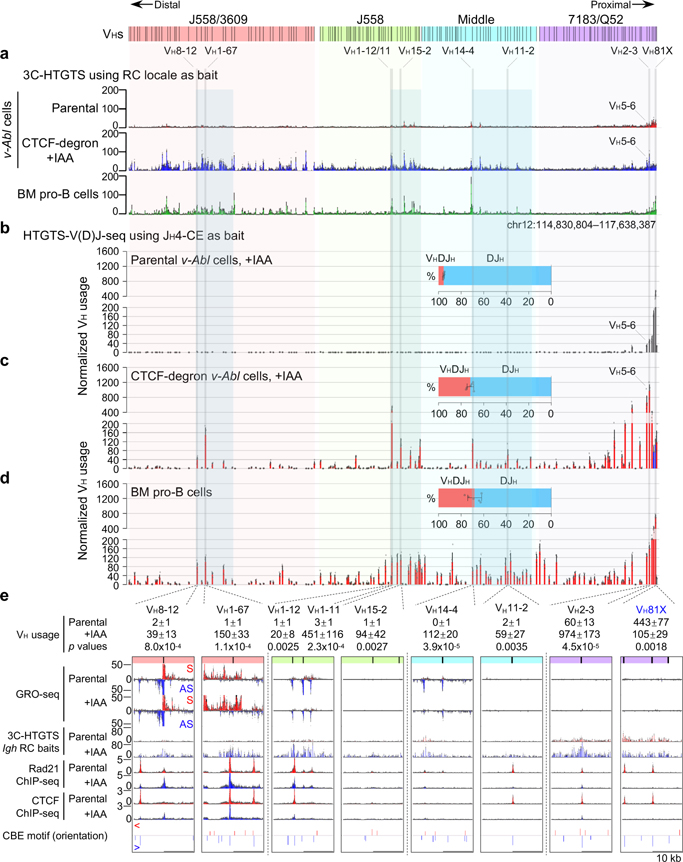
The RAG endonuclease initiates Igh locus V(D)J recombination in progenitor (pro)-B cells1. Upon binding a recombination centre-based JH, RAG scans upstream chromatin via loop extrusion, potentially mediated by cohesin, to locate Ds and assemble a DJH-based recombination centre2. CTCF looping factor-bound elements (CBEs) within IGCR1 upstream of Ds impede RAG scanning3-5; however, their inactivation allows scanning to proximal VHs, where additional CBEs activate rearrangement and impede scanning any further upstream5. Distal VH utilization is thought to involve diffusional access to the recombination centre following large-scale Igh locus contraction6-8. Here we test the potential of linear RAG scanning to mediate distal VH usage in G1-arrested v-Abl pro-B cell lines9, which undergo robust D-to-JH but little VH-to-DJH rearrangements, presumably owing to lack of locus contraction2,5. Through an auxin-inducible approach10, we degraded the cohesin component RAD2110-12 or CTCF12,13 in these G1-arrested lines. Degradation of RAD21 eliminated all V(D)J recombination and interactions associated with RAG scanning, except for reecombination centre-located DQ52-to-JH joining, in which synapsis occurs by diffusion2. Remarkably, while degradation of CTCF suppressed most CBE-based chromatin interactions, it promoted robust recombination centre interactions with, and robust VH-to-DJH joining of, distal VHs, with patterns similar to those of 'locus-contracted' primary pro-B cells. Thus, downmodulation of CTCF-bound scanning-impediment activity promotes cohesin-driven RAG scanning across the 2.7-Mb Igh locus.


Figures

Extended Data Fig. 1 |
Extended Data Fig. 1 |. Generation and characterization of Rad21-degron lines.
a, Diagram of the Rad21-degron. b, c, Left: Schematic of the targeting strategy for introducing in-frame mAID-Clover sequences into both mouse endogenous Rad21 alleles (b), and OsTir1-V5 expression cassette into both Rosa26 alleles (c). Positions of Cas9/sgRNAs and southern blotting probes are indicated. B: BglII; S: SspI. Right: Southern blotting confirmation of correctly targeted alleles as indicated (n=3 biologically independent repeats with similar results for each targeting). d, Representative Clover signal-based flow-cytometry plots for Rad21-degron cells that are non-treated (NT) or treated with IAA (+IAA) for 6h (top) followed by treatment with STI-571 (without or with IAA) for 4 days to induce G1 arrest (bottom). The parental cells were used as Clover negative controls. Three biological repeats with similar results. e, Time-course cell viability assay for Rad21-degron cells without (NT) or with (+IAA) IAA treatment following STI-571 treatment for G1-arrest (+STI). Average percentage ± s.d. of viable cells for each timepoint and under each condition was shown (n=4 biologically independent samples). p values were calculated using unpaired two-tailed t-test. f, Fucci cell cycle assay of Rad21-degron cells without (NT) or with (+IAA) IAA treatment followed by 4-day STI-571 treatment. Representative flow-cytometry plots and average percentage ± s.d. of cells arrested in G1-stage at indicated condition (n=3 biologically independent samples) are shown. The parental cells without Fucci were used as negative controls. g, Rad21 ChIP-seq profiles at indicated Igh locus in NT and IAA-treated G1-arrested Rad21-degron cells (n=2 biological repeats with similar results). h, Rad21 ChIP-seq signal within ±1kb region across all peaks genome-wide called in G1-arrested NT Rad21-degron cells (n=2 biological repeats with similar results). Top: Average enrichment. IAA treatment leads to a depletion of chromatin-bound Rad21 genome-wide. See Methods for details.
Extended Data Fig. 2 |
Extended Data Fig. 2 |. Effects of cohesin loss on Igh loop domains and transcription across Igh and genome-wide in G1-arrested Rad21-degron cells.
a, b, 3C-HTGTS chromatin interaction profiles of RC/iEμ bait (a, red asterisk) and VH81X-CBE bait (b, blue asterisk) at indicated Igh locus in NT and IAA-treated G1-arrested Rad21-degron cells. Three biologically independent repeats for each bait with similar results. c, Western blotting for Rad21 and RAG2 using histone H3 as a loading control on nuclear extracts of NT and IAA-treated G1-arrested Rad21-degron cells. Two biologically independent repeats with similar results. d, Scatter plots of transcriptome-wide GRO-seq counts in NT (x axis) and IAA-treated (y axis) G1-arrested Rad21-degron cells. Three biologically independent repeats with similar results. Representative known requisite genes for V(D)J recombination and chromatin interaction are highlighted by red circles and blue arrows. Spearman’s correlation coefficient (r) and p values determined by two-sided Spearman’s correlation test are presented. e, GRO-seq analyses of NT and IAA-treated G1-arrested Rad21-degron cells across the entire Igh locus as indicated. Three biologically independent repeats with similar results. S/AS: sense/anti-sense transcription. f, 3C-HTGTS chromatin interaction profiles of RC/iEμ bait (red asterisk) at indicated Igh locus in NT and IAA-treated G1-arrested IGCR1-deleted Rad21-degron cells. Two biologically independent repeats with similar results. See Methods for details.
Extended Data Fig. 3 |
Extended Data Fig. 3 |. Generation and characterization of CTCF-tagged, OsTir1-expressing and CTCF-degron lines.
a, Diagram of the CTCF-degron. b, Left: Targeting strategy for introducing in-frame mAID-GFP sequences into both Ctcf alleles. Cas9/sgRNAs and southern blotting probe are indicated. B: BglII. Right: Southern blotting confirmation of correctly targeted alleles (n=3 biological repeats with similar results). c, d, Southern blotting confirmation of correctly targeted Rosa26 alleles in CTCF-degron (c, n=3 biological repeats with similar results) and OsTir1-expressing (d, left, n=2 biological repeats with similar results) lines following OsTir1-V5 targeting strategy shown in Extended Data Fig. 1c. Western blotting on nuclear extracts of G1-arresed OsTir1-expressing cells with correctly targeted Rosa26 alleles confirms the constitutive expression of OsTir1-V5 protein (d, right, n=2 biological repeats with similar results). Histone H3 was used as a loading control. e, Representative GFP signal-based flow-cytometry plots for CTCF-degron cells that are non-treated (NT) or treated with IAA (+IAA) for 6h (top) followed by 4-day STI-571 treatment (without or with IAA) (bottom). The parental cells were used as GFP negative controls. Three biological repeats with similar results. f, Fucci cell cycle assay of CTCF-degron cells without (NT) or with IAA treatment followed by 4-day STI-571 treatment. Representative flow-cytometry plots and average percentage ± s.d. of cells arrested in G1-stage at indicated condition (n=3 biologically independent samples) are shown. The parental cells without Fucci were used as negative controls. g, Western blotting on nuclear extracts of G1-arrested cells as indicated using indicated antibodies (n=3 biological repeats with similar results). h, Time-course cell viability assay for parental and IAA-treated CTCF-degron cells, following STI-571 treatment for G1-arrest (+STI). Average percentage ± s.d. of viable cells for each timepoint and under each condition was shown (n=3 biologically independent samples). p values were calculated using unpaired two-tailed t-test. See Methods.
Extended Data Fig. 4 |
Extended Data Fig. 4 |. Characterization of chromatin CTCF/Rad21-binding across Igh downstream part and genome-wide in G1-arrested parental and IAA-treated CTCF-degron cells.
a, b, Average signal counts ± s.e.m. of CTCF (a) and Rad21 (b) ChIP-seq from three biologically independent experiments across 3’ part of Igh locus as diagramed at the top in G1-arrested parental and IAA-treated CTCF-degron cells are plotted. “<”/”>”: orientation of indicated CBEs. c, d, CTCF (c) and Rad21 (d) ChIP-seq signal across all peaks genome-wide called in G1-arrested parental cells. See Extended Data Fig. 1h legend for other details. Three biologically independent repeats with similar results. IAA-treated CTCF-degron cells had greatly diminished CTCF and Rad21 chromatin occupancy, but, also had residual binding at some CBEs genome-wide. See Methods for details. Notably, CTCF binding increased at the RC (Extended Data Fig. 4a) and at a subset transcribed VHs (Fig. 3e, Supplementary Data) upon CTCF depletion. While increases in apparent CTCF-binding to the non-CBE-containing RC and also transcribed VHs upon CTCF depletion could be considered surprising, it may likely occur indirectly due to cohesin-mediated loop extrusion-driven dynamic associations of the RC dynamic anchor with residual-CTCF-bound CBEs across Igh.
Extended Data Fig. 5 |
Extended Data Fig. 5 |. Characterization of transcription and RC chromatin interactions across Igh downstream part and transcription genome-wide in G1-arrested parental and IAA-treated CTCF-degron cells.
a, Average signal counts ± s.e.m. of GRO-seq from three biologically independent experiments across 3’ part of Igh locus as diagramed at the top in G1-arrested parental and IAA-treated CTCF-degron cells are plotted. S/AS: sense/anti-sense transcription. b, Average 3C-HTGTS signal counts ± s.e.m. from three independent experiments with RC-based baits (red asterisk) across 3’ part of Igh locus as diagramed at the top in G1-arrested parental and IAA-treated CTCF-degron cells are plotted. c, Scatter plots of transcriptome-wide GRO-seq counts in G1-arrested parental (x axis) and IAA-treated CTCF-degron (y axis) cells. Three biologically independent repeats with similar results. Representative known requisite genes for V(D)J recombination and chromatin interaction are highlighted by red circles and blue arrows. Spearman’s correlation coefficient (r) and p values determined by two-sided Spearman’s correlation test are presented. d, Scatter plots of normalized GRO-seq read counts (x axis) and 3C-HTGTS junction counts (y axis) calculated from regions within ±5kb of highly-utilized VHs across four indicated VH domains in IAA-treated CTCF-degron cells. Data were normalized and quantified among three biologically independent experiments for each assay. Spearman’s correlation coefficient (r) and p values determined by two-sided Spearman’s correlation test are presented. See Methods for details.
Extended Data Fig. 6 |
Extended Data Fig. 6 |. A positive impact of reduced CTCF levels on RAG scanning across the VH locus.
a-h, HTGTS-V(D)J-seq analysis showing average utilization frequencies ± s.d. of VH segments across four highlighted VH domains in RAG2-complemented and G1-arrested parental (a, b), OsTir1-expressing (c, d), CTCF-tagged (e, f), and CTCF-degron (g, h) cells without or with IAA treatment. n=4 (a-f) or n=6 (g, h) biologically independent repeats with similar results. Utilization of VHs presented in b-h are compared to those in NT parental cells shown in a, with red, blue, and grey bars indicating VHs with significantly increased, decreased, and unchanged utilization, respectively. To facilitate direct comparisons, the HTGTS-V(D)J-seq data for the IAA-treated parental and CTCF-degron cells shown in b and h are the same as those presented in Fig. 3b and c, respectively, with different y-axis scales. p values were calculated using unpaired two-tailed t-test (*: p ≤ 0.05, **: p ≤ 0.01, and ***: p ≤ 0.001). See Supplementary Table 3 for exact p values. See Methods for details.
Extended Data Fig. 7 |
Extended Data Fig. 7 |. Substantial CTCF depletion promotes robust RAG utilization of cryptic RSSs across the VH locus in G1-arrested IAA-treated CTCF-degron cells.
a, Diagram of joining between RAG-mediated breaks at initiating bona fide JH4-RSS (blue triangle) and cryptic RSSs, mostly represented by CAC motifs (green triangles), across Igh locus, upon down-modulation of CTCF/CBEs (indicated by light purple arrowheads). Deletional and inversional joining is denoted by red (+) and blue (−) curves, respectively. b, Pooled HTGTS junction profiles across highlighted VH domains for deletional and inversional joining in RAG2-complemented, IAA-treated and G1-arrested parental (n=4 biological repeats with similar results) and CTCF-degron (n=6 biological repeats with similar results) cells. For presentation, all libraries from parental or CTCF-degron cells were pooled and normalized to 3,819 total off-target junctions. Note that the high-level deletional cryptic RSS joining signals (red bars) within IGCR1-JH region are off-scale on the y-axis for viewing of relatively lower level deletional cryptic RSS joining signals across the VH locus. The low-level, but reproducible, inversional joining events (blue bars) within IGCR1-JH region involve cryptic RSSs predominantly at IGCR1 and DH3–2 locales, as described. The vast majority of deletional joining events across the VH locus are reproducible among replicates and involve, at a minimum the CAC of an RSS. Almost all of the handful of the very low-level inversional joining events interspersed across VH locus are not reproducible among replicates consistent with being background events. c, Average frequencies ± s.d. of deletional (left) and inversional (right) joining events within indicated regions in RAG2-complemented, IAA-treated and G1-arrested parental (n=4 biological repeats with similar results) and CTCF-degron (n=6 biological repeats with similar results) cells. Each of the biological library replicates was normalized to 415 off-target junctions for statistical analysis. p values were calculated using unpaired two-tailed t-test. NA: not applicable. See Methods.
Extended Data Fig. 8 |
Extended Data Fig. 8 |. A working model for CTCF orchestrating long-range cohesin-driven V(D)J recombinational scanning.
a, Diagram shows mouse VH locus with 100-plus VHs in four domains, as described in Fig. 2a,b legend and the main text. b, With normal CTCF/CBE-impediment activity (red arrowheads), RAG scanning is strongly impeded by CBE-based IGCR1 and non-CBE-based DJHRC impediments,, allowing scanning-based D-to-JH rearrangement to precede VH-to-DJH rearrangement. Low-level scanning beyond IGCR1 allows proximal VH-to-DJH rearrangement in a minor subset of pro-B cells. Proximal VH-CBEs impedes further upstream scanning,. c, Down-modulation of CTCF reduces CTCF-occupancy of CBEs (grey arrowheads) across Igh, but residual binding is retained at certain CBEs (light blue arrowheads). Dampened CTCF/CBE activity allows RC-bound RAG to scan various linear distances across Igh in some cases the full-length. Upon reaching remaining scanning impediments, which could reflect CBEs with residual CTCF binding and/or transcription (dark arrows),, and perhaps others not yet defined (see main text, Fig. 3e and Supplementary Data), impeded scanning focuses RC-based RAG activity on sequences in the impeded region for VH-to-DJH joining d, Down-modulation of CTCF binding activity is one manner for extending extrusion but this could also be achieved by circumventing CBE impediments, for example, through modulation of cohesin activity (see text). Finally, extrusion of chromatin impediments past the RC may be more efficient in the absence of RAG binding. With respect to the VH locus, a RAG-bound RC may be more resistant passing impediments and also lead to V(D)J rearrangements that could progressively decrease the level of scanning that proceeds further upstream.
Fig. 1 |
Fig. 1 |. Cohesin depletion abrogates Igh loop domains and V(D)J rearrangements except RC-based DQ52-to-JH joining in G1-arrested Rad21-degron cells.
a, Schematic of the murine Igh locus (not to scale) showing proximal VHs, Ds, JHs, CHs, and regulatory elements as indicated, with recombination center (RC) that comprises the JH-proximal DQ52 segment, four JH segments, and the intronic enhancer (iEμ) highlighted. Purple arrowheads indicate organization of CBEs. Blue arrow denotes the JH4 coding-end (CE) bait primer used for generating HTGTS-V(D)J-seq libraries. Cen. centromere. b, c, Representative profiles of Rad21 ChIP-seq (b, two biological repeats with similar results) and 3C-HTGTS chromatin interactions (c) using the RC/iEμ (red asterisk) or VH81X-CBE (blue asterisk) as bait (three biological repeats with similar results for each bait) at Igh locus as diagrammed at the top in non-treated (NT) and IAA-treated (+IAA) G1-arrested Rad21-degron cells. See Extended Data Fig. 1g and 2a,b for additional biological repeats. d, e, HTGTS-V(D)J-seq analysis of utilization of indicated proximal VH (left) and D (right) segments on IGCR1-intact (d) and IGCR1-deleted (e) barcoded alleles (see Methods) in RAG2-complemented, NT and IAA-treated G1-arrested Rad21-degron cells. n=3 (d) and n=4 (e) biological repeats for each condition. D segments obtained from DJH and VHDJH joins are denoted by filled and open bars, respectively. Data are presented as mean ± s.d. p values were calculated using unpaired two-tailed t-test (*: p ≤ 0.05, **: p ≤ 0.01, and ***: p ≤ 0.001). See Supplementary Table 1 for exact p values. See Methods for details.
Fig. 2 |
Fig. 2 |. Characterization of chromatin CTCF/Rad21-binding and transcription across the VH locus in G1-arrested parental and IAA-treated CTCF-degron cells.
a, Schematic of the entire murine Igh locus with details as shown in Fig. 1a. b, The four VH domains are highlighted different colors which are maintained in related figures. c-e, Average signal counts ± s.e.m. of CTCF (c) and Rad21 (d) ChIP-seq and GRO-seq (e) from three biologically independent experiments across the four highlighted VH domains in G1-arrested parental and IAA-treated CTCF-degron cells are plotted. S/AS: sense/anti-sense transcription. See Extended Data Fig. 4a,b and 5a for the plots across other parts of Igh locus. VHs for comparisons in Fig. 3 are highlighted. f-i, Box-and-Whisker plots are presented with median, upper and lower quartiles and whiskers showing 1.5x interquartile range for CTCF (f) and Rad21 (g) ChIP-seq, GRO-seq (h), and 3C-HTGTS (i) signal counts within indicated VH domains in G1-arrested parental (“Par.”) and IAA-treated CTCF-degron cells. n=3 biological repeats with similar results for each condition in f-i. p values were calculated using two-sided Mann-Whitney U test. See Methods for details. Comparison of panels (f) and (h) reveals that residual CTCF binding levels are significantly higher in the highly transcribed distal VH domain than those of the proximal domains with less overall transcription, which might reflect known roles of transcription in CTCF chromatin binding,.
Fig. 3 |
Fig. 3 |. CTCF depletion activates Igh RC interactions with the VH locus and robust VH-to-DJH joining of distal VHs.
a, Average 3C-HTGTS signal counts ± s.e.m. across the four VH domains in G1-arrested parental (top, n=3) and IAA-treated CTCF-degron (middle, n=3) v-Abl cells and RAG2-deficient mouse BM pro-B cells (bottom, n=2). In all panels, “n” indicates biological repeats. Spearman’s correlation coefficient (r) and p values determined by two-sided Spearman’s correlation test between data in middle and bottom panels are: r=0.86, p<2.2×10⁻¹⁶. Related low-level RC interactions across the parental cell VH locus and those of BM pro-B cells (r=0.63) and IAA-treated CTCF-degron cells (r=0.74) suggest low-level Igh loop extrusion in parental cells. b-d, Average VH utilization frequencies ± s.d. in RAG2-complemented, IAA-treated and G1-arrested parental (b, n=4), CTCF-degron (c, n=6) v-Abl cells and BM pro-B cells (d, n=6). Average percentage ± s.d. of VHDJH and DJH rearrangements are indicated. Spearman’s correlation coefficient (r) and p values by two-sided Spearman’s correlation test between data in panels c and d are r=0.76, p<2.2×10⁻¹⁶. See Extended Data Fig. 6 and Supplementary Table 3. e, Average utilization frequencies ± s.d. of indicated VHs in RAG2-complemented, G1-arrested parental (n=4) and IAA-treated CTCF-degron (n=6) v-Abl cells. Zoom-in profiles of indicated assays (mean ± s.e.m) for ±10kb regions of indicated VHs in G1-arrested parental (n=3 for each assay) and IAA-treated CTCF-degron (n=3 for each assay) lines along with putative CBE motif and orientation are presented. High-level signals for some VHs are off-scale on the y-axis for viewing low-level VH signals. See Fig. 2, 3 for on-scale profiles. Other details are in Extended Data Fig. 4a and 5a. p values were calculated using unpaired two-tailed t-test. VHs with decreased utilization upon substantial CTCF depletion are marked in blue. Detailed data for all VHs are shown in Supplementary Data.

References

    1. Teng G & Schatz DG Regulation and Evolution of the RAG Recombinase. Adv. Immunol. 128, 1–39 (2015). - PubMed
    1. Zhang Y et al. The fundamental role of chromatin loop extrusion in physiological V(D)J recombination. Nature 573, 600–604 (2019). - PMC - PubMed
    1. Guo C et al. CTCF-binding elements mediate control of V(D)J recombination. Nature 477, 424–430 (2011). - PMC - PubMed
    1. Hu J et al. Chromosomal Loop Domains Direct the Recombination of Antigen Receptor Genes. Cell 163, 947–959 (2015). - PMC - PubMed
    1. Jain S, Ba Z, Zhang Y, Dai H-Q & Alt FW CTCF-Binding Elements Mediate Accessibility of RAG Substrates During Chromatin Scanning. Cell 174, 102–116.e14 (2018). - PMC - PubMed

Publication types

MeSH terms