. 2020 Jul 23;9(8):1766.
doi: 10.3390/cells9081766.

Glutaminase Inhibition on NSCLC Depends on Extracellular Alanine Exploitation

Affiliations

Glutaminase Inhibition on NSCLC Depends on Extracellular Alanine Exploitation

Elisa Caiola et al. Cells. .

Abstract

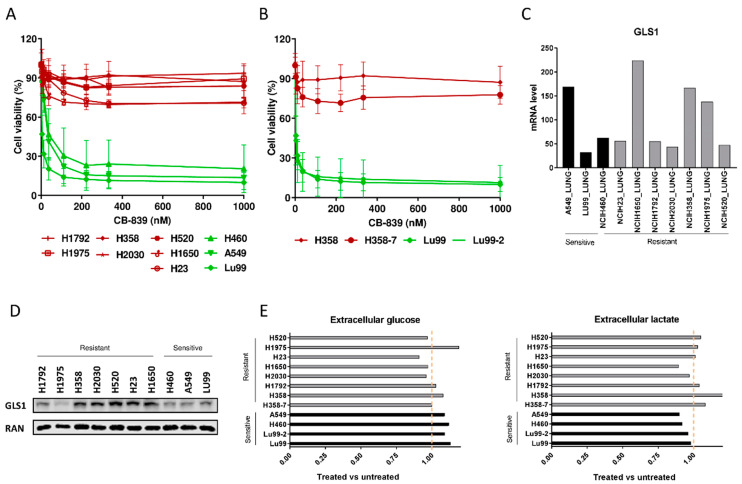
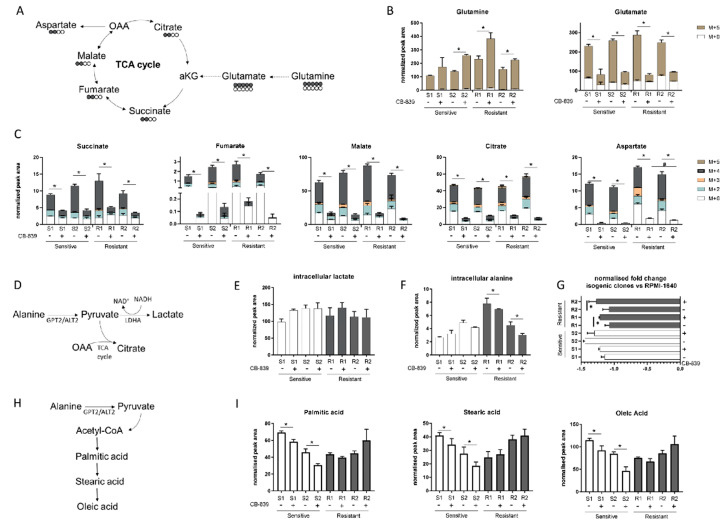
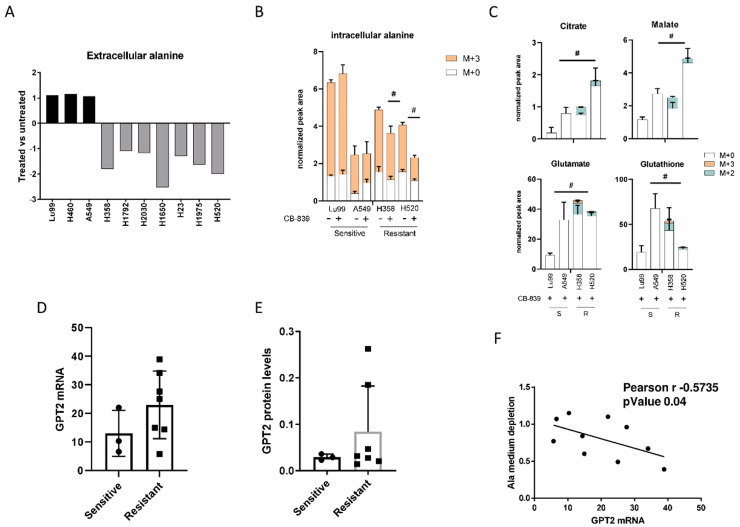
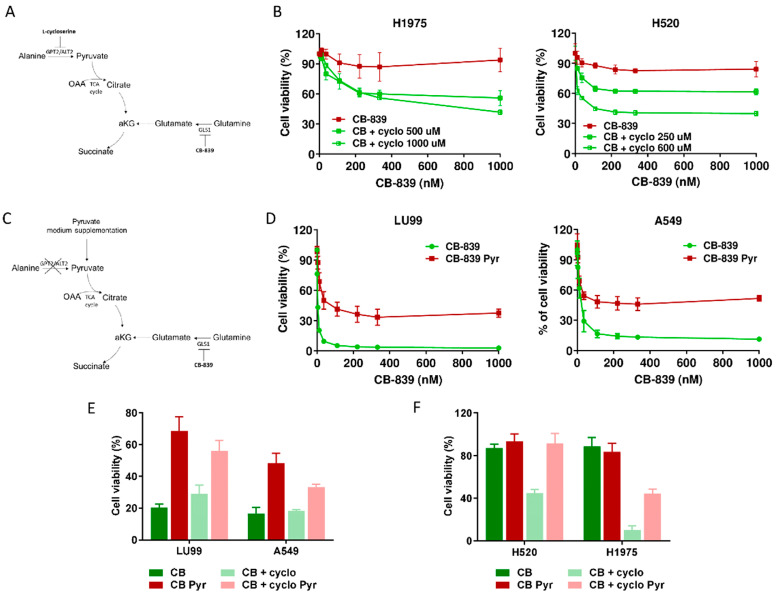
Non-small-cell lung cancer (NSCLC) cell lines vary in their sensitivity to glutaminase inhibitors, so it is important to identify the metabolic assets underling their efficacy in cancer cells. Even though specific genetic lesions such as in KRAS and LKB1 have been associated with reliance on glutamine for their metabolic needs, we found no distinction between glutaminase inhibitor CB-839 sensitivity and resistant phenotypes in NSCLC cells with or without these genetic alterations. We demonstrated the close relationship between environmental alanine uptake and catabolism. This response depended on the individual cell's ability to employ alanine aminotransferase (GPT2) to compensate the reduced glutamate availability. It may, therefore, be useful to determine GPT2 levels to predict which NSCLC patients would benefit most from glutaminase inhibitor treatment.

Keywords: NSCLC; alanine aminotransferase; alanine uptake; cancer cell resistance; glutaminase inhibition; metabolism.


Conflict of interest statement

The authors declare no conflict of interest.

Figures

Figure 1
Figure 1
(A) Dose–response curves of the NSCLC cell lines panel treated with increasing concentrations of CB-839. The response to the drug was assessed 72 h from the start of treatment with the MTS assay. The average of three independent experiments is reported. (B) Dose–response curves of the NSCLC LU99 and H358 LKB1 isogenic systems treated with increasing concentrations of CB-839. The response to the drug was assessed 72 h from the start of treatment with the MTS assay. The average of three independent experiments is reported. (C) GLS1 RNAseq gene expression data retrieved from the CCLE [17], in ten NSCLC cell lines. (D) Western Blot analysis of GLS1 protein levels in the ten NSCLC cell lines used. Ran was used as loading control. The figure is representative of at least three independent experiments. (E) Fold change in abundance (normalized peak area) of extracellular glucose uptake and lactate release in NSCLC CB-839 treated vs. untreated cells (500 nM CB-839, 6 h treatment). Mean ± SD of triplicate culture/conditions.
Figure 2
Figure 2
(A) Schematic representation of the 13-C glutamine labelling experiment. (B) M + 0 and M + 5 glutamine and glutamate abundance in two sensitive and two resistant H1299-derived clones with or without CB-839 (500 nM, 24 h treatment). (C) Isotope labelling of the TCA cycle in the presence of 13C5-glutamine with or without CB-839 (500 nM, 24 h treatment) in two sensitive (S1, KRASwt/LKB1wt, S2, KRASmut/LKB1wt) and two resistant (R1, KRASwt/LKB1del, R2, KRASmut/LKB1del) H1299-derived clones (normalized peak area). (D) Schematic representation of intracellular pyruvate metabolism. (E) Intracellular lactate levels (normalized peak area) with or without CB-839 (500 nM, 24 h treatment) in two sensitive and two resistant H1299-derived clones. (F) Intracellular alanine levels (normalized peak area) with or without CB-839 (500 nM, 24 h treatment) in two sensitive and two resistant H1299-derived clones. (G) Normalized fold change of extracellular alanine levels vs. unconditioned RPMI-1640 with or without CB-839 (500 nM, 24 h treatment) in two sensitive and two resistant H1299-derived clones. (H) Schematic representation of fatty acid biosynthesis. (I) Intracellular levels of fatty acids with or without CB-839 (500 nM, 24 h treatment) in two sensitive and two resistant H1299-derived clones. Mean ± SD of triplicate culture/conditions. Statistical significance * p < 0.05 untreated vs CB-839 treated cells, # p < 0.05 untreated sensitive vs untreated resistant cells, Wilcoxon Mann–Whitney test (M + 0, M + 2, M + 3, M + 4, M + 5).
Figure 3
Figure 3
(A) Changes in extracellular alanine levels in the panel of ten NSCLC cell lines, CB-839-treated vs. untreated, cells (500 nM, 24 h treatment). (B) Unlabeled and 13C3-labelled alanine incorporation (M + 0, M + 3) in two sensitive (LU99, A549) and two resistant (H358, H520) cells, either untreated or CB-839 treated (500 nM, 24 h treatment). (C) The 13C3-alanine-derived carbon labelling (M + 2, M + 3, normalized peak area) of TCA cycle intermediates and citrate, malate, glutamate and glutathione derived metabolites in CB-839 treated sensitive and resistant cells. (D) GPT2 mRNA expression as RNA-seq, retrieved from the CCLE in the sensitive and resistant cells. (E) Western blot analyses of GPT2 expression in the NSCLC cell line panel. Ran was used as loading control. (F) Pearson correlation between alanine uptake from each cell line’s medium and GPT2 mRNA expression, retrieved from the CCLE. The average of three independent experiments is reported. Statistical significance # p < 0.05 refer to significant differences (one-way ANOVA and Tukey Kramer test) of M + 2 and M + 3 in the resistant vs. sensitive cells.
Figure 4
Figure 4
(A) Schematic representation of metabolic strategy to overcome CB-839 resistance, targeting GPT2 by l-cycloserine (cyclo). (B) Dose–response curves of H1975 (left panel) and H520 (right panel) cells treated with increasing concentrations of CB-839, alone (CB-839) or with l-cycloserine (CB + cyclo) at the reported concentrations. The response to the drugs was assessed with the MTS assay 72 h from the treatment start. (C) Schematic representation of metabolic strategy to induce CB-839 resistance in the sensitive cell lines by pyruvate supplementation, with inhibition of GLS1, alone or together with GPT2. (D) Dose–response curves of LU99 (left panel) and A549 (right panel) cells treated with increasing concentrations of CB-839, grown and treated in standard (CB-839) or pyruvate-enriched medium (CB-839 Pyr). The response to the drug was assessed with the MTS assay 72 h from treatment start. (E) Histograms of LU99 and A549 cells grown in standard or pyruvate-enriched medium (Pyr) and treated with CB-839 (CB, 12 nM for LU99 and 111 nM for A549) and l-cycloserine (cyclo, 75 µM for LU99 and 100 µM for A549), either alone or in combination. The response to the drug was assessed 72 h from the start of treatment with the MTS assay. (F) Histograms of H520 and H1975 cells grown in standard or pyruvate-enriched medium (Pyr) and treated with CB-839 (CB, 1000 nM) and l-cycloserine (cyclo), 250 µM for H520 and 500 µM for H1975), either alone or in combination. The response to the drug was assessed with the MTS assay 72 h from treatment start. The average of three independent experiments is reported. For the sake of clarity, the statistical significance one-way ANOVA and Bonferroni post-test for multiple comparisons (panel B,D,E,F) are reported as Supplemental Table S1, Table S2, Table S3 and Table S4, respectively).
Figure 5
Figure 5
(A) GPT2 RNA expression as RNA-seq data retrieved from The Cancer Genome Atlas (TCGA) for NSCLC, colorectal, breast and kidney cancer patients. (B) GPT2 protein levels; bars indicate the percentage of patients (12 patients) with high and medium protein expression levels obtained from the Human Protein Atlas [25].

References

    1. Cluntun A.A., Lukey M.J., Cerione R.A., Locasale J.W. Glutamine Metabolism in Cancer: Understanding the Heterogeneity. Trends Cancer. 2017;3:169–180. doi: 10.1016/j.trecan.2017.01.005. - DOI - PMC - PubMed
    1. Mohamed A., Deng X., Khuri F.R., Owonikoko T.K. Altered glutamine metabolism and therapeutic opportunities for lung cancer. Clin. Lung Cancer. 2014;15:7–15. doi: 10.1016/j.cllc.2013.09.001. - DOI - PMC - PubMed
    1. Vanhove K., Derveaux E., Graulus G.-J., Mesotten L., Thomeer M., Noben J.-P., Guedens W., Adriaensens P. Glutamine Addiction and Therapeutic Strategies in Lung Cancer. Int. J. Mol. Sci. 2019;20:252. doi: 10.3390/ijms20020252. - DOI - PMC - PubMed
    1. Altman B.J., Stine Z.E., Dang C.V. From Krebs to clinic: Glutamine metabolism to cancer therapy. Nat. Rev. Cancer. 2016;16:619–634. doi: 10.1038/nrc.2016.71. - DOI - PMC - PubMed
    1. Katt W.P., Cerione R.A. Glutaminase regulation in cancer cells: A druggable chain of events. Drug Discov. Today. 2014;19:450–457. doi: 10.1016/j.drudis.2013.10.008. - DOI - PMC - PubMed

Publication types

MeSH terms