

Time Length of Negativization and Cycle Threshold Values in 182 Healthcare Workers with Covid-19 in Milan, Italy: An Observational Cohort Study
- PMID: 32718008
- PMCID: PMC7432921
- DOI: 10.3390/ijerph17155313
Time Length of Negativization and Cycle Threshold Values in 182 Healthcare Workers with Covid-19 in Milan, Italy: An Observational Cohort Study
Abstract
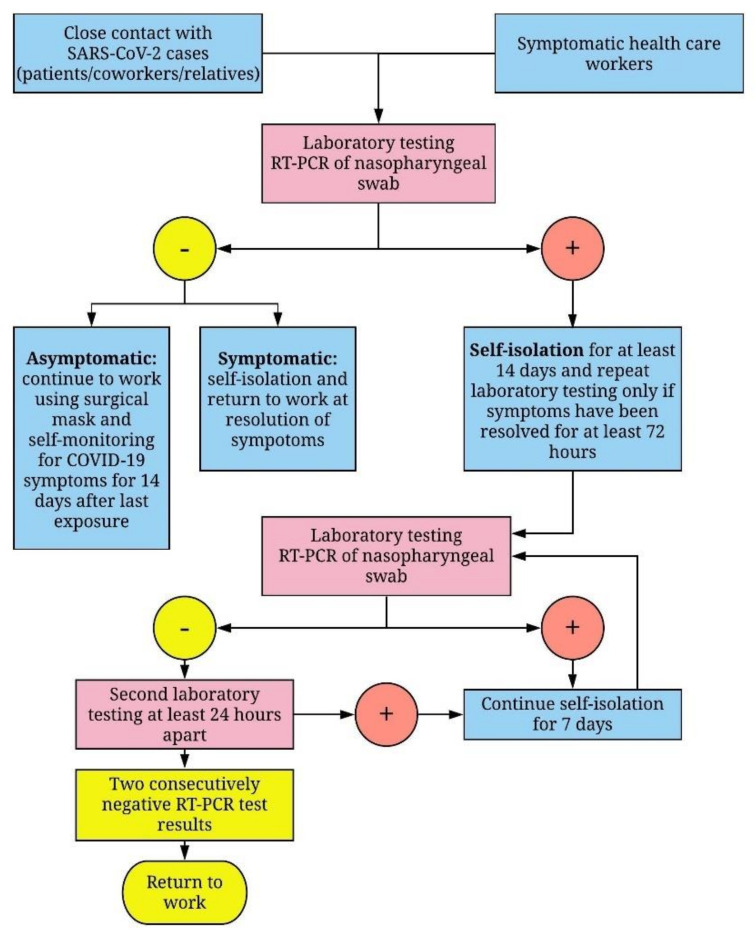
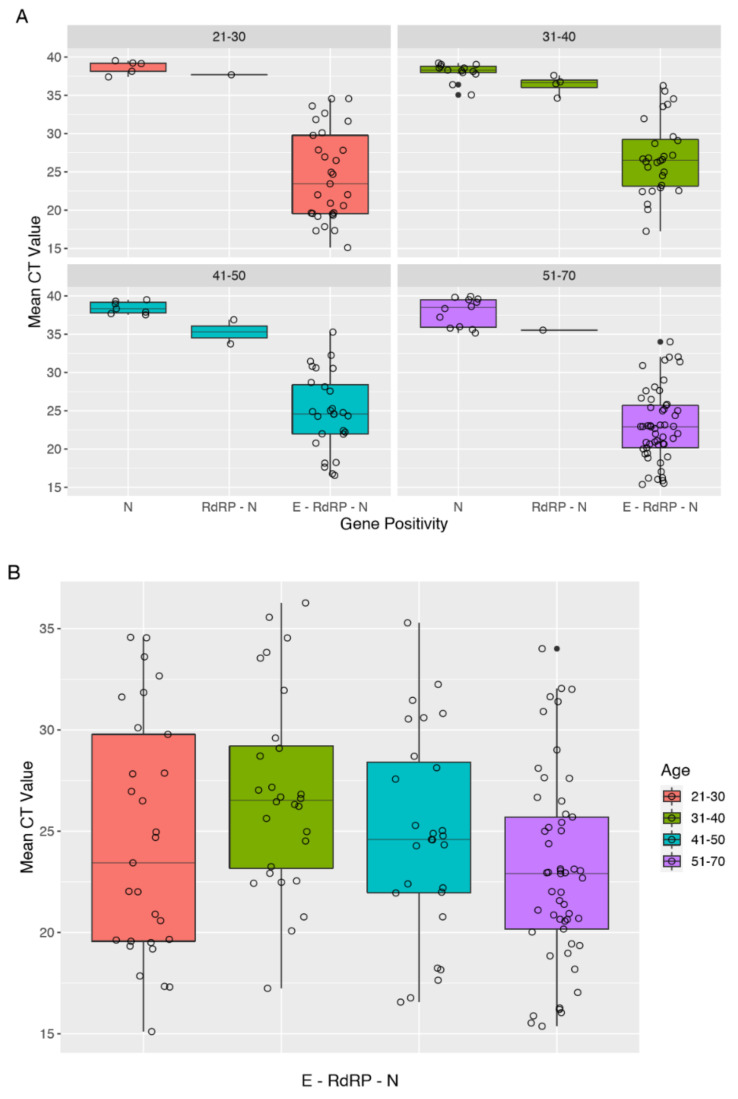
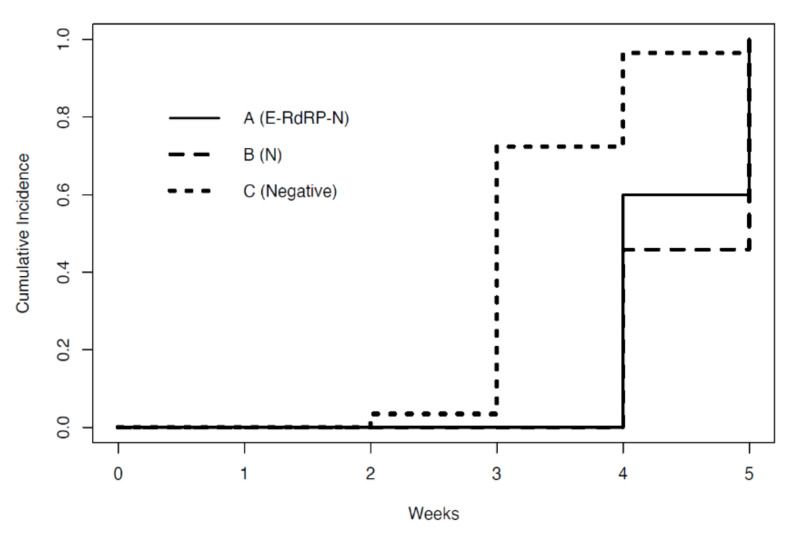
Background: Coronavirus Disease 2019 (COVID-19) has rapidly spread worldwide, becoming an unprecedented public health emergency. Rapid detection of Severe Acute Respiratory Syndrome Coronavirus 2 (SARS-CoV-2) suspected cases is crucial to control the spread of infection. We aimed to evaluate the time length of negativization from the onset of symptoms in healthcare workers (HCWs) with COVID-19, and to evaluate significant variations in cycle threshold (CT) values and gene positivity (E, RdRP, and N genes) among positive individuals who returned to work. Methods: We retrospectively analyzed a consecutive cohort of 182 SARS-CoV-2-positive HCWs in Milan, from 16 March to 30 April 2020. Nasopharyngeal swabs were tested by RT-PCR. Results: Asymptomatic HCWs were 17.6% (32/182), and 58 healed at 30 April 2020. The median time length of negativization was 4 weeks (35% of symptomatic versus 40% of asymptomatic HCWs). Four HCWs, healed at 30 April, turned positive within three weeks during controls set up in the work unit. Three-gene positivity had the greatest variability, and increasing CT values from single- to three-gene positivity among all age groups were observed. Conclusions: Self-isolation longer than two weeks and prolonged follow-up periods for the staff returning to work after COVID-19 could be the most suitable choices to counter the SARS-CoV-2 spread. Further studies are needed to investigate infectiousness profiles among positive individuals.
Keywords: Coronavirus Disease 2019; Cycle Threshold values; Reverse Transcription PCR; SARS-CoV-2; health care workers.
Conflict of interest statement
Simone Gambazza received personal fees from Vertex Pharmaceuticals, outside the submitted work. The study was conducted in accordance with the Declaration of Helsinki, and it was approved by the Ethics Committee of Fondazione IRCCS Ca Granda Ospedale Maggiore Policlinico Milan, Italy (368_2020bis).
Figures
Similar articles
-
Characteristics of 1573 healthcare workers who underwent nasopharyngeal swab testing for SARS-CoV-2 in Milan, Lombardy, Italy.Clin Microbiol Infect. 2020 Oct;26(10):1413.e9-1413.e13. doi: 10.1016/j.cmi.2020.06.013. Epub 2020 Jun 20. Clin Microbiol Infect. 2020. PMID: 32569835 Free PMC article.
-
Prevalence and Clinical Presentation of Health Care Workers With Symptoms of Coronavirus Disease 2019 in 2 Dutch Hospitals During an Early Phase of the Pandemic.JAMA Netw Open. 2020 May 1;3(5):e209673. doi: 10.1001/jamanetworkopen.2020.9673. JAMA Netw Open. 2020. PMID: 32437576 Free PMC article.
-
Prevalence of Sars-Cov-2 Infection in Health Workers (HWs) and Diagnostic Test Performance: The Experience of a Teaching Hospital in Central Italy.Int J Environ Res Public Health. 2020 Jun 19;17(12):4417. doi: 10.3390/ijerph17124417. Int J Environ Res Public Health. 2020. PMID: 32575505 Free PMC article.
-
The impact of novel coronavirus SARS-CoV-2 among healthcare workers in hospitals: An aerial overview.Am J Infect Control. 2020 Aug;48(8):915-917. doi: 10.1016/j.ajic.2020.05.020. Epub 2020 May 26. Am J Infect Control. 2020. PMID: 32464298 Free PMC article. Review.
-
The experience on coronavirus disease 2019 and cancer from an oncology hub institution in Milan, Lombardy Region.Eur J Cancer. 2020 Jun;132:199-206. doi: 10.1016/j.ejca.2020.04.017. Epub 2020 Apr 29. Eur J Cancer. 2020. PMID: 32380430 Free PMC article. Review.
Cited by
-
Short-term inhibition of SARS-CoV-2 by hydrogen peroxide in persistent nasopharyngeal carriers.J Med Virol. 2021 Mar;93(3):1766-1769. doi: 10.1002/jmv.26485. Epub 2020 Sep 24. J Med Virol. 2021. PMID: 32881014 Free PMC article.
-
SARS-CoV-2: Challenges in Reconverting Diagnostic Laboratories to Combat the Pandemic.Microbiol Spectr. 2022 Dec 21;10(6):e0147722. doi: 10.1128/spectrum.01477-22. Epub 2022 Oct 31. Microbiol Spectr. 2022. PMID: 36314981 Free PMC article.
-
Facing COVID-19 Pandemic in a Tertiary Hospital in Milan: Prevalence of Burnout in Nursing Staff Working in Sub-Intensive Care Units.Int J Environ Res Public Health. 2021 Jun 22;18(13):6684. doi: 10.3390/ijerph18136684. Int J Environ Res Public Health. 2021. PMID: 34206179 Free PMC article.
-
Coronavirus Disease-2019 and Implications on the Liver.Clin Liver Dis. 2023 Feb;27(1):27-45. doi: 10.1016/j.cld.2022.08.003. Epub 2022 Aug 18. Clin Liver Dis. 2023. PMID: 36400465 Free PMC article. Review.
-
A Phase II Study on the Effect of Taurisolo® Administered via AEROsol in Hospitalized Patients with Mild to Moderate COVID-19 Pneumonia: The TAEROVID-19 Study.Cells. 2022 Apr 29;11(9):1499. doi: 10.3390/cells11091499. Cells. 2022. PMID: 35563805 Free PMC article. Clinical Trial.
References
-
- WHO Coronavirus Disease 2019 (COVID-19). Situation Report-108. [(accessed on 8 May 2020)];2020 Available online: https://www.who.int/emergencies/diseases/novel-coronavirus-2019.
Publication types
MeSH terms
LinkOut - more resources
Full Text Sources
Research Materials
Miscellaneous
