. 2020 Jul 23;21(15):5225.
doi: 10.3390/ijms21155225.

Loss of Caveolin-1 Is Associated with a Decrease in Beta Cell Death in Mice on a High Fat Diet

Affiliations

Loss of Caveolin-1 Is Associated with a Decrease in Beta Cell Death in Mice on a High Fat Diet

Paloma Lillo Urzúa et al. Int J Mol Sci. .

Abstract

Elevated free fatty acids (FFAs) impair beta cell function and reduce beta cell mass as a consequence of the lipotoxicity that occurs in type 2 diabetes (T2D). We previously reported that the membrane protein caveolin-1 (CAV1) sensitizes to palmitate-induced apoptosis in the beta pancreatic cell line MIN6. Thus, our hypothesis was that CAV1 knock-out (CAV1 KO) mice subjected to a high fat diet (HFD) should suffer less damage to beta cells than wild type (WT) mice. Here, we evaluated the in vivo response of beta cells in the pancreatic islets of 8-week-old C57Bl/6J CAV1 KO mice subjected to a control diet (CD, 14% kcal fat) or a HFD (60% kcal fat) for 12 weeks. We observed that CAV1 KO mice were resistant to weight gain when on HFD, although they had high serum cholesterol and FFA levels, impaired glucose tolerance and were insulin resistant. Some of these alterations were also observed in mice on CD. Interestingly, KO mice fed with HFD showed an adaptive response of the pancreatic beta cells and exhibited a significant decrease in beta cell apoptosis in their islets compared to WT mice. These in vivo results suggest that although the CAV1 KO mice are metabolically unhealthy, they adapt better to a HFD than WT mice. To shed light on the possible signaling pathway(s) involved, MIN6 murine beta cells expressing (MIN6 CAV) or not expressing (MIN6 Mock) CAV1 were incubated with the saturated fatty acid palmitate in the presence of mitogen-activated protein kinase inhibitors. Western blot analysis revealed that CAV1 enhanced palmitate-induced JNK, p38 and ERK phosphorylation in MIN6 CAV1 cells. Moreover, all the MAPK inhibitors partially restored MIN6 viability, but the effect was most notable with the ERK inhibitor. In conclusion, our results suggest that CAV1 KO mice adapted better to a HFD despite their altered metabolic state and that this may at least in part be due to reduced beta cell damage. Moreover, they indicate that the ability of CAV1 to increase sensitivity to FFAs may be mediated by MAPK and particularly ERK activation.

Keywords: ERK activity; caveolin-1; diabetes; high fat diet; insulin resistance.


Conflict of interest statement

The authors declare no conflicts of interest.

Figures

Figure 1
Figure 1
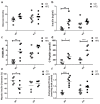
Metabolic characterization of male C57BL6J wild type (WT) and C57BL6J caveolin-1 knock-out (CAV1 KO) mice. (a) The body weight at the beginning (circles) and the end (squares) of the 12 weeks for mice on control diet (CD) or high fat diet (HFD) (n = 7). (b) Final body weight at the end of diets (n = 7). (c) Body weight changes between the beginning and the end of diets (n = 7). (d) The animals were sacrificed to determine the epididymal fat (n = 5). Serum samples were taken in order to evaluate the blood levels of (e) total cholesterol (n = 7), (f) triglycerides (n = 7) and (g) free fatty acids (FFA, n = 5). Mice were maintained for 6 h in fast conditions before the blood samples were taken. p values were calculated by two-way ANOVA with a Bonferroni post-test (* p < 0.05, ** p < 0.01 and *** p < 0.001). Data are presented as individual data points with their respective means.
Figure 2
Figure 2
Glucose management, Insulin and C-peptide levels, HOMA-IR, hepatic insulin clearance and oxidative stress in WT and KO mice subjected to CD or HFD. After 12 weeks of diet, blood samples were taken in order to evaluate the serum levels of (a) basal glucose (n = 7), (b) basal insulin (n = 7), (c) HOMA-IR (n = 7), (d) basal C-peptide (n = 5), (e) hepatic insulin clearance and (f) carbonylated proteins (n = 7). HOMA-IR (Homeostatic Model Assessment of Insulin Resistance) adjusted for mice (n = 7) were calculated from basal glucose and insulin levels. Hepatic insulin clearance was calculated from the basal insulin/C-peptide ratio (n = 5). Mice were maintained for 6 h in fasting conditions before blood samples were taken. p values were calculated by two-way ANOVA with a Bonferroni post-test (* p < 0.05, ** p < 0.01, *** p < 0.001). Data are presented as individual data points with their respective means.
Figure 3
Figure 3
IPGTT in WT and KO mice after 12 weeks of CD or HFD. Mice were subjected to a 6-h fasting period, and then a sample of caudal capillary blood was taken (basal). Then, mice were subjected to an intraperitoneal glucose load (2 g/Kg), and a glycemia test was taken in the same way at different time points, up to 120 min. The response kinetics are shown for WT mice in (a) and KO mice in (b). The area under the curve (AUC) in (c) was calculated and plotted for each group. p values were calculated by two-way ANOVA with a Bonferroni post-test (* p < 0.05). The data shown are the averages from results obtained in seven WT and seven KO mice per group. Data are presented as mean ± SD in (a,b) and as individual data points with their respective means in (c).
Figure 4
Figure 4
Study of islet morphology. After 12 weeks on CD or HFD, the pancreas was extracted, and 4 mm pancreas sections were stained with DAPI (4’,6-Diamidino-2-Phenylindole (double stranded DNA staining) and insulin-specific antibodies to identify the islets. In (a) the islet size, (b) the islet circularity, (c) the number of beta cells per islet, (d) the beta cell density in the islet and (e) the total beta cell area (%) per total islet area are shown. The results are representative of at least three sections per animal, with a total of at least three animals for each WT and KO group. p values were calculated by two-way ANOVA with a Bonferroni post-test (* p < 0.05, ** p < 0.01). Data are presented as individual data points with their respective means.
Figure 5
Figure 5
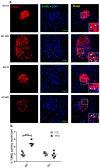
Study of apoptosis in situ in beta islets of WT and KO mice exposed to CD or HFD. Pancreas sections of 4 mm were stained with DAPI and immunostaining for insulin in order to identify the beta cells in islets, and apoptosis was determined by TUNEL (Terminal deoxynucleotidyl transferase dUTP nick end labeling) staining and analyzed by confocal microscopy. (a) White arrows indicate examples of TUNEL-positive nuclei within the islets. Scale bar represents 50 µm. Percentage of apoptotic TUNEL+ nuclei per islet is quantified in (b) The results are representative of at least three sections per animal, with a total of five animals for each WT and KO group. p values were calculated by two-way ANOVA with a Bonferroni post-test, with *** p < 0.001. Data are shown as individual data points with their respective means.
Figure 6
Figure 6
Role of MAPK in in vitro lipotoxicity in MIN6 cells in the presence or absence of CAV1. MIN6 mock and MIN6 CAV1 cells were incubated with different concentrations of FFA (a) palmitate or (b) oleate for 24 h, and viability was determined by the MTT (3-(4,5-dimethylthiazol-2-yl)-2,5-diphenyltetrazolium bromide) assay. (ce): The cells were pre-incubated with MAPK inhibitors for 30 min and then with 0.5 mM palmitate for 24 h. After this, cell viability was determined by the MTT assay. The results are expressed as the percentage viability compared to control cells (only medium with DMSO) or cells pre-incubated with inhibitors. The results represent the mean ± SD of six independent experiments (* p < 0.05 and ** p < 0.01 with respect to control; # p < 0.05 mock vs. CAV1).
Figure 7
Figure 7
MAPK activation by palmitate in the presence or absence of CAV1. The MIN6 mock and CAV1 cells were exposed to 0.5 mM palmitate and collected at 0, 6 and 12 h for protein extraction and Western blot to evaluate the activation of phosphorylation of (a) JNK, (b) p38 and (c) ERK. The presence of HSP90 was displayed as a load control. The results are represented as the mean ± SD and are representative of three independent experiments. * p < 0.05; with respect to 0 h; # p < 0.05; mock vs. CAV1.

References

    1. Ziqi T., Shi A., Zhao J. Epidemiological Perspectives of Diabetes. Cell Biophys. 2015;73:181–185. doi: 10.1007/s12013-015-0598-4. - DOI - PubMed
    1. Prentki M., Nolan C.J. Islet β cell failure in type 2 diabetes. J. Clin. Investig. 2006;116:1802–1812. doi: 10.1172/JCI29103. - DOI - PMC - PubMed
    1. Jetton T.L., Lausier J., LaRock K., Trotman W.E., Larmie B., Habibovic A., Peshavaria M., Leahy J. Mechanisms of compensatory beta-cell growth in insulin-resistant rats: Roles of Akt kinase. Diabetes. 2005;54:2294–2304. doi: 10.2337/diabetes.54.8.2294. - DOI - PubMed
    1. Stamateris R.E., Sharma R.B., Hollern D.A., Alonso L.C. Adaptive β-cell proliferation increases early in high-fat feeding in mice, concurrent with metabolic changes, with induction of islet cyclin D2 expression. Am. J. Physiol. Metab. 2013;305:E149–E159. doi: 10.1152/ajpendo.00040.2013. - DOI - PMC - PubMed
    1. Butler P.C., Janson J., Bonner-Weir S., Ritzel R.A., Rizza R.A., Butler P.C. Beta-cell deficit and increased beta-cell apoptosis in humans with type 2 diabetes. Diabetes. 2003;52:102–110. doi: 10.2337/diabetes.52.1.102. - DOI - PubMed

LinkOut - more resources