. 2020 Jul 27;21(1):185.
doi: 10.1186/s13059-020-02101-4.

Polymorphic mobile element insertions contribute to gene expression and alternative splicing in human tissues

Affiliations

Polymorphic mobile element insertions contribute to gene expression and alternative splicing in human tissues

Xiaolong Cao et al. Genome Biol. .

Abstract

Background: Mobile elements are a major source of structural variants in the human genome, and some mobile elements can regulate gene expression and transcript splicing. However, the impact of polymorphic mobile element insertions (pMEIs) on gene expression and splicing in diverse human tissues has not been thoroughly studied. The multi-tissue gene expression and whole genome sequencing data generated by the Genotype-Tissue Expression (GTEx) project provide a great opportunity to systematically evaluate the role of pMEIs in regulating gene expression in human tissues.

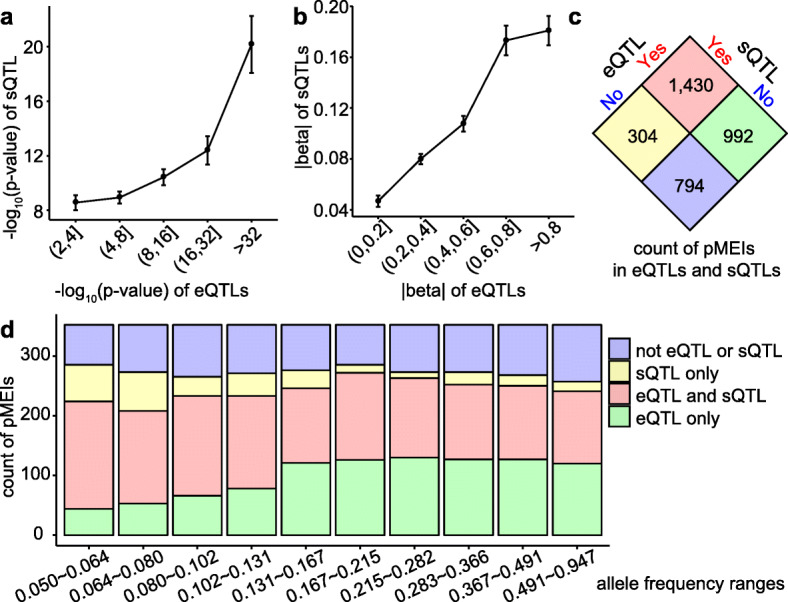
Results: Using the GTEx whole genome sequencing data, we identify 20,545 high-quality pMEIs from 639 individuals. Coupling pMEI genotypes with gene expression profiles, we identify pMEI-associated expression quantitative trait loci (eQTLs) and splicing quantitative trait loci (sQTLs) in 48 tissues. Using joint analyses of pMEIs and other genomic variants, pMEIs are predicted to be the potential causal variant for 3522 eQTLs and 3717 sQTLs. The pMEI-associated eQTLs and sQTLs show a high level of tissue specificity, and these pMEIs are enriched in the proximity of affected genes and in regulatory elements. Using reporter assays, we confirm that several pMEIs associated with eQTLs and sQTLs can alter gene expression levels and isoform proportions, respectively.

Conclusion: Overall, our study shows that pMEIs are associated with thousands of gene expression and splicing variations, indicating that pMEIs could have a significant role in regulating tissue-specific gene expression and transcript splicing. Detailed mechanisms for the role of pMEIs in gene regulation in different tissues will be an important direction for future studies.

Keywords: Alternative splicing; Gene expression regulation; Polymorphic mobile element insertions; Quantitative trait loci; Transposable elements.


Conflict of interest statement

The authors declare no competing interests.

Figures

Fig. 1
Fig. 1
Overview of the ME-only eQTL analysis. a The number of detected eQTLs with Benjamini-Hochberg FDR < 10% in each tissue. Bars are colored by tissue clusters based on cis-eQTL as shown in b (tree). b Similarity (Spearman’s correlation coefficient ρ) between different tissues based on cis-eQTL FDR values (lower triangle) and gene expression TPM values (upper triangle). Gene-pMEI pairs with FDR < 10% in at least one tissue are selected for the analysis. The tree on the left of the plot was based on the hierarchical clustering of the cis-eQTL results, and the branches are colored to five groups. Tissue text colors in a and b were based on the hierarchical clustering tree of TPM results (data not shown). c The relationship between the eQTL count (FDR < 10%) and the individual count in different tissues. Tissue text is colored by tissue clusters based on cis-eQTL in b (tree). The axes are in log scale. d Gene-pMEI pair count and the number of tissues they were detected as significant for coding and non-coding genes. e Effect size (beta value) distribution for coding and non-coding eQTLs of different types of pMEIs. Tissue abbreviations: AdS, adipose subcutaneous; AdV, adipose visceral omentum; AG, adrenal gland; ArA, artery aorta; ArC, artery coronary; ArT, artery tibial; BAm, brain amygdala; BAn, brain anterior cingulate cortex BA24; BCa, brain caudate basal ganglia; BCH, brain cerebellar hemisphere; BC, brain cerebellum; BCo, brain cortex; BFC, brain frontal cortex BA9; BHi, brain hippocampus; BHy, brain hypothalamus; BNu, brain nucleus accumbens basal ganglia; BPu, brain putamen basal ganglia; BSp, brain spinal cord cervical c-1; BSu, brain substantia nigra; Br, breast mammary tissue; CE, cells EBV-transformed lymphocytes; CT, cells transformed fibroblasts; CoS, colon sigmoid; CoT, colon transverse; EG, esophagus gastroesophageal junction; EMc, esophagus mucosa; EMs, esophagus muscularis; HA, heart atrial appendage; HL, heart left ventricle; Li, liver; Lu, lung; MSG, minor salivary gland; MuS, muscle skeletal; NT, nerve tibial; O, ovary; Pa, pancreas; Pi, pituitary; Pr, prostate; SN, skin not sun-exposed suprapubic; SS, skin sun-exposed lower leg; SIT, small intestine terminal ileum; Sp, spleen; St, stomach; Te, testis; Th, thyroid; U, uterus; V, vagina; B, whole blood
Fig. 2
Fig. 2
Enrichment of pMEIs in different functional genomic regions of affected genes in eQTL analysis (ae) and sQTL analysis (fj). Functional genomic regions include enhancers from the Dragon Enhancers Database (DENdb) (a, f); 10 kb upstream from the transcription starting site (TSS) (b, g), 10 kb downstream (c, h), exons (d, i), and introns of the affected gene (e, j). pMEIs were divided into three categories: NS, pMEIs that were not reported to be significantly related with any gene or ASE in any tissue; related, pMEIs that were significantly associated with at least one gene or ASE but were not reported as causal; causal, pMEIs that were reported as causal for at least one gene or ASE (see the “Methods” section for details). The bar plot shows the proportion of pMEIs in each genomic feature in each category (NS, related, or causal). Values inside the bars are fold enrichment compared to NS, and values above the bars are p value from Fisher’s exact test for significance of enrichment compared to NS. For exons in the eQTL analysis in d, the fold enrichment values are not available because the proportion of pMEIs in exon is zero in NS
Fig. 3
Fig. 3
Overview of the sQTL analysis in ME-only analysis. a Number of detected sQTLs with Benjamini-Hochberg FDR < 10% in each tissue. Bars are colored by tissue clusters based on cis-eQTL as shown in b (tree). b Similarity (Spearman’s correlation coefficient ρ) between different tissues based on cis-sQTL (lower triangle) and PSI values (upper triangle). ASE-pMEI pairs with FDR < 10% in at least one tissue are selected for the analysis. The tree was based on the hierarchical clustering of the cis-sQTL results, and the branches are colored to four groups. Tissue text colors in a and b were based on the hierarchical clustering tree of PSI results (data not shown). c The relationship between the sQTL count (FDR < 10%) and the individual count in different tissues. The axes are in log scale. d ASE-pMEI pair count and the number of tissues they were detected as significant for events internal or at the edge of the gene. Tissue text is colored by tissue clusters based on cis-sQTL in b (tree). e Effect size (beta values) distribution for ASEs internal or at the edge of different pMEIs. Tissue abbreviations are the same as in Fig. 1
Fig. 4
Fig. 4
Correlation between eQTL and sQTL analyses. a Correlation of p values of eQTLs and sQTLs. Average -log10(p values) of sQTLs were plotted against -log10(p values) of eQTLs divided in five bins. b effect size (|beta|) of sQTL versus eQTL. Average |beta| of sQTLs were plotted against eQTLs with their |beta| values divided into five bins. a, b Error bars are 95% confidence intervals. Only sQTL and eQTL pairs that shared the same gene, tissue, and pMEI were included in the analysis. c The number of pMEIs detected in the eQTL or sQTL analysis. d Count of pMEIs identified in the eQTL or sQTL analysis in different allele frequency groups. The pMEIs were divided into 10 groups based on their allele frequencies so that each group has an equal number of pMEIs
Fig. 5
Fig. 5
Experimental validation of eQTLs (a) and sQTLs (b). Gene names were labeled in the x-axis, and those underlined showed the effects in the same direction as predicted in the computational analysis. For sQTL experiments, one constitutive exon was included with the alternative exon. Results are shown for the ME-containing construct and the construct without the ME. In b, the direction of the arrow represents the strand of the ME on the chromosome. *p < 0.05, **p < 0.01, ***p < 0.001

References

    1. Bourque G, Burns KH, Gehring M, Gorbunova V, Seluanov A, Hammell M, Imbeault M, Izsvak Z, Levin HL, Macfarlan TS, et al. Ten things you should know about transposable elements. Genome Biol. 2018;19:199. - PMC - PubMed
    1. de Koning APJ, Gu WJ, Castoe TA, Batzer MA, Pollock DD. Repetitive elements may comprise over two-thirds of the human genome. PLoS Genet. 2011;7:e1002384. - PMC - PubMed
    1. Batzer MA, Deininger PL. A human-specific subfamily of Alu-sequences. Genomics. 1991;9:481–487. - PubMed
    1. Brouha B, Schustak J, Badge RM, Lutz-Prigget S, Farley AH, Moran JV, Kazazian HH. Hot L1s account for the bulk of retrotransposition in the human population. Proc Natl Acad Sci U S A. 2003;100:5280–5285. - PMC - PubMed
    1. Wang H, Xing J, Grover D, Hedges DJ, Han KD, Walker JA, Batzer MA. SVA elements: a hominid-specific retroposon family. J Mol Biol. 2005;354:994–1007. - PubMed

Publication types

LinkOut - more resources