Meta-Analysis
. 2020 Sep 2;10(9):3243-3260.
doi: 10.1534/g3.120.401534.

A Meta-Analysis of Wolbachia Transcriptomics Reveals a Stage-Specific Wolbachia Transcriptional Response Shared Across Different Hosts

Affiliations
Meta-Analysis

A Meta-Analysis of Wolbachia Transcriptomics Reveals a Stage-Specific Wolbachia Transcriptional Response Shared Across Different Hosts

Matthew Chung et al. G3 (Bethesda). .

Abstract

Wolbachia is a genus containing obligate, intracellular endosymbionts with arthropod and nematode hosts. Numerous studies have identified differentially expressed transcripts in Wolbachia endosymbionts that potentially inform the biological interplay between these endosymbionts and their hosts, albeit with discordant results. Here, we re-analyze previously published Wolbachia RNA-Seq transcriptomics data sets using a single workflow consisting of the most up-to-date algorithms and techniques, with the aim of identifying trends or patterns in the pan-Wolbachia transcriptional response. We find that data from one of the early studies in filarial nematodes did not allow for robust conclusions about Wolbachia differential expression with these methods, suggesting the original interpretations should be reconsidered. Across datasets analyzed with this unified workflow, there is a general lack of global gene regulation with the exception of a weak transcriptional response resulting in the upregulation of ribosomal proteins in early larval stages. This weak response is observed across diverse Wolbachia strains from both nematode and insect hosts suggesting a potential pan-Wolbachia transcriptional response during host development that diverged more than 700 million years ago.

Keywords: RNA-Seq; Wolbachia; bacteria; intracellular; meta-analysis; transcriptomics.


Figures

Figure 1
Figure 1
Unified workflow used for transcriptomics re-analysis For each study, reads were downloaded from their respective SRA or GEO databases and re-analyzed using the shown unified workflow including the alignment of reads to the combined host and Wolbachia references (blue), differential expression analysis (yellow), and the downstream clustering of differentially expressed genes based on expression profile (red). Tools used for each of the different steps are noted next to their respective boxes.
Figure 2
Figure 2
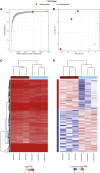
A re-analysis of the Darby et al., 2012 wOo transcriptome study (a) Rarefaction curves were calculated by determining the number of protein-coding genes detected from a random subset of reads from each sample. Each rarefaction curve is labeled by a color corresponding to a specific sample. (b) The first two components are illustrated from a principal component analysis using the log2TPM values of the 651 wOo genes analyzed in the study. Points are sized relative to the number of reads mapping to protein-coding genes. The number in parentheses next to each of the axis labels represents the percent variation individually contributed by the two principal components. The heat maps show the (c) TPM values of all protein-coding genes and the (d) z-score of the log2TPM values for all protein-coding genes that meet the edgeR expression threshold across all samples in the study. The horizontal bar above each of the heat maps indicates the respective sample for each column.
Figure 3
Figure 3
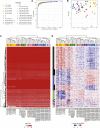
A re-analysis of the Luck et al., 2014 wDi life cycle transcriptome study (a) Rarefaction curves were calculated by determining the number of protein-coding genes detected from a random subset of reads from each sample. Each rarefaction curve is labeled by a color corresponding to a specific sample. (b) The first two components are illustrated from a principal component analysis using the log2TPM values of the 871 wDi genes analyzed in the study. Points are sized relative to the number of reads mapping to protein-coding genes. The number in parentheses next to each of the axis labels represents the percent variation individually contributed by the two principal components. The heat map shows the (c) TPM values for all protein-coding genes and the (d) z-score of the log2TPM values for all protein-coding genes across all samples in the study. The horizontal bar above each of the heat maps indicates the respective sample for each column.
Figure 4
Figure 4
A re-analysis of the Darby et al., 2014 wMel transcriptome study (a) Rarefaction curves were calculated by determining the number of protein-coding genes detected from a random subset of reads from each sample. Each rarefaction curve is labeled by a color corresponding to a specific sample. (b) The first two components are illustrated from a principal component analysis using the log2TPM values of the 1,086 wMel genes analyzed in the study. Points are sized relative to the number of reads mapping to protein-coding genes. The number in parentheses next to each of the axis labels represents the percent variation individually contributed by the two principal components. The heat maps show the (c) TPM values for all protein-coding genes passing the read cutoff and (d) the z-score of the log2TPM values for all differentially expressed genes across all samples in the study. The horizontal bar above each of the heat maps indicates the respective sample for each column. The left vertical colored bar in (d) represents the WGCNA assigned module.
Figure 5
Figure 5
A re-analysis of the Luck et al., 2015 wDi tissue transcriptome study (a) Rarefaction curves were calculated by determining the number of protein-coding genes detected from a random subset of reads from each sample. Each rarefaction curve is labeled by a color corresponding to a specific sample. (b) The first two components are illustrated from a principal component analysis using the log2TPM values of the 871 wDi genes analyzed in the study. Points are sized relative to the number of reads mapping to protein-coding genes. The number in parentheses next to each of the axis labels represents the percent variation individually contributed by the two principal components. The heat maps show the (c) TPM for all protein-coding genes passing the read cutoff and (d) the z-score of the log2TPM values for all differentially expressed genes across the adult male body wall, adult female body wall, and adult female head sample, with all other samples being excluded due to having insufficient sequencing depth. The horizontal bar above each of the heat maps indicates the respective sample for each column. The left vertical colored bar in (d) represents the WGCNA assigned module while the right vertical gray scale bar represents the major and minor partitions in each WGCNA module.
Figure 6
Figure 6
A re-analysis of the Gutzwiller et al., 2015 wMel transcriptome study (a) Rarefaction curves were calculated by determining the number of protein-coding genes detected from a random subset of reads from each sample. Each rarefaction curve is labeled by a color corresponding to a specific sample. (b) The first two components are illustrated from a principal component analysis using the log2TPM values of the 1,086 wMel protein-coding genes analyzed in the study. Points are sized relative to the number of reads mapping to protein-coding genes. The number in parentheses next to each of the axis labels represents the percent variation individually contributed by the two principal components. The heat maps show the (c) TPM values for all protein-coding genes passing the read cutoff and (d) the z-score of the log2TPM values for all differentially expressed genes across all samples in the study. The horizontal bar above each of the heat maps indicates the respective sample for each column. The left vertical colored bar in (d) represents the WGCNA assigned module while the right vertical gray scale bar represents the major and minor partitions in each WGCNA module.
Figure 7
Figure 7
A re-analysis of the Grote et al., 2017 wBm transcriptome study (a) Rarefaction curves were calculated by determining the number of protein-coding genes detected from a random subset of reads from each sample. Each rarefaction curve is labeled by a color corresponding to a specific sample. (b) The first two components are illustrated from a principal component analysis using the log2TPM values of the 839 wBm protein-coding genes analyzed in the study. Points are sized relative to the number of reads mapping to protein-coding genes. The number in parentheses next to each of the axis labels represents the percent variation individually contributed by the two principal components. The heat maps show the (c) TPM values for all protein-coding genes passing the read cutoff and (d) the z-score of the log2TPM values for all differentially expressed genes across all samples in the study. The horizontal bar above each of the heat maps indicates the respective sample for each column. The left vertical colored bar in (d) represents the WGCNA assigned module while the right vertical gray scale bar represents the major and minor partitions in each WGCNA module.
Figure 8
Figure 8
A re-analysis of the Chung et al., 2019 wBm transcriptome study (a) Rarefaction curves were calculated by determining the number of protein-coding genes detected from a random subset of reads from each sample. Each rarefaction curve is labeled by a color corresponding to a specific sample. (b) The first two components are illustrated from a principal component analysis using the log2TPM values of the 839 wBm genes analyzed in the study. Points are sized relative to the number of reads mapping to protein-coding genes. The number in parentheses next to each of the axis labels represents the percent variation individually contributed by the two principal components. The heat maps show the (c) TPM for all protein-coding genes passing the read cutoff and (d) the z-score of the log2TPM values for all differentially expressed genes across all samples in the study. The horizontal bar above each of the heat maps indicates the respective sample for each column. The left vertical colored bar in (d) represents the WGCNA assigned module while the right vertical gray scale bar represents the major and minor partitions in each WGCNA module.
Figure 9
Figure 9
UpSet plot of core Wolbachia genes across transcriptomics data sets An UpSet plot was generated from the differentially expressed core Wolbachia genes from each study. The bottom left shows a horizontal bar plot indicative of the number of differentially expressed core Wolbachia genes identified in our re-analysis. The larger vertical bar plot indicates the number of differentially expressed core genes in the studies indicated by the nodes under the x-axis. Yellow bars are indicative of gene subsets that contain significantly over-represented functional terms while blue bars are indicative of gene subsets that contain genes of interest.

References

    1. Anders S., Pyl P. T., and Huber W., 2015. HTSeq–a Python framework to work with high-throughput sequencing data. Bioinformatics 31: 166–169. 10.1093/bioinformatics/btu638 - DOI - PMC - PubMed
    1. Badawi M., Giraud I., Vavre F., Greve P., and Cordaux R., 2014. Signs of neutralization in a redundant gene involved in homologous recombination in Wolbachia endosymbionts. Genome Biol. Evol. 6: 2654–2664. 10.1093/gbe/evu207 - DOI - PMC - PubMed
    1. Celniker S. E., Dillon L. A., Gerstein M. B., Gunsalus K. C., Henikoff S. et al. , 2009. Unlocking the secrets of the genome. Nature 459: 927–930. 10.1038/459927a - DOI - PMC - PubMed
    1. Chen Y., Lun A. T., and Smyth G. K., 2016. From reads to genes to pathways: differential expression analysis of RNA-Seq experiments using Rsubread and the edgeR quasi-likelihood pipeline. F1000 Res. 5: 1438. - PMC - PubMed
    1. Choi Y. J., Aliota M. T., Mayhew G. F., Erickson S. M., and Christensen B. M., 2014. Dual RNA-seq of parasite and host reveals gene expression dynamics during filarial worm-mosquito interactions. PLoS Negl. Trop. Dis. 8: e2905 10.1371/journal.pntd.0002905 - DOI - PMC - PubMed

Publication types

LinkOut - more resources