Comparative Study
. 2020 Jul;30(7):951-961.
doi: 10.1101/gr.255679.119. Epub 2020 Jul 27.

Comparative transcriptomics of primary cells in vertebrates

Affiliations
Comparative Study

Comparative transcriptomics of primary cells in vertebrates

Tanvir Alam et al. Genome Res. 2020 Jul.

Abstract

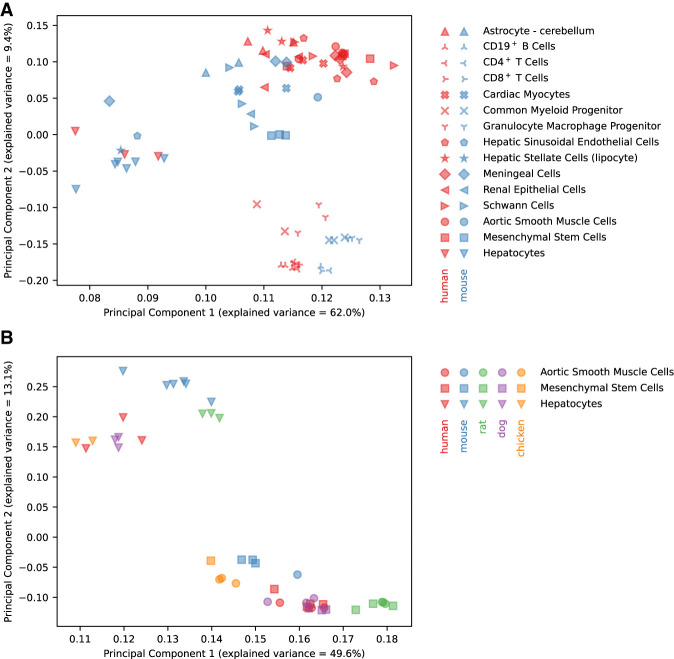
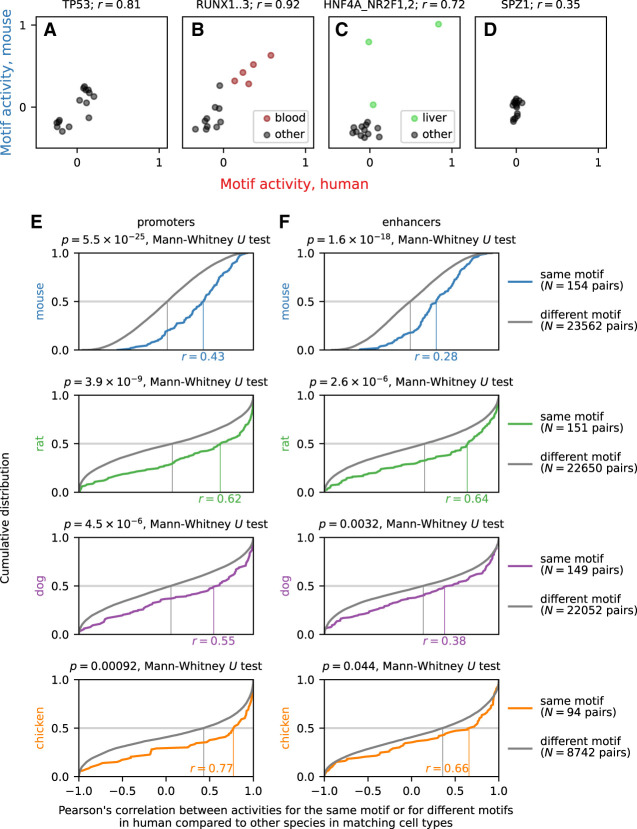
Gene expression profiles in homologous tissues have been observed to be different between species, which may be due to differences between species in the gene expression program in each cell type, but may also reflect differences in cell type composition of each tissue in different species. Here, we compare expression profiles in matching primary cells in human, mouse, rat, dog, and chicken using Cap Analysis Gene Expression (CAGE) and short RNA (sRNA) sequencing data from FANTOM5. While we find that expression profiles of orthologous genes in different species are highly correlated across cell types, in each cell type many genes were differentially expressed between species. Expression of genes with products involved in transcription, RNA processing, and transcriptional regulation was more likely to be conserved, while expression of genes encoding proteins involved in intercellular communication was more likely to have diverged during evolution. Conservation of expression correlated positively with the evolutionary age of genes, suggesting that divergence in expression levels of genes critical for cell function was restricted during evolution. Motif activity analysis showed that both promoters and enhancers are activated by the same transcription factors in different species. An analysis of expression levels of mature miRNAs and of primary miRNAs identified by CAGE revealed that evolutionary old miRNAs are more likely to have conserved expression patterns than young miRNAs. We conclude that key aspects of the regulatory network are conserved, while differential expression of genes involved in cell-to-cell communication may contribute greatly to phenotypic differences between species.


Figures

Figure 1.
Figure 1.
Gene expression PCA. (A) PCA for all samples of cell types in common between human and mouse. (B) PCA for all samples of cell types in common between all five species.
Figure 2.
Figure 2.
Differential gene expression analysis. (A) Expression profile of HNF4A, ELF2, and FOXO1 as examples of genes with an expression profile highly correlated across cell types between species but with significant expression level differences between species in specific cell types. (B) Cumulative distribution of Pearson's correlation r across cell types in gene expression between human and mouse, rat, dog, or chicken. The number N of expressed orthologous genes included in the distribution is shown in the vertical axis label, and the estimated median value of r is indicated on the horizontal axis of each graph. The background distribution of r obtained by randomizing genes (solid curve) or randomizing samples (dashed curve) as well as the theoretical background distribution of r for an uncorrelated bivariate normal distribution (dotted curve) are shown in gray; the latter two largely coincide. The statistical significance was calculated using the Mann–Whitney U test comparing Pearson's correlation values for orthologs to the background distribution of r for randomly paired genes between human and mouse, rat, dog, or chicken. Note that the median correlation values are not directly comparable between species, as the sets of orthologous genes are different. (C) Differential gene expression analysis of orthologous genes in human compared to mouse, rat, dog, and chicken. The red and blue bars correspond to the percentage of expressed orthologous genes with significantly (Benjamini–Hochberg corrected P < 0.1) higher and lower expression, respectively, in human compared to mouse, rat, dog, or chicken. The number N of orthologous genes expressed in each cell type is shown on the right.
Figure 3.
Figure 3.
Promoter analysis of differentially expressed genes. (A) Percentage of genes in mouse, rat, dog, and chicken for which the dominant promoter was located in a genome region that had an orthologous genome region in human, and the percentage that the orthologous region contained the dominant promoter for the orthologous gene in human. (B) Percentage of differentially expressed genes in each cell type depending on whether the genomic region of the dominant promoter in each species had an orthologous genomic region in the human genome. The one-sided P-value calculated using Fisher's exact test is shown on the right, together with the number N of expressed genes in each cell type.
Figure 4.
Figure 4.
Conservation and Gene Ontology analysis of differentially expressed genes. (A) Percentage of differentially expressed genes in each cell type as a function of age of the most recent common ancestor. The one-sided P-value of a Poisson regression model against the evolutionary age category is shown on the right, together with the number N of expressed genes in each cell type with an annotation in the NCBI HomoloGene database. (B) Gene Ontology analysis of differentially expressed genes. The P-value, calculated using Fisher's exact test, of overrepresentation or underrepresentation of differentially expressed genes in each Gene Ontology category compared to an expression-matched set of background genes is shown in red and blue, respectively.
Figure 5.
Figure 5.
Motif Activity analysis. (AD) Examples of calculated motif activities in human and mouse for motifs associated with the broadly expressed transcription factor TP53 (A), the hematopoietic lineage-specific RUNX transcription factors (B), the hepatocyte-specific HNF4A transcription factor (C), and the testis-specific transcription factor SPZ1 (D). Each of the 15 matching cell types between human and mouse is shown as a dot. The blood cell types CD19+ B cells, CD4+ T cells, CD8+ T cells, common myeloid progenitors, and granulocyte macrophage progenitors are shown in red for the RUNX motif, and the liver cell types hepatic sinusoidal endothelial cells, hepatic stellate cells (lipocytes), and hepatocytes are shown in green for the motif associated with HNF4A. (E,F) Cumulative distribution of Pearson's correlation r across cell types in motif activity for promoters (E) and enhancers (F) between human and mouse, rat, dog, and chicken. The estimated median value of r is indicated on the horizontal axis of each graph. As a background distribution, we calculated the same correlation between pairs of different motifs in human and mouse, rat, dog, and chicken. The Mann–Whitney U test P-value comparing the actual correlation values to the correlation values of the background distribution is shown for each comparison.
Figure 6.
Figure 6.
Differential miRNA expression analysis. (A) Differential expression analysis of miRNAs using FANTOM5 sRNA sequencing data in aortic smooth muscle cells in human compared to mouse, rat, dog, or chicken. The red and blue bars correspond to the percentage of expressed orthologous miRNAs with significantly (Benjamini–Hochberg corrected P < 0.1) higher and lower expression, respectively, in human compared to mouse, rat, dog, or chicken. The number N of expressed orthologous miRNAs in each comparison is shown on the right. (B) Differential expression analysis of miRNAs in human compared to mouse, rat, dog, and chicken; using CAGE expression of the pri-miRNA as a proxy for the expression level of the mature miRNA. The red and blue bars correspond to the percentage of expressed orthologous miRNAs with significantly (Benjamini–Hochberg corrected P < 0.1) higher and lower expression, respectively, in human compared to mouse, rat, dog, or chicken. The number N of expressed orthologous miRNAs in each comparison is shown on the right. (C) Percentage of miRNAs differentially expressed in each comparison, separately based on the evolutionary age of each miRNA. The one-sided P-value of a Poisson regression model against the evolutionary age category is shown on the right, together with the number N of expressed orthologous miRNAs in each comparison. (D) Percentage of miRNAs differentially expressed in each comparison, separately based on the evolutionary age of each miRNA; using CAGE expression of the pri-miRNA as a proxy for the expression level of the mature miRNA. The one-sided P-value of a Poisson regression model against the evolutionary age category is shown on the right, together with the number N of expressed orthologous miRNAs in each comparison.

References

    1. Abugessaisa I, Noguchi S, Hasegawa A, Harshbarger J, Kondo A, Lizio M, Severin J, Carninci P, Kawaji H, Kasukawa T. 2017. FANTOM5 CAGE profiles of human and mouse reprocessed for GRCh38 and GRCm38 genome assemblies. Sci Data 4: 170107 10.1038/sdata.2017.107 - DOI - PMC - PubMed
    1. Andersson R, Gebhard C, Miguel-Escalada I, Hoof I, Bornholdt J, Boyd M, Chen Y, Zhao X, Schmidl C, Suzuki T, et al. 2014. An atlas of active enhancers across human cell types and tissues. Nature 507: 455–461. 10.1038/nature12787 - DOI - PMC - PubMed
    1. Arendt D. 2008. The evolution of cell types in animals: emerging principles from molecular studies. Nat Rev Genet 9: 868–882. 10.1038/nrg2416 - DOI - PubMed
    1. Arendt D, Musser JM, Baker CVH, Bergman A, Cepko C, Erwin DH, Pavlicev M, Schlosser G, Widder S, Laubichler MD, et al. 2016. The origin and evolution of cell types. Nat Rev Genet 17: 744–757. 10.1038/nrg.2016.127 - DOI - PubMed
    1. Arner E, Daub CO, Vitting-Seerup K, Andersson R, Lilje B, Drabløs F, Lennartsson A, Rönnerblad M, Hrydziuszko O, Vitezic M, et al. 2015. Transcribed enhancers lead waves of coordinated transcription in transitioning mammalian cells. Science 347: 1010–1014. 10.1126/science.1259418 - DOI - PMC - PubMed

Publication types

LinkOut - more resources