. 2020 Jul;30(7):1060-1072.
doi: 10.1101/gr.254219.119. Epub 2020 Jul 27.

Functional annotation of human long noncoding RNAs via molecular phenotyping

Jordan A Ramilowski #  1   2 Chi Wai Yip #  1   2 Saumya Agrawal  1   2 Jen-Chien Chang  1   2 Yari Ciani  3 Ivan V Kulakovskiy  4   5 Mickaël Mendez  6 Jasmine Li Ching Ooi  2 John F Ouyang  7 Nick Parkinson  8 Andreas Petri  9 Leonie Roos  10   11 Jessica Severin  1   2 Kayoko Yasuzawa  1   2 Imad Abugessaisa  1   2 Altuna Akalin  12 Ivan V Antonov  13 Erik Arner  1   2 Alessandro Bonetti  2 Hidemasa Bono  14 Beatrice Borsari  15 Frank Brombacher  16   17 Christopher JF Cameron  18   19   20 Carlo Vittorio Cannistraci  21   22 Ryan Cardenas  23 Melissa Cardon  1 Howard Chang  24 Josée Dostie  19 Luca Ducoli  25 Alexander Favorov  26   27 Alexandre Fort  2 Diego Garrido  15 Noa Gil  28 Juliette Gimenez  29 Reto Guler  16   17 Lusy Handoko  2 Jayson Harshbarger  2 Akira Hasegawa  1   2 Yuki Hasegawa  2 Kosuke Hashimoto  1   2 Norihito Hayatsu  1 Peter Heutink  30 Tetsuro Hirose  31 Eddie L Imada  27 Masayoshi Itoh  2   32 Bogumil Kaczkowski  1   2 Aditi Kanhere  23 Emily Kawabata  2 Hideya Kawaji  32 Tsugumi Kawashima  1   2 S Thomas Kelly  1 Miki Kojima  1   2 Naoto Kondo  2 Haruhiko Koseki  1 Tsukasa Kouno  1   2 Anton Kratz  2 Mariola Kurowska-Stolarska  33 Andrew Tae Jun Kwon  1   2 Jeffrey Leek  27 Andreas Lennartsson  34 Marina Lizio  1   2 Fernando López-Redondo  1   2 Joachim Luginbühl  1   2 Shiori Maeda  1 Vsevolod J Makeev  26   35 Luigi Marchionni  27 Yulia A Medvedeva  13   35 Aki Minoda  1   2 Ferenc Müller  23 Manuel Muñoz-Aguirre  15 Mitsuyoshi Murata  1   2 Hiromi Nishiyori  1   2 Kazuhiro R Nitta  1   2 Shuhei Noguchi  1   2 Yukihiko Noro  2 Ramil Nurtdinov  15 Yasushi Okazaki  1   2 Valerio Orlando  36 Denis Paquette  19 Callum J C Parr  1 Owen J L Rackham  7 Patrizia Rizzu  30 Diego Fernando Sánchez Martinez  27 Albin Sandelin  37 Pillay Sanjana  23 Colin A M Semple  38 Youtaro Shibayama  1   2 Divya M Sivaraman  1   2 Takahiro Suzuki  1   2 Suzannah C Szumowski  2 Michihira Tagami  1   2 Martin S Taylor  38 Chikashi Terao  1 Malte Thodberg  37 Supat Thongjuea  2 Vidisha Tripathi  39 Igor Ulitsky  28 Roberto Verardo  3 Ilya E Vorontsov  26 Chinatsu Yamamoto  2 Robert S Young  40 J Kenneth Baillie  8 Alistair R R Forrest  1   2   41 Roderic Guigó  15   42 Michael M Hoffman  43 Chung Chau Hon  1   2 Takeya Kasukawa  1   2 Sakari Kauppinen  9 Juha Kere  34   44 Boris Lenhard  10   11   45 Claudio Schneider  3   46 Harukazu Suzuki  1   2 Ken Yagi  1   2 Michiel J L de Hoon  1   2 Jay W Shin  1   2 Piero Carninci  1   2
Affiliations

Functional annotation of human long noncoding RNAs via molecular phenotyping

Jordan A Ramilowski et al. Genome Res. 2020 Jul.

Abstract

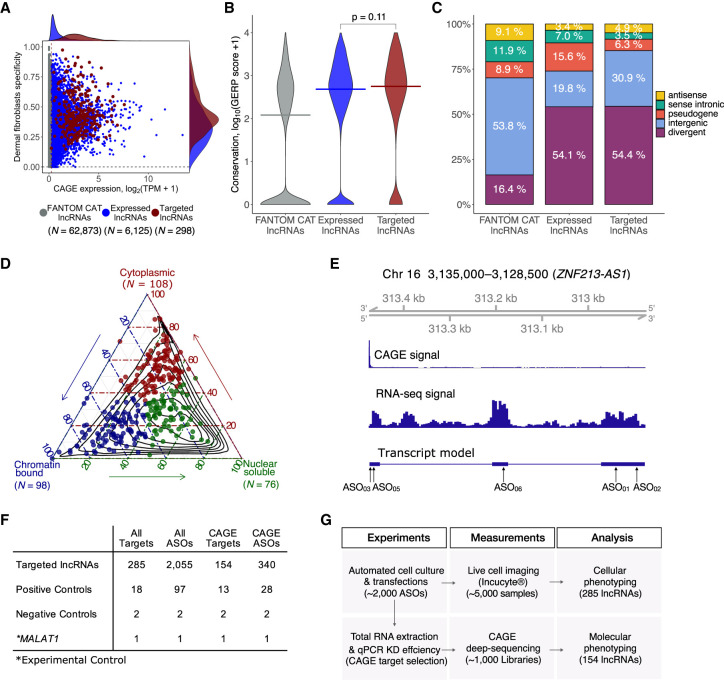
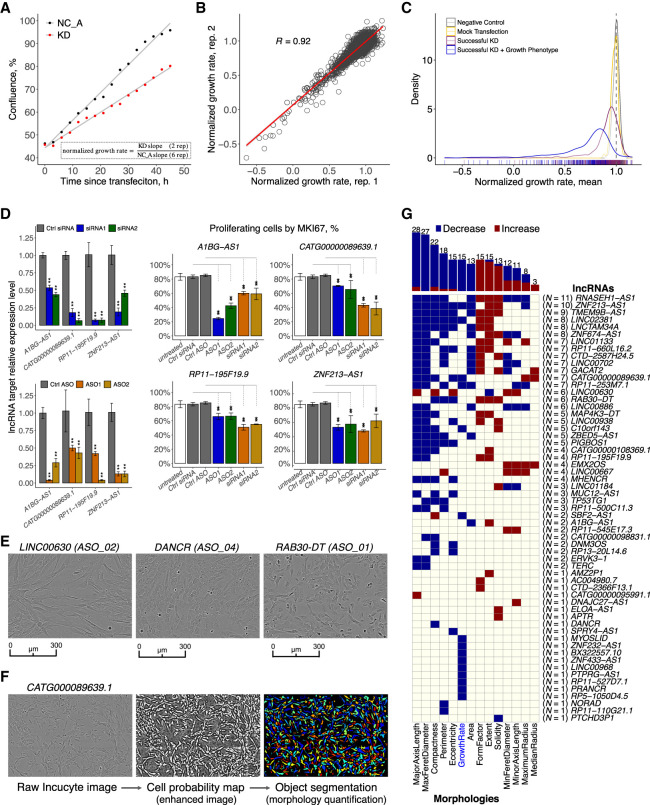
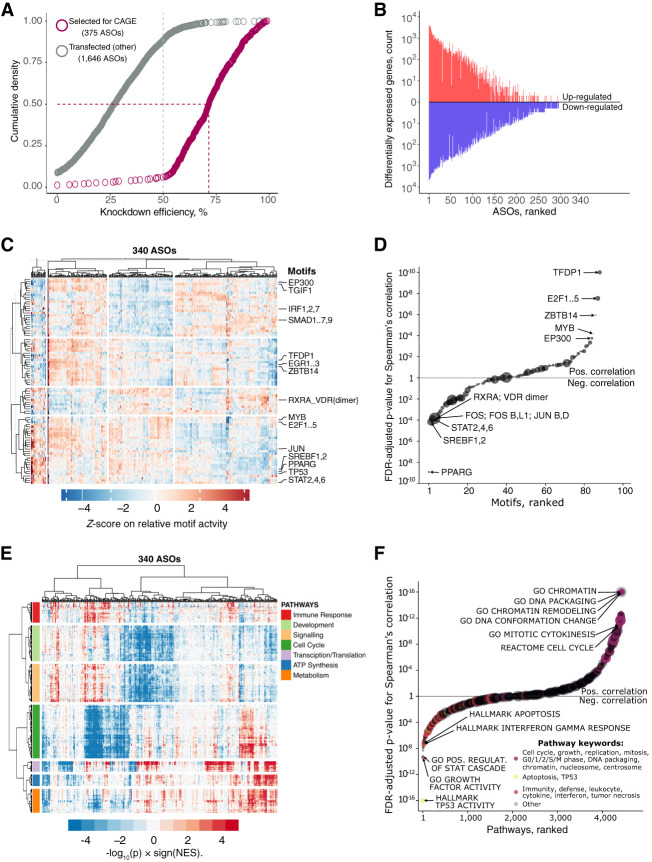
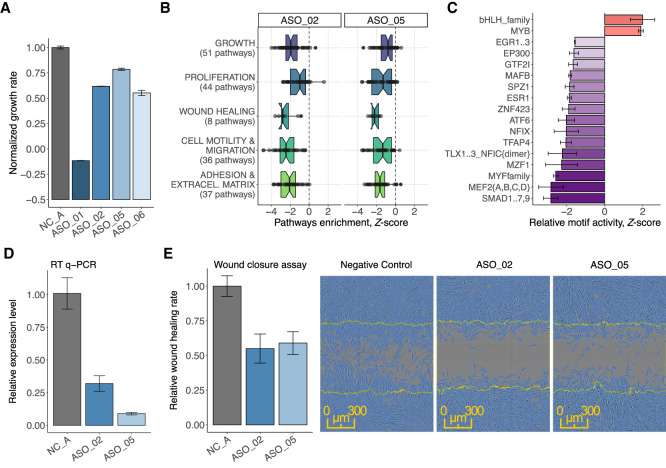
Long noncoding RNAs (lncRNAs) constitute the majority of transcripts in the mammalian genomes, and yet, their functions remain largely unknown. As part of the FANTOM6 project, we systematically knocked down the expression of 285 lncRNAs in human dermal fibroblasts and quantified cellular growth, morphological changes, and transcriptomic responses using Capped Analysis of Gene Expression (CAGE). Antisense oligonucleotides targeting the same lncRNAs exhibited global concordance, and the molecular phenotype, measured by CAGE, recapitulated the observed cellular phenotypes while providing additional insights on the affected genes and pathways. Here, we disseminate the largest-to-date lncRNA knockdown data set with molecular phenotyping (over 1000 CAGE deep-sequencing libraries) for further exploration and highlight functional roles for ZNF213-AS1 and lnc-KHDC3L-2.


Figures

Figure 1.
Figure 1.
Selection of lncRNA targets, their properties, and the study overview. (A) CAGE expression levels at log2TPM (tags per million) and human dermal fibroblasts (HDFs) specificity of lncRNAs in the FANTOM CAT catalog (Hon et al. 2017) (N = 62,873; gray), lncRNAs expressed in HDFs (N = 6125; blue), and targeted lncRNAs (N = 285; red). The dashed vertical line indicates most lowly expressed lncRNA target (∼0.2 TPM). (B) Gene conservation levels of lncRNAs in the FANTOM CAT catalog (gray), lncRNAs expressed in HDFs (blue), and targeted lncRNAs (red). Crossbars indicate the median. No significant difference is observed when comparing targeted and expressed in HDF lncRNAs (Wilcoxon P = 0.11). (C) Similar to that in B but for genomic classes of lncRNAs. Most of the targeted lncRNAs and those expressed in HDFs are expressed from divergent promoters. (D) Subcellular localization (based on relative abundances from RNA-seq fractionation data) for targeted lncRNAs. Chromatin-bound (N = 98; blue); nuclear soluble (N = 76; green); cytoplasmic (N = 108; red). Black contours represent the distribution of all lncRNAs expressed in HDFs. (E) Example of ZNF213-AS1 loci showing transcript model, CAGE, and RNA-seq signal along with targeting ASOs. (F) Number of ASOs for target lncRNAs and controls used in the experiment. (G) Schematics of the study.
Figure 2.
Figure 2.
Cell growth and morphology assessment. (A) Selected example (PTPRG1-AS1) showing the normalized growth rate estimation using a matching NC_A (negative control). (B) Correlation of the normalized growth rate for technical duplicates across 2456 Incucyte samples. (C) Density distribution of normalized growth rates (technical replicates averaged) 252 ASOs targeting lncRNAs with successful knockdown (KD) and growth phenotype (blue) consistent in two replicates (FDR < 0.05 as compared to matching NC_A; 246 ASOs inhibited growth), 627 ASOs targeting lncRNAs with successful KD (purple), 270 negative control (NC_A) samples (gray), and 90 mock-transfected cells (Lipofectamine only) samples (yellow). (D) MKI67 staining (growth inhibition validation) for four selected lncRNA targets after siRNA and ASOs suppression. (E) Incucyte cell images of selected distinct cell morphologies changes upon an lncRNA KD. (F) An overview of the cell morphology imaging processing pipeline using a novel lncRNA target, CATG000089639.1, as an example. (G) lncRNAs (N = 59) significantly (FDR < 0.05) and consistently (after adjusting for the number of successfully targeting ASOs) affecting cell growth (N = 15) and cell morphologies (N = 44).
Figure 3.
Figure 3.
CAGE predicts cellular phenotypes. (A) RT-qPCR knockdown efficiency for 2021 ASO-transfected samples (targeted lncRNAs only). Gray dashed line indicates 50% KD efficiency generally required for CAGE selection. Purple dashed lines indicate median KD efficiency (71.5%) for 375 ASOs selected for CAGE sequencing. After quality control, 340 ASOs targeting lncRNAs were included for further analysis. (B) Distribution of significantly differentially expressed genes (up-regulated: FDR < 0.05, Z-score > 1.645, log2FC > 0.5; and down-regulated: FDR < 0.05, Z-score < −1.645, log2FC < −0.5) across all 340 ASOs. (C) Motif Response Activity Analysis (MARA) across 340 ASOs. Scale indicates Z-score of the relative motif activity (the range was set to abs[Z-score] = <5 for visualization purposes). (D) Correlation between normalized growth rate and motif activities across 340 ASOs targeting lncRNAs with highlighted examples. Motif sizes shown are scaled based on the HDF expression of their associated TFs (range 1 to ∼600 TPM). (E) Enriched biological pathways across 340 ASOs. Scale indicates GSEA enrichment value calculated as −log10(p) × sign(NES). (F) Same as in D but for selected GSEA pathways. Pathways sizes are scaled based on the number of associated genes.
Figure 4.
Figure 4.
ZNF213-AS1 regulates cell growth, migration, and proliferation. (A) Normalized growth rate across four distinct ASOs (in duplicate) targeting ZNF213-AS1 as compared to six negative control samples (shown in gray). (B) Enrichment of biological pathways associated with growth, proliferation, wound healing, migration, and adhesion for ASO_02 and ASO_05. (C) Most consistently down- and up-regulated transcription factor binding motifs including those for transcription factors known to modulate growth, migration, and proliferation such as for example EGR family, EP300, GTF2I. (D) Knockdown efficiency measured by RT-qPCR after wound closure assay (72 h posttransfection) showing sustained suppression (65%–90%) of ZNF213-AS1. (E) Transfected, replated, and mitomycin C (5 µg/mL)-treated HDF cells were scratched and monitored in the Incucyte imaging system. Relative wound closure rate calculated during the 24 h postscratching shows 40%–45% reduction for the two targeting ASOs (ASO_02 [N = 10] and ASO_05 [N = 13]) as compared to NC_A transfection controls (N = 33, shown in gray) and the representative images of wound closure assay 16 h postscratching.
Figure 5.
Figure 5.
RP11-398K22.12 down-regulates KCNQ5 and CATG00000088862.1 in cis. (A) Changes in expression levels of detectable genes in the same topologically associated domain (TAD) as RP11-398K22.12 based on Hi-C analysis. Both KCNQ5 and CATG00000088862.1 are down-regulated (P < 0.05) upon the knockdown of RP11-398K22.12 by two independent ASOs in CAGE analysis (left) as further confirmed with RT-qPCR (right). (B) (Top) Representation of the chromatin conformation in the 4-Mb region proximal to the TAD containing RP11-398K22.12, followed by the locus gene annotation, CAGE, RNA-seq, and ATAC-seq data for native HDFs. (Bottom) Schematic diagram showing Hi-C predicted contacts of RP11-398K22.12 (blue) and KCNQ5 (gray) (25-kb resolution, frequency ≥ 5) in HDF cells. Red line indicates RP11-398K22.12 and KCNQ5 contact. (C) FISH image for RP11-398K22.12, suggesting proximal regulation. TUG1 FISH image (suggesting trans regulation) is included as a comparison; (bar = 10 µm). (D) GTEx atlas across 54 tissues (N = 9662 samples) shows relatively high expression levels of RP11-398K22.12 in 13 distinct brain regions samples (highlighted). (E) Expression correlation for RP11-398K22.12 and KCNQ5 in eight out of 13 distinct brain regions, as highlighted in D. (F) Expression correlation for RP11-398K22.12 and CATG00000088862.1 in eight out of 13 distinct brain regions, as highlighted in D.

References

    1. Ambasudhan R, Talantova M, Coleman R, Yuan X, Zhu S, Lipton SA, Ding S. 2011. Direct reprogramming of adult human fibroblasts to functional neurons under defined conditions. Cell Stem Cell 9: 113–118. 10.1016/j.stem.2011.07.002 - DOI - PMC - PubMed
    1. Bai J, Yao B, Wang L, Sun L, Chen T, Liu R, Yin G, Xu Q, Yang W. 2019. lncRNA A1BG-AS1 suppresses proliferation and invasion of hepatocellular carcinoma cells by targeting miR-216a-5p. J Cell Biochem 120: 10310–10322. 10.1002/jcb.28315 - DOI - PubMed
    1. Berg S, Kutra D, Kroeger T, Straehle CN, Kausler BX, Haubold C, Schiegg M, Ales J, Beier T, Rudy M, et al. 2019. ilastik: interactive machine learning for (bio)image analysis. Nat Methods 16: 1226–1232. 10.1038/s41592-019-0582-9 - DOI - PubMed
    1. Carninci P, Kasukawa T, Katayama S, Gough J, Frith MC, Maeda N, Oyama R, Ravasi T, Lenhard B, Wells C, et al. 2005. The transcriptional landscape of the mammalian genome. Science 309: 1559–1563. 10.1126/science.1112014 - DOI - PubMed
    1. Carpenter AE, Jones TR, Lamprecht MR, Clarke C, Kang I, Friman O, Guertin DA, Chang J, Lindquist RA, Moffat J, et al. 2006. CellProfiler: image analysis software for identifying and quantifying cell phenotypes. Genome Biol 7: R100 10.1186/gb-2006-7-10-r100 - DOI - PMC - PubMed

Publication types

MeSH terms