. 2020 Aug 11;117(32):19376-19387.
doi: 10.1073/pnas.2000047117. Epub 2020 Jul 27.

Microbial tryptophan metabolites regulate gut barrier function via the aryl hydrocarbon receptor

Affiliations

Microbial tryptophan metabolites regulate gut barrier function via the aryl hydrocarbon receptor

Samantha A Scott et al. Proc Natl Acad Sci U S A. .

Abstract

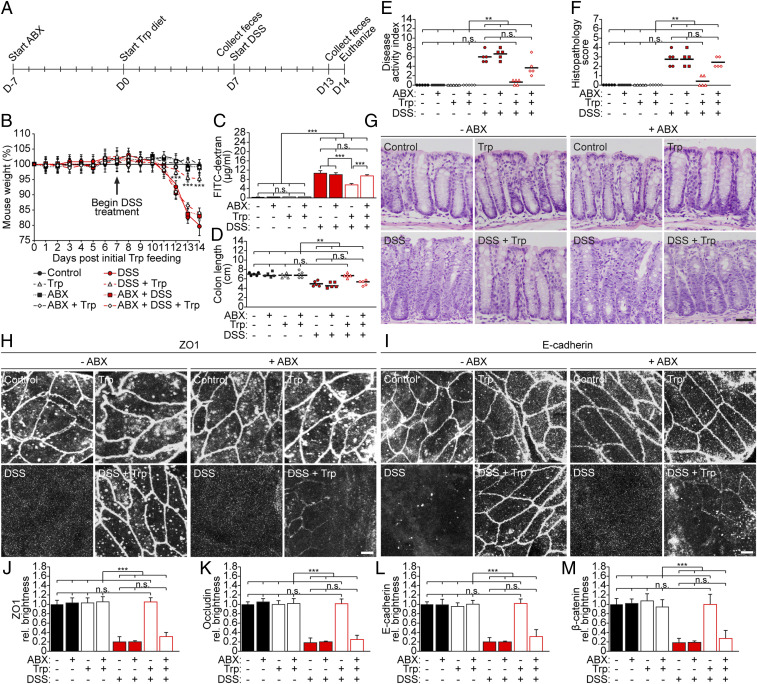
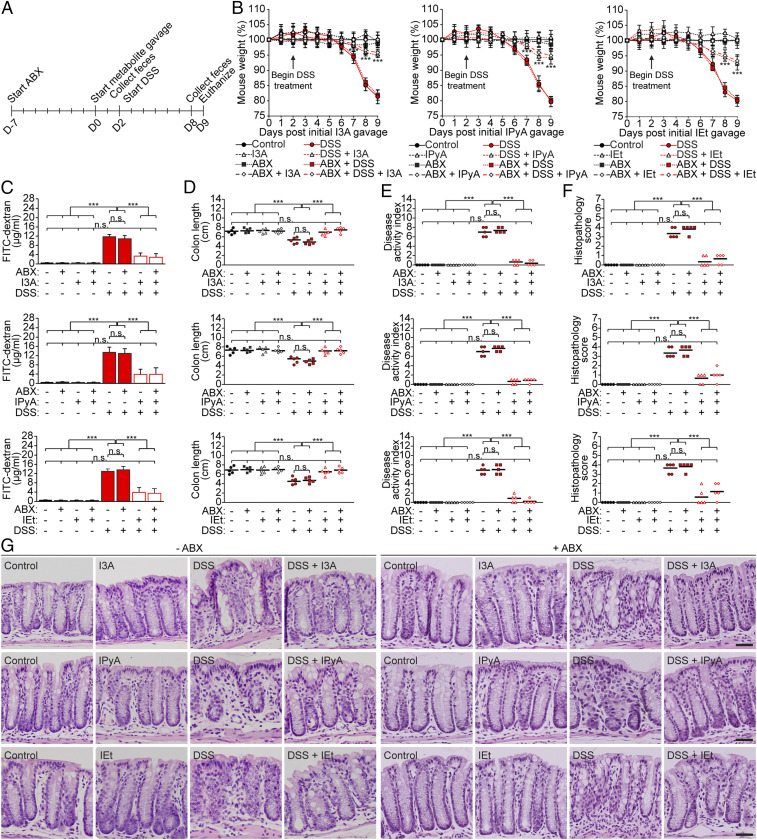
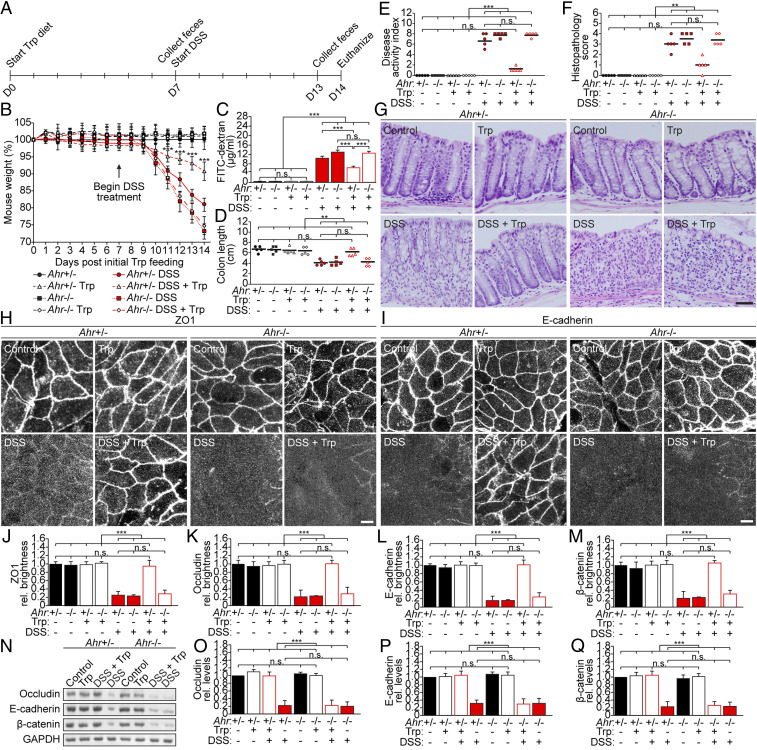
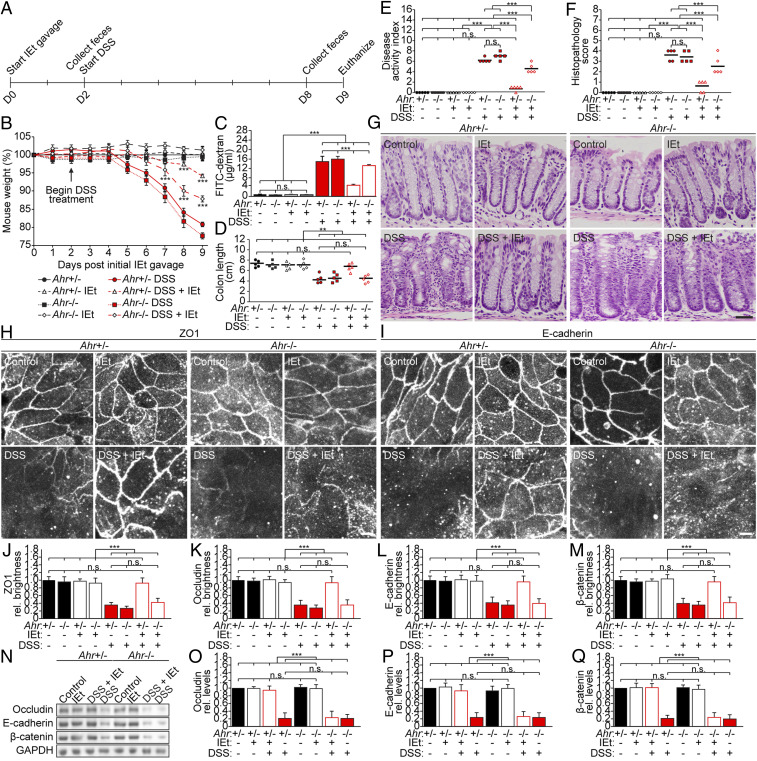
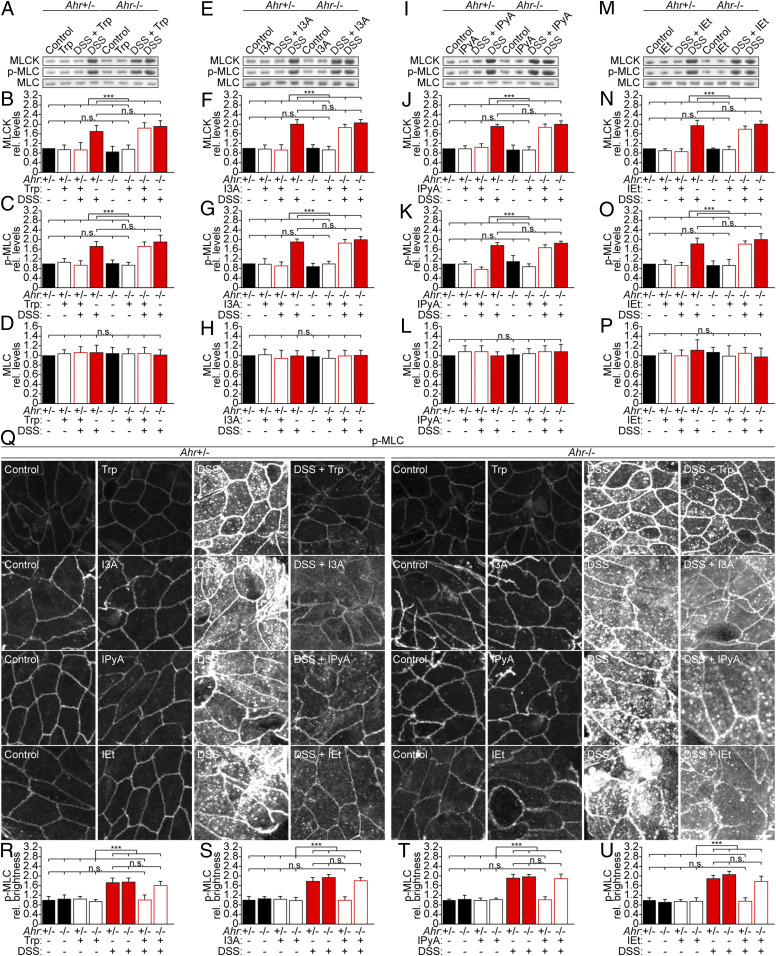
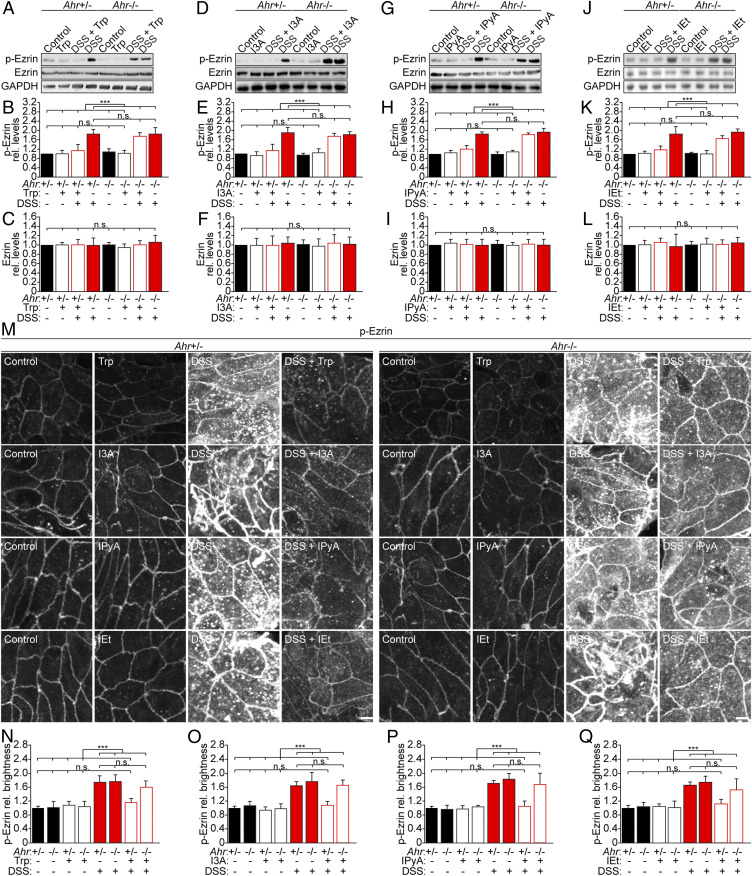
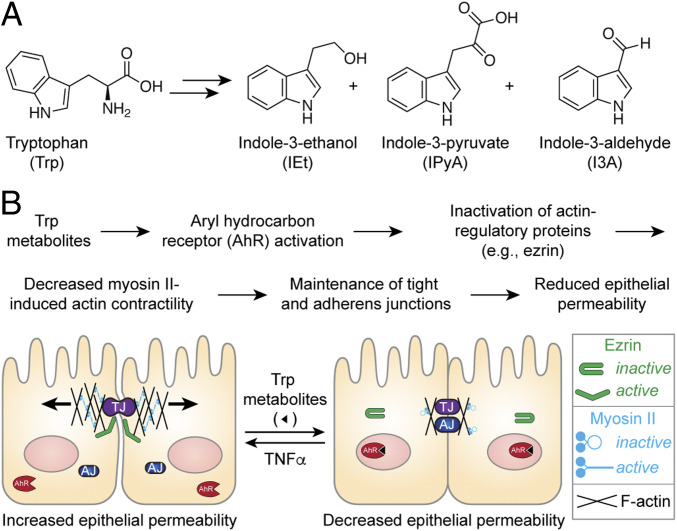
Inflammatory bowel diseases (IBDs), including Crohn's disease and ulcerative colitis, are associated with dysbiosis of the gut microbiome. Emerging evidence suggests that small-molecule metabolites derived from bacterial breakdown of a variety of dietary nutrients confer a wide array of host benefits, including amelioration of inflammation in IBDs. Yet, in many cases, the molecular pathways targeted by these molecules remain unknown. Here, we describe roles for three metabolites-indole-3-ethanol, indole-3-pyruvate, and indole-3-aldehyde-which are derived from gut bacterial metabolism of the essential amino acid tryptophan, in regulating intestinal barrier function. We determined that these metabolites protect against increased gut permeability associated with a mouse model of colitis by maintaining the integrity of the apical junctional complex and its associated actin regulatory proteins, including myosin IIA and ezrin, and that these effects are dependent on the aryl hydrocarbon receptor. Our studies provide a deeper understanding of how gut microbial metabolites affect host defense mechanisms and identify candidate pathways for prophylactic and therapeutic treatments for IBDs.

Keywords: colitis; gut microbiome; inflammatory bowel disease; intestinal epithelium.


Conflict of interest statement

The authors declare no competing interest.

Figures

Fig. 1.
Fig. 1.
Dietary Trp ameliorates a mouse model of colitis in a microbiome-dependent manner. (A) C57BL/6 mice were pretreated with antibiotics (ABX: ampicillin [9 mg/kg], metronidazole [9 mg/kg], neomycin [9 mg/kg], and vancomycin [4.5 mg/kg], intragastrically) for 7 d and then fed a Trp-rich diet (42 g Trp/kg diet) or standard chow (2 g Trp/kg diet) for 7 d, followed by administration of DSS (3%, wt/vol) or vehicle for 7 d (ad libitum) with continued antibiotic treatment and Trp feeding. (B) The mice were weighed daily. (C) Mice were orally gavaged with FITC-dextran (900 mg/kg) on day 14, and serum levels of FITC-dextran were measured 4 h later. (D) On day 14, the mice were killed, and colon lengths were measured, (E) disease activity index was measured, and (F and G) the distal colon was stained with hematoxylin and eosin (H&E) and blindly scored (0 = none, 1 = very mild, 2 = mild, 3 = moderate, 4 = severe) for epithelial damage, mononuclear and polymorphonuclear infiltrate, and submucosal edema. (Scale bar: 50 μm.) (HM) Colon sections were stained for TJ and AJ proteins and imaged by confocal microscopy (see also SI Appendix, Fig. S1, for occludin and β-catenin). (Scale bars: 20 μm.) (JM) Relative (rel.) brightness of images with error as SD from the mean was calculated (n = 15). (H and J) ZO1. (I and L) E-cadherin. (K) Occludin. (M) β-catenin. Data are representative of at least three independent experiments; n = 5 mice per group. One-way ANOVA followed by post hoc Tukey’s test: **P < 0.01, ***P < 0.001, n.s.: not significant.
Fig. 2.
Fig. 2.
Tryptophan metabolites I3A, IPyA, and IEt ameliorate a mouse model of colitis. (A) C57BL/6 mice were pretreated with antibiotics (ABX: ampicillin [9 mg/kg], metronidazole [9 mg/kg], neomycin [9 mg/kg], and vancomycin [4.5 mg/kg], intragastrically) for 7 d, followed by I3A (1,000 mg/kg), IPyA (2,900 mg/kg), or IEt (600 mg/kg) for 2 d and then administered DSS (3%, wt/vol) for 7 d (ad libitum) with continued antibiotic and metabolite treatment. (B) The mice were weighed daily. (C) Mice were orally gavaged with FITC-dextran (900 mg/kg) on day 9, and serum levels of FITC-dextran were measured 4 h later. (D) On day 9, the mice were killed, and colon lengths were measured, (E) disease activity index was measured, and (F and G) the distal colon was stained with H&E and blindly scored (0 = none, 1 = very mild, 2 = mild, 3 = moderate, 4 = severe) for epithelial damage, mononuclear and polymorphonuclear infiltrate, and submucosal edema. (Scale bar: 50 μm.) Data are representative of at least three independent experiments; n = 5 mice per group. One-way ANOVA followed by post hoc Tukey’s test: ***P < 0.001, n.s.: not significant.
Fig. 3.
Fig. 3.
Effect of a high-Trp diet in a mouse model of colitis is dependent on AhR. (A) Ahr+/− or Ahr−/− mice were fed a Trp-rich diet (42 g Trp/kg diet) or standard chow (2 g Trp/kg diet) for 7 d, followed by administration of DSS (3%, wt/vol) or vehicle for 7 d (ad libitum) with continued Trp feeding. (B) The mice were weighed daily. (C) Mice were orally gavaged with FITC-dextran (900 mg/kg) on day 14, and serum levels of FITC-dextran were measured 4 h later. (D) On day 14, the mice were killed, and colon lengths were measured, (E) disease activity index was measured, and (F and G) the distal colon was stained with H&E and blindly scored (0 = none, 1 = very mild, 2 = mild, 3 = moderate, 4 = severe) for epithelial damage, mononuclear and polymorphonuclear infiltrate, and submucosal edema. (Scale bar: 50 μm.) (HM) Colon sections were stained for TJ and AJ proteins and imaged by confocal microscopy (see also SI Appendix, Fig. S17, for occludin and β-catenin). (Scale bars: 20 μm.) (JM) Relative (rel.) brightness of images with error as SD from the mean was calculated (n = 15). (H and J) ZO1. (I and L) E-cadherin. (K) Occludin. (M) β-catenin. (NQ) TJ and AJ protein levels were determined by Western blotting with the indicated antibodies and (OQ) quantified by densitometry (n = 3). Data are representative of at least three independent experiments; n = 5 mice per group. One-way ANOVA followed by post hoc Tukey’s test: **P < 0.01, ***P < 0.001, n.s.: not significant.
Fig. 4.
Fig. 4.
Effect of tryptophan metabolite IEt in mouse model of colitis is dependent on AhR. (A) Ahr+/− or Ahr−/− mice were pretreated with IEt (600 mg/kg) for 2 d and then administered DSS (3%, wt/vol) for 7 d (ad libitum) with continued metabolite treatment. (B) The mice were weighed daily. (C) Mice were orally gavaged with FITC-dextran (900 mg/kg) on day 9, and serum levels of FITC-dextran were measured 4 h later. (D) On day 9, the mice were killed, and colon lengths were measured, (E) disease activity index was measured, and (F and G) the distal colon was stained with H&E and blindly scored (0 = none, 1 = very mild, 2 = mild, 3 = moderate, 4 = severe) for epithelial damage, mononuclear and polymorphonuclear infiltrate, and submucosal edema. (Scale bar: 50 μm.) (HM) Colon sections were stained for TJ and AJ proteins and imaged by confocal microscopy (see also SI Appendix, Fig. S19 for occludin and β-catenin). (Scale bars = 20 μm.) (JM) Relative (rel.) brightness of images with error as SD from the mean was calculated (n = 15). (H and J) ZO1. (I and L) E-cadherin. (K) occludin. (M) β-catenin. (NQ) TJ and AJ protein levels were determined by Western blotting with the indicated antibodies and (OQ) quantified by densitometry (n = 3). Data are representative of at least three independent experiments; n = 5 mice per group. One-way ANOVA followed by post hoc Tukey’s test: **P < 0.01, ***P < 0.001, n.s.: not significant.
Fig. 5.
Fig. 5.
Trp feeding and metabolites prevent myosin IIA activation during mouse model of colitis, which is AhR dependent. (AD, Q, and R) Ahr+/− or Ahr−/− mice were fed a Trp-rich diet (42 g Trp/kg diet) or standard chow (2 g Trp/kg diet) for 7 d, followed by administration of DSS (%, wt/vol) or vehicle for 7 d (ad libitum) with continued Trp feeding. (EQ and SU) Alternatively, Ahr+/− or Ahr−/− mice were pretreated with I3A (1,000 mg/kg), IPyA (2,900 mg/kg), or IEt (600 mg/kg) for 2 d and then administered DSS (3%, wt/vol) for 7 d (ad libitum) with continued metabolite treatment. Activated myosin levels within intestinal tissue were determined by (AP) Western blotting against MLCK, p-MLC, and myosin light chain (MLC) and quantified by densitometry (n = 3) or (QU) immunofluorescence, followed by confocal microscopy and quantification of relative (rel.) brightness (n = 15). (Scale bar: 20 μm.) Data are representative of at least three independent experiments; n = 5 mice per group. One-way ANOVA followed by post hoc Tukey’s test: ***P < 0.001, n.s.: not significant.
Fig. 6.
Fig. 6.
Trp feeding and metabolites prevent ezrin activation in mouse model of colitis, which is AhR dependent. (AC, M, and N) Ahr+/− or Ahr−/− mice were fed a Trp-rich diet (42 g Trp/kg diet) or standard chow (2 g Trp/kg diet) for 7 d, followed by administration of DSS (3%, wt/vol) or vehicle for 7 d (ad libitum) with continued Trp feeding. (DM and OQ) Alternatively, Ahr+/− or Ahr−/− mice were pretreated with I3A (1,000 mg/kg), IPyA (2,900 mg/kg), or IEt (600 mg/kg) for 2 d and then administered DSS (3%, wt/vol) for 7 d (ad libitum) with continued metabolite treatment. Activated ezrin levels within intestinal tissue were determined by (AL) Western blotting against p-ezrin and quantified by densitometry (n = 3) or (MQ) immunofluorescence, followed by confocal microscopy and quantification of relative (rel.) brightness (n = 15). (Scale bar: 20 μm.) Data are representative of at least three independent experiments, n = 5 mice per group. One-way ANOVA followed by post hoc Tukey’s test: ***P < 0.001, n.s. = not significant.
Fig. 7.
Fig. 7.
Proposed model of Trp-derived metabolite function in regulating gut epithelial permeability. (A) Trp metabolites, indole-3-ethanol, indole-3-pyruvate, and indole-3-aldehyde, produced by the gut microbiota, decrease intestinal permeability caused by proinflammatory cytokines (e.g., TNFα). (B) Trp metabolites decrease epithelial permeability through activation of AhR and modulation of TJs and AJs via actin regulatory proteins (e.g., ezrin and nonmuscle myosin II). Cartoon schematic of the model. F-actin: filamentous actin.

References

    1. Maloy K. J., Powrie F., Intestinal homeostasis and its breakdown in inflammatory bowel disease. Nature 474, 298–306 (2011). - PubMed
    1. Kaser A., Zeissig S., Blumberg R. S., Inflammatory bowel disease. Annu. Rev. Immunol. 28, 573–621 (2010). - PMC - PubMed
    1. Khor B., Gardet A., Xavier R. J., Genetics and pathogenesis of inflammatory bowel disease. Nature 474, 307–317 (2011). - PMC - PubMed
    1. Peterson L. W., Artis D., Intestinal epithelial cells: Regulators of barrier function and immune homeostasis. Nat. Rev. Immunol. 14, 141–153 (2014). - PubMed
    1. Grice E. A., Segre J. A., The human microbiome: Our second genome. Annu. Rev. Genomics Hum. Genet. 13, 151–170 (2012). - PMC - PubMed

Publication types

MeSH terms

LinkOut - more resources