. 2020 Jul 27;11(1):3753.
doi: 10.1038/s41467-020-17514-9.

Knockout of reactive astrocyte activating factors slows disease progression in an ALS mouse model

Affiliations

Knockout of reactive astrocyte activating factors slows disease progression in an ALS mouse model

Kevin A Guttenplan et al. Nat Commun. .

Abstract

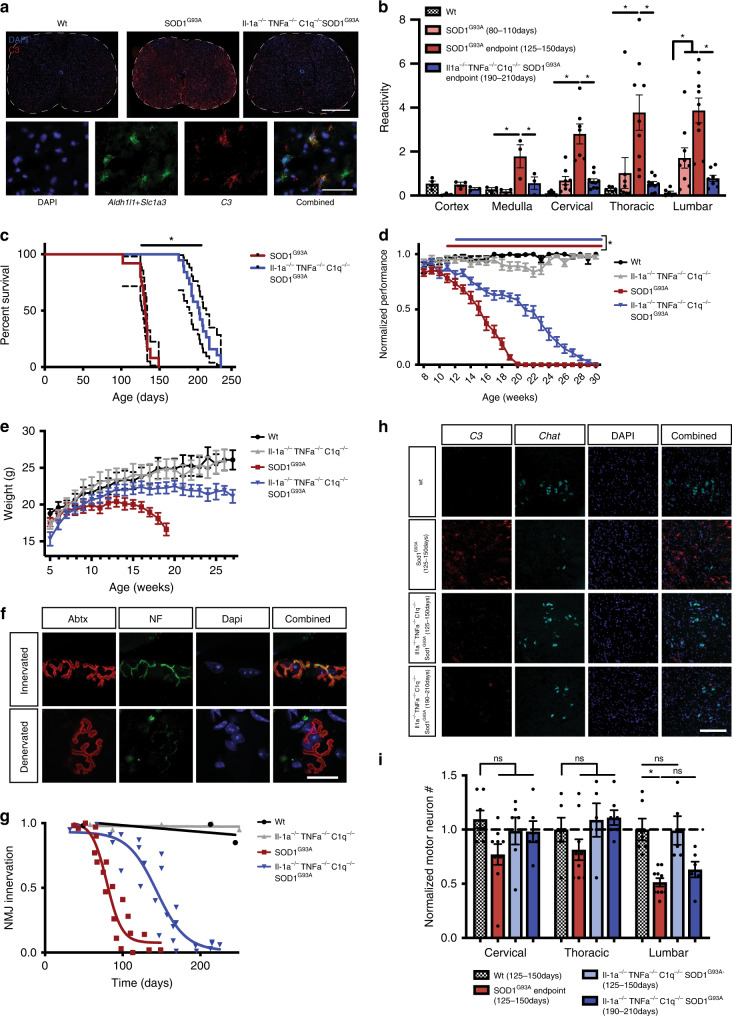
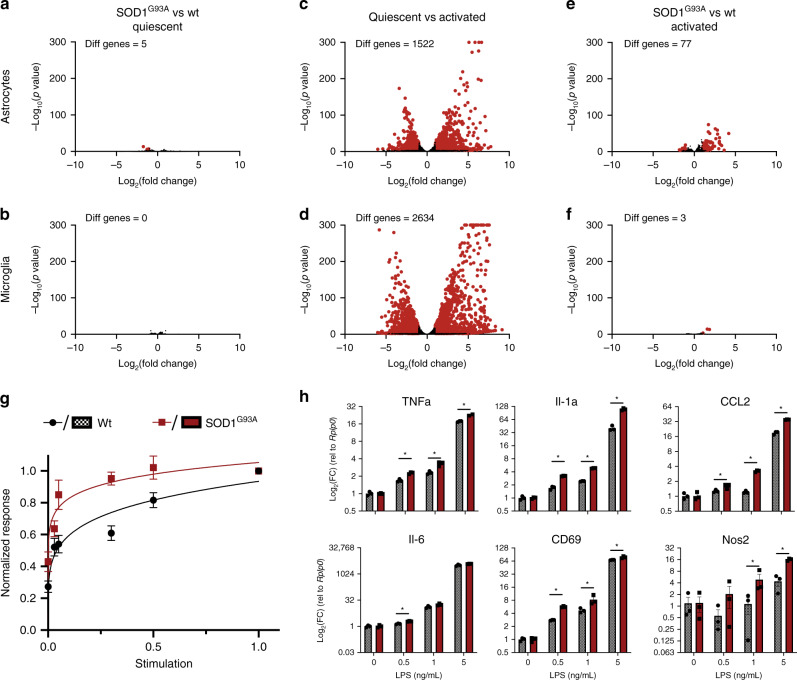
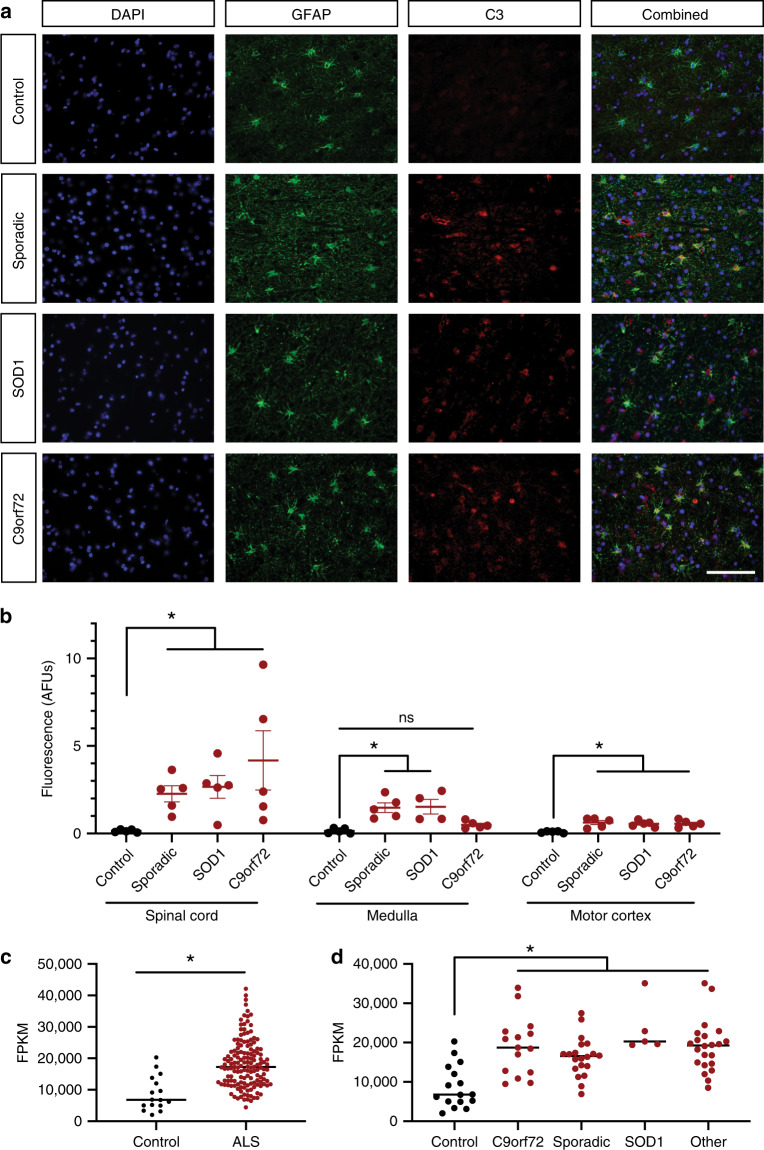
Reactive astrocytes have been implicated in the pathogenesis of neurodegenerative diseases, including a non-cell autonomous effect on motor neuron survival in ALS. We previously defined a mechanism by which microglia release three factors, IL-1α, TNFα, and C1q, to induce neurotoxic astrocytes. Here we report that knocking out these three factors markedly extends survival in the SOD1G93A ALS mouse model, providing evidence for gliosis as a potential ALS therapeutic target.


Conflict of interest statement

A.D.G. has served as a consultant for Aquinnah Pharmaceuticals, Prevail Therapeutics, and Third Rock Ventures, and is a scientific founder of Maze Therapeutics. S.A.L. is an academic founder of AstronauTx Ltd. B.A.B. is a co-founder of Annexon Biosciences Inc., a company working to make new drugs for treatment of neurological diseases. The remaining authors declare no competing interests.

Figures

Fig. 1
Fig. 1. Knockout of IL-1α, TNFα, and C1q prolongs lifespan in the SOD1G93A ALS mouse model.
a Stitched RNAscope in situ hybridization for the neuroinflammatory reactive astrocyte marker C3 in the spinal cord of WT, SOD1G93A, and IL-1α−/− TNFα−/− C1qa−/− SOD1G93A mice (n = 3 per genotype; scale bar = 500 μm) and higher magnification examples of C3+ astrocytes (quantified in Supplementary Fig. 1a; scale bar = 50 μm) b Quantification of C3 in situ hybridization in the cortex, medulla, and spinal cord. (*p < 0.05; two-tailed, unpaired Student’s t test, corrected by Holm–Sidak method; mean ± s.e.m.) c Survival curve of SOD1G93A and IL-1α−/− TNFα−/− C1qa−/− SOD1G93A mice. (*p < 0.05; Gehan–Breslow–Wilcoxon test; dotted lines = 95% confidence interval) d Rotarod analysis of motor performance in WT, SOD1G93A, an IL-1α−/− TNFα−/− C1qa−/−, and IL-1α−/− TNFα−/− C1qa−/− SOD1G93A mice. Red bar indicates ages with significantly lower SOD1G93A performance compared to WT; blue bar indicates ages with significantly lower IL-1α−/− TNFα−/− C1qa−/− SOD1G93A performance compared to IL-1α−/− TNFα−/− C1qa−/− (Mixed-effects model corrected by Tukey method; mean ± s.e.m.) e Body weight over time of WT, SOD1G93A, IL-1α−/− TNFα−/− C1qa−/−, and IL-1α−/− TNFα−/− C1qa−/− SOD1G93A mice. (mean ± s.e.m.) f Example maximum intensity projections of innervated and denervated neuromuscular junctions. α-Bungarotoxin (Abtx) labels postsynaptic acetylcholine receptors and neurofilament (NF) labels presynaptic motor neuron projections. (quantified in 1 g; scale bar = 20 μm) g Quantification of neuromuscular junction innervation. Each point represents 3–6 NMJs from one animal. WT and IL-1α−/− TNFα−/− C1qa−/− curves fit by linear regression and SOD1G93A and IL-1α−/− TNFα−/− C1qa−/− SOD1G93A curves fit by sigmoidal interpolation. The IC50s of denervation were 79.6 days for SOD1G93A and 144 days for IL-1α−/− TNFα−/− C1qa−/− SOD1G93A. h Example in situ hybridization against C3 and Chat to quantify motor neuron number in the lateral horn of the spinal cord. (quantified in 1 h; scale bar = 200 μm) i Quantification of motor neuron number along the spinal cord in WT, SOD1G93A, and IL-1α−/− TNFα−/− C1qa−/− SOD1G93A mice (*p < 0.05; two-tailed, unpaired Student’s t test, corrected by Holm–Sidak method; mean ± s.e.m.).
Fig. 2
Fig. 2. SOD1G93A and WT glia are cell-autonomously similar when quiescent.
af Bulk RNA-seq of immunopanned astrocytes and Cd11b MACs purified microglia from WT and SOD1G93A mice cultured in serum-free conditions. (Red dot indicates significant change with adjusted p value < 0.001 and |log2(fold change)| > 1) a, b SOD1G93A and WT astrocytes and microglia are transcriptomically similar when quiescent in serum-free conditions. c, d Astrocytes activated by IL-1α (3 ng/mL), TNFα (30 ng/mL), and C1q (400 ng/mL) and microglia activated by LPS (50 ng/mL) change dramatically at the transcriptome level, highlighting the transcriptomic sensitivity of these cells. e Fully activated SOD1G93A and WT astrocytes are largely transcriptomically similar, but show some expression differences associated with cytokine and immune activation. f Fully activated SOD1G93A and WT microglia are transcriptomically similar. g Normalized response kinetics of 40 astrocyte reactive marker genes assessed by microfluidics qPCR in response to submaximal doses of IL-1α, TNFα, and C1q. SOD1G93A astrocytes show larger reactivity responses to smaller insults than WT astrocytes. (error bars represent ± s.e.m.; curves represent nonlinear normalized response curves) h Expression of selected microglial activation genes assessed by qPCR in response to submaximal doses of LPS. SOD1G93A microglia show a slight but significant increase in activation to smaller insults compared to WT microglia. (*p < 0.05 by unpaired, two-tailed Student’s t test; Holm–Sidak correction; mean ± s.e.m).
Fig. 3
Fig. 3. Neuroinflammatory astrogliosis is a common pathology in human ALS.
a Example images of cortical samples from patients with sporadic, SOD1, and C9orf72 associated ALS as well as nonneurological controls stained with DAPI for nuclei, GFAP for astrocytes, and C3 as a marker for neuroinflammatory astrocyte activation. (quantified in b; scale bar = 100 µm) b Quantification of C3 immunoreactivity within GFAP+ astrocytes in the spinal cord, medulla, and cortex. There was significantly more C3 staining within astrocytes in all subtypes of ALS compared to controls in the spinal cord, medulla, and cortex except for samples of the medulla from C9orf72 associated ALS patients. (*p < 0.05 by Kruskal–Wallis nonparametric test corrected for multiple comparisons using the Dunn method; mean ± s.e.m.) c Bulk RNA-seq C3 expression from the spinal cord of ALS patients vs control (*p < 0.05 by unpaired, two-tailed Student’s t test; mean). d Subsampling of data in c by identified ALS subtype (other = other genetic cause; *p < 0.05; two-tailed, unpaired Student’s t test, corrected by Dunnett method; mean).

References

    1. Taylor JP, Brown RH, Cleveland DW. Decoding ALS: from genes to mechanism. Nature. 2016;539:197–206. doi: 10.1038/nature20413. - DOI - PMC - PubMed
    1. Nagai M, et al. Astrocytes expressing ALS-linked mutated SOD1 release factors selectively toxic to motor neurons. Nat. Neurosci. 2007;10:615–622. doi: 10.1038/nn1876. - DOI - PMC - PubMed
    1. Giorgio F, Carrasco MA, Siao MC, Maniatis T, Eggan K. Non–cell autonomous effect of glia on motor neurons in an embryonic stem cell–based ALS model. Nat. Neurosci. 2007;10:608–614. doi: 10.1038/nn1885. - DOI - PMC - PubMed
    1. Ferraiuolo L, et al. Oligodendrocytes contribute to motor neuron death in ALS via SOD1-dependent mechanism. Proc. Natl Acad. Sci. USA. 2016;113:E6496–E6505. doi: 10.1073/pnas.1607496113. - DOI - PMC - PubMed
    1. Beers DR, et al. Wild-type microglia extend survival in PU.1 knockout mice with familial amyotrophic lateral sclerosis. Proc. Natl Acad. Sci. 2006;103:16021–16026. doi: 10.1073/pnas.0607423103. - DOI - PMC - PubMed

Publication types