. 2020 Jul 27;10(1):12544.
doi: 10.1038/s41598-020-69415-y.

Deciphering the coagulation profile through the dynamics of thrombin activity

Affiliations

Deciphering the coagulation profile through the dynamics of thrombin activity

Romy M W de Laat-Kremers et al. Sci Rep. .

Abstract

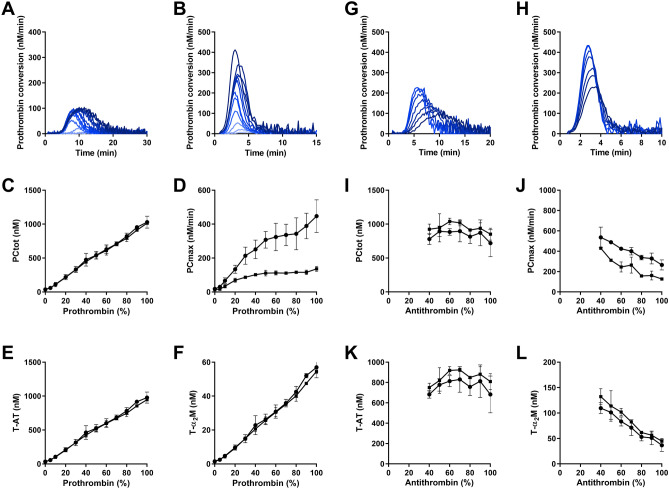
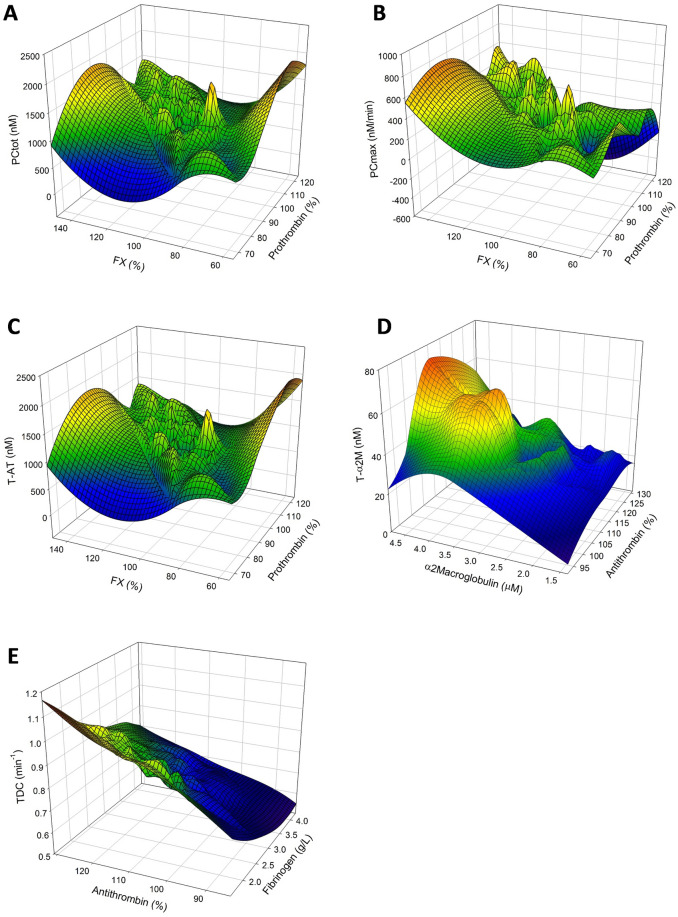
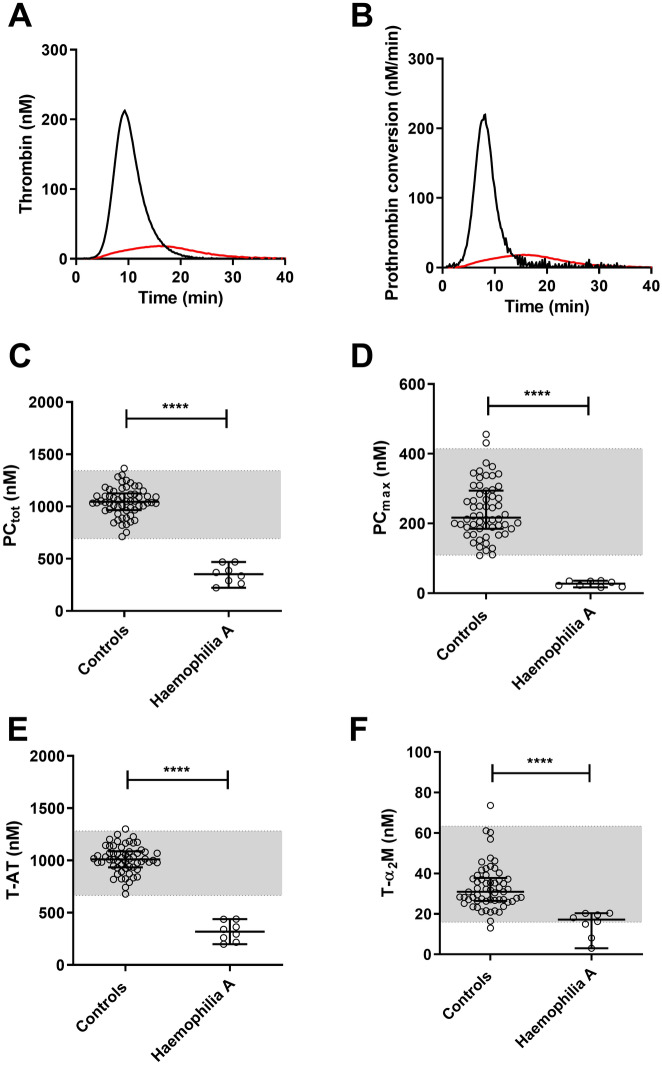
Thrombosis has proven to be extremely difficult to predict. Measuring the generation of thrombin is a very sensitive method to detect changes in the hemostatic system. We developed a method based on the generation of thrombin to further fingerprint hemostasis, which we have named thrombin dynamics. Via this method we are able to exactly measure the prothrombin conversion and thrombin inactivation, and any change in the coagulation cascade will be reflected in these two processes. In the current study we analyzed the importance of the members of the prothrombin complex on the dynamics of thrombin activation and inactivation. We show that prothrombin conversion is predominantly influenced by factor X and antithrombin, which will provide essential insights in complex thrombosis-related diseases, such as liver cirrhosis and kidney failure.


Conflict of interest statement

The authors declare no competing interests.

Figures

Figure 1
Figure 1
Illustration of the quantification of thrombin dynamics parameters. (A) The total amount of prothrombin converted (PCtot) is quantified as the area under the curve of the prothrombin conversion curve. (B) The maximum rate of prothrombin conversion (PCmax) is defined as the peak of the prothrombin conversion curve. (C, D) The total amount of prothrombin converted during TG equals the total amount of thrombin-inhibitor complexes formed (gray area). This is split into thrombin-antithrombin complex formation (T-AT; C) and thrombin-α2Macroglobulin formation (T-α2M; D).
Figure 2
Figure 2
The effect of prothrombin and antithrombin on the dynamics of thrombin generation. (AF) Prothrombin deficient plasma was mixed with pooled normal to achieve plasma concentrations of 0, 5, 10, 20, 30, 40, 50, 60, 70, 80, 90, and 100% prothrombin. Prothrombin conversion curves at 1 (A) and 5 pM TF (B) are shown (0–100% prothrombin from bottom to top) and thrombin dynamics parameters PCtot (C), the PCmax (D), T-AT complexes (E) and T-α2M complexes (F) were quantified at 1 pM TF (■ symbols) and 5 pM TF (● symbols). (GL) Antithrombin deficient plasma was mixed with pooled normal to achieve plasma concentrations of 40, 50, 60, 70, 80, 90, and 100% antithrombin. Prothrombin conversion curves at 1 (G) and 5 pM TF (H) are shown (0–100% antithrombin from top to bottom and thrombin dynamics parameters PCtot (I), the PCmax (J), T-AT complexes (K) and T-α2M complexes (L) were quantified at 1 pM TF (■ symbols) and 5 pM TF (● symbols). The average results of 3 experiments are shown as the mean ± SD.
Figure 3
Figure 3
The effect of FV and FX on the dynamics of thrombin generation. (AF) FV deficient plasma was mixed with pooled normal to achieve plasma concentrations of 0, 5, 10, 20, 30, 40, 50, 60, 70, 80, 90, and 100% FV. Prothrombin conversion curves at 1 (A) and 5 pM TF (B) are shown (0–100% FV from bottom to top) and thrombin dynamics parameters PCtot (C), the PCmax (D), T-AT complexes (E) and T-α2M complexes (F) were quantified at 1 pM TF (■ symbols) and 5 pM TF (● symbols). (GL) FX deficient plasma was mixed with pooled normal to achieve plasma concentrations of 0, 5, 10, 20, 30, 40, 50, 60, 70, 80, 90, and 100% FX. Prothrombin conversion curves at 1 (G) and 5 pM TF (H) are shown (0–100% FX from bottom to top and thrombin dynamics parameters PCtot (I), the PCmax (J), T-AT complexes (K) and T-α2M complexes (L) were quantified at 1 pM TF (■ symbols) and 5 pM TF (● symbols). The average results of 3 experiments are shown as the mean ± SD.
Figure 4
Figure 4
Reference values for thrombin dynamics parameters determined in 122 healthy subjects. Thrombin generation and thrombin dynamics were determined at 1 pM TF (AF) and 5 pM TF (GL). Average thrombin generation curves at 1 and 5 pM TF (A and G) were calculated for 3 groups: men (black), women without oral contraceptives (OC; red) and women with OC (blue). Average prothrombin conversion curve at 1 and 5 pM TF were calculated for the same groups (B,H). Reference ranges were determined for thrombin dynamics parameters at 1 and 5 pM TF: PCtot (C,I), PCmax (D,J), T-AT (E,K) and T-α2M (F,L). Reference ranges are depicted as grey boxes, dots show individual values and the lines indicate the median ± interquartile range. Statistical significance was tested by ANOVA with Bonferroni correction was indicated as *p < 0.05, **p < 0.001, and *** < p < 0.001.
Figure 5
Figure 5
The main determinants of each thrombin dynamics parameter in 122 healthy subjects. (A) The influence of prothrombin and FX levels on the PCtot, (B) of prothrombin and FX levels on the PCmax, (C) FII and FX levels on T-AT formation, (D) AT and α2M levels on T-α2M formation and (E) AT and fibrinogen levels on the TDC. 3D plots show the overall trend of the data as a color coded mesh, ranging from blue (low values) through green and yellow to red (high values).
Figure 6
Figure 6
Prothrombin conversion and thrombin inactivation in haemophilia A. Thrombin generation and thrombin dynamics were determined at 1 pM TF in 60 (male) controls and 8 hemophilia A patients . Average thrombin generation curves (A) were calculated for the controls (black) and hemophilia patients (red). The average prothrombin conversion curve at 1 pM TF were calculated for the same groups (B). Prothrombin conversion was quantified as PCtot (C) and PCmax (D), and thrombin inactivation was measured by T-AT (E) and T-α2M (F). Reference ranges are depicted as grey boxes, dots show individual values and the lines indicate the median ± interquartile range. Statistical significance was tested by Mann–Whitney test and indicated as **** < p < 0.0001.

References

    1. Hemker HC, et al. Calibrated automated thrombin generation measurement in clotting plasma. Pathophysiol. Haemost. Thromb. 2003;33:4–15. doi: 10.1159/000071636. - DOI - PubMed
    1. Tripodi A. Thrombin generation assay and its application in the clinical laboratory. Clin. Chem. 2016;62:699–707. doi: 10.1373/clinchem.2015.248625. - DOI - PubMed
    1. Wielders S, et al. The routine determination of the endogenous thrombin potential, first results in different forms of hyper- and hypocoagulability. Thromb. Haemost. 1997;77:629–636. doi: 10.1055/s-0038-1656024. - DOI - PubMed
    1. van Hylckama Vlieg, A. et al. Elevated endogenous thrombin potential is associated with an increased risk of a first deep venous thrombosis but not with the risk of recurrence. Br J Haematol138, 769–774, doi: 10.1111/j.1365-2141.2007.06738.x (2007). - PubMed
    1. Ten Cate H. Thrombin generation in clinical conditions. Thromb. Res. 2012;129:367–370. doi: 10.1016/j.thromres.2011.10.017. - DOI - PubMed