

doi: 10.1038/s41587-020-0614-0.
Epub 2020 Jul 27.
Isolating live cell clones from barcoded populations using CRISPRa-inducible reporters
Affiliations
- PMID: 32719478
- PMCID: PMC7616981
- DOI: 10.1038/s41587-020-0614-0
Item in Clipboard
Isolating live cell clones from barcoded populations using CRISPRa-inducible reporters
Nat Biotechnol.
2021 Feb.
Abstract
We developed a functional lineage tracing tool termed CaTCH (CRISPRa tracing of clones in heterogeneous cell populations). CaTCH combines precise clonal tracing of millions of cells with the ability to retrospectively isolate founding clones alive before and during selection, allowing functional experiments. Using CaTCH, we captured rare clones representing as little as 0.001% of a population and investigated the emergence of resistance to targeted melanoma therapy in vivo.
Conflict of interest statement
The authors declare no conflict of interest.
Figures

a, Functional comparison of dCas9-VPR to dCas9-VP64 using a doxycycline inducible reporter system with sgRNAs targeting either one (-53 bp or -203 distance to TSS), two, or seven target sites (tetO sites). Doxycycline induced activation via rtTA3 was used as a positive control. Reporter activation was measured by FACS. Left: Corresponding FACS histograms of GFP activation (normalized to mode); Right: Quantification of percent activated of parent (upper panel) and of signal strength in mean fluorescent intensity (MFI, lower panel), n=3 biologically independent samples, for CTRL n=2, bar graphs display the mean ± standard deviation (SD). b, Evaluating the optimal sgRNA positioning using two reporter constructs (D1 and D2). Left: FACS histograms of GFP activation with the individual sgRNAs in D1 or D2, ordered by sgRNA-distance to the TSS (-58 bp, -82 bp, -106 bp, -130 bp, -154 bp, -202 bp, -250 bp, -298 bp); Right: Quantification of percent activated and MFI; n=2 biologically independent samples, bar graphs display the mean. c, Determining the effect of multiple sgRNA target sites and their spacing on GFP activation by comparing a reporter construct with spaced BCs (R1) with a reporter construct with BCs side by side (R2). Left: FACS histograms of GFP activation; Right: Quantification of percent activated and MFI, n=2 biologically independent samples, bar graphs display the mean.

a, Design of the CaTCH barcode cassette with 3 independent sgRNA target sites. Each barcode sequence is semi-random with defined base restrictions. b, CaTCH reporter activation by targeting sgRNA-sites individually or simultaneously. Left: FACS histograms of GFP activation; Right: Quantification of percent activated and MFI, n=3 biologically independent samples, n=1 for CTRL. All bar graphs display the mean ± standard deviation (SD). c, Complexity of the CaTCH library plasmid pool determined by NGS (~237 million reads). Left Y-axis: Barcode distribution in the library, shown in bars. Right Y-axis: Relative, cumulative barcode representation, shown as a red line. X-axis: Frequency of unique BC. The bar graph on the right shows the sum of all identified unique barcodes resulting in ~130 million unique barcodes detected in the library.

a, Sensitivity of CaTCH reporter activation (full dataset of spike-in experiment from Fig. 1c-e). FACS plots on the top show the GFP signal only, while plots at the bottom additionally visualize the spiked in iRFP+ cell populations. The experiment was repeated independently 3 times with similar results and 6 times for the 0.001% spike in. b, Experimental outline of two different reporter activation strategies. CaTCH approach: After the (1) dCas9-VPR construct, the (2) BC-controlled GFP-reporter is stably introduced into the cells. Reporter activation is achieved by lentiviral (3) sgRNA transduction. Alternative approach: (1) First, a sgRNA is stably expressed and functions as an identifier in the cells. (2) Subsequently, an sgRNA-specific GFP-reporter plasmid and a separate dCas9-VPR construct are simultaneously, transiently co-transfected for reporter activation. c, FACS data of GFP-reporter activation of both approaches in a spike-in experiment similar to Fig. 1c. iRFP+ spiked-in cells are visualized in red. Gates were set to obtain 0 unspecific events in the 0% spike-in control after delivery of sgRNA/reporter plasmid and dCas9-VPR. Reporter activation was measured by GFP signal. Every experimental condition was performed in triplicates, except 0.001% spike-ins, which were performed in six replicates. d, Quantification of the GFP-reporter activation. Correctly activated = percent of iRFP+ (spike-in) of GFP+ (reporterpositive) events. Activation efficiency = percent of GFP+ within iRFP+ events. Data displayed as mean ± standard error of mean (SEM). n=3 biologically independent samples, n=6 for 0.001% spike-in. e, Delivery rates of a plasmid constitutively expressing GFP in several cell lines with lipofection or lentiviral delivery. Data measured by FACS, n=2 biologically independent samples. Bar graph displays the mean.

a, FACS plots corresponding to the quantification of NrasG12D spike in experiment of Fig. 1g. b, Experimental outline of CaTCH reporter activation and isolation displayed in Fig. 1h. c, FACS analysis of CaTCH isolated cells from Fig. 1h after expansion. Most GFP+ cells are also iRFP+, indicating isolation of the correct clone. The experiment was performed once. d, Immunoblot of MAPK-pathway (pERK) after short term RAFi-treatment in vitro of the bulk cell line, RAFi-selected NrasG12D cells, and treatment-naïve CaTCH-isolated NrasG12D cells. Quantification of pERK normalized to total protein levels is indicated by the numbers. The experiment was performed independently twice with similar results. e, NGS indicating the proportion of reads for NrasWT and NrasG12D, n=3 biologically independent samples for vehicle- and RAFi-treated samples, n=1 for others.

a, Respective survival curves of resistance generation experiment in vivo from Fig. 2b. Statistical analysis was performed by two-sided Log-rank (Mantel-Cox) test, comparing RAFi-MEKi-treated to untreated. **P<0.01, ns=non-significant. (Untreated=4 tumors isolated from 4 mice; RAFi/MEKi=5 tumors isolated from 5 mice). b, Violin plot showing the distribution of identified BCs within samples. REF=starting cell line, T1-T9=individual tumors, one tumor per mouse; median: line, middle 50% of data: box, 1.5*IQR: whiskers; individually depicted points indicate outliers; the exact number of barcodes per individual tumor can be derived from Fig. 2c. c, Pearson correlation matrix of all identified BCs, n=58269 unique BCs. d, Heatmap showing normalized read-counts of selected BCs in the indicated samples.

a, Experimental outline. The same population of CaTCH barcoded melanoma cells used in the in vivo experiment from Fig. 2 was seeded for RAFi/MEKi-treatment in vitro. 6 replicates were used per condition. RAFi/MEKi treated cells were sampled after 1 week and 5 weeks on treatment. DMSO treated samples were sampled after passaging them once. b, Total number of unique barcodes identified by NGS in the respective samples. REF1-2, two replicates of the starting cell line; DMSO R1-6, 6 DMSO treated replicates; RAFi/MEKi R1-6, 6 RAFi/MEKi treated replicates sampled after 1 or 5 weeks on treatment. c, Violin plot showing the distribution of identified BCs within samples from Extended Data Fig. 6b; median:line, middle 50% of data: box, 1.5*IQR: whiskers; the exact number of barcodes per individual sample can be derived from Extended Data Fig. 6b. d, Pearson correlation matrix of identified BCs, n=45928 unique BCs. e, BC composition identified by NGS. BCs comprising more than 1% of the sample are highlighted individually in color, BCs accounting for < 1% barcode proportion were summed up (white bars). Same colors indicate same BCs. Grey sections are different BCs.

a, NGS of CaTCH isolated clones identified in the in vivo experiment (see Fig. 2d). Shown is the BC composition after CaTCH isolation of the indicated BC from the starting population (treatment-naïve and depleted, Fig. 2e) or from tumor-derived RAFi/MEKi-resistant cell lines. BCs > 1% of the sample are highlighted individually in color, BCs < 1% were summed up in white bars. The correct, targeted BC within each sample is shown at the bottom section of every bar, in its respective color code from Fig. 2d, e. b, BC composition of different isolations of BC14559 or BC43158. Both BCs were always identified together, indicated in the respective BC color. The BC which was targeted for isolation is indicated below each bar. c, Tumor growth curves and survival curves of in vivo RAFi/MEKi treatment response of three randomly single cell sorted CaTCH-barcoded clones (C1, C2, C3). Sorted clones were transduced with a barcode-unspecific CaTCH reporter activating sgRNA and sorted for activated GFP signal before injection. Growth curves displayed as mean ± standard error of mean (SEM). Statistical analysis on survival curves was performed by two-sided Log-rank (Mantel-Cox) test, comparing individual clones on treatment to untreated. *P<0.05, ns=non-significant. n=tumors, two tumors per mouse, C1: UT n=6, RAFi/MEKi n=8; C2: UT n=6, RAFi/MEKi n=8; C3: UT n=4, RAFi/MEKi n=8). d, Survival curves corresponding to the tumor growth curves from Fig. 2f. Statistical analysis was performed by two-sided Log-rank (Mantel-Cox) test, comparing individual clones on treatment to untreated. *P<0.05, **P<0.01, ns=non-significant. n=mice. BULK: TNUT n=3, TNRAFi/MEKi n=5; BC121: TNUT n=3, RUT n=3, TNRAFi/MEKi n=5, RRAFi/MEKi n=5; BC952: TNUT n=3, RUT n=3, TNRAFi/MEKi n=4, RRAFi/MEKi n=5; BC2487: TNUT n=3, RUT n=3, TNRAFi/MEKi n=4, RRAFi/MEKi n=5; BC13: TNUT n=3, TNRAFi/MEKi n=4; BC2721: TNUT n=3, TNRAFi/MEKi n=5; BC2646: TNUT n=3, RUT n=2, TNRAFi/MEKi n=5, RRAFi/MEKi n=3; BC14559: TNUT n=3, RUT n=3, TNRAFi/MEKi n=3, RRAFi/MEKi n=5.

a, Experimental outline and individual tumor growth curves of injected cell lines in vivo, aligned to treatment start. Tumors were harvested at day 0 (untreated) or at day 3 of RAFi/MEKi treatment (on RAFi/MEKi therapy). b, PCA plots of RNAseq analysis. Three tumors were sequenced per cell line and condition. This experiment was performed once. c, Heatmap of top 500 high-variance genes with three main gene clusters indicated on the right: Top GO term per cluster: Cluster 1 – Cellular response to interferon beta, Cluster 2 – negative regulation of cell proliferation, Cluster 3 – Cell division; see Supplementary Table 1 for extended lists. n=3 biologically independent samples (tumors) per cell line and condition; GO-terms and statistics (Fisher’s exact test) were derived in R using topGOtable (pcaExplorer). d, Heatmap showing differentially expressed genes (deviation from the mean > 1 or < -1) within GO term ‘cell division’ (GO:0035458); see Supplementary Table 2 for gene list. e, Venn diagram showing overlap of differentially regulated genes (on RAFi/MEKi therapy vs. untreated) within treatment-naïve clones, DESeq2, threshold of Log2FC ± 1; see Supplementary Table 3 for full gene lists. f, Top 50 mediators identified in Ingenuity upstream mediator analysis of RAFi/MEKi-treated tumors, compared to BC13, only selected mediators are displayed; see Supplementary Table 4 for full list. g, Heatmap showing normalized read counts of indicated genes across samples on RAFi/MEKi therapy; values for each tumor shown individually; see Supplementary Table 5 for full list.

a, Total number of detected variants per sample. b, Summary of variant classification visualized as box plots; n=5 (5 individual cell clones); box displays median with 25th and 75th quartile, whiskers correspond to minimum and maximum values; values correspond to the data in Supplementary Fig 9a. c, Overview of SNV classes. d, Read tracks of the KRAS locus at codon 12 for clones BC14559TN and BC14559R. The KRASG12R mutation was exclusively identified in BC14559R.

Representative gating strategy for sorting of CaTCH library infected cells. The cells were previously infected with and sorted for dCas9-VPR (mCherry) and then infected with the CaTCH library (BFP). BFP-positive cells were sorted for low GFP (CaTCH reporter) expression, which enhances reporter functionality. Each plot shows the subpopulation gated for in the preceding plot to the left.

a, The CaTCH workflow. After transduction of a heterogeneous cell population with the dCas9VPR construct and the barcode (BC) reporter, a part of the cells is used for a selection experiment to identify clones with a desired phenotype. The clone’s specific barcode sequence is identified by NGS and used to design complementary sgRNA constructs. The sgRNAs are transduced into the retained, unselected population and specifically guide the dCas9-VPR to the barcode of interest to activate GFP expression. The GFP positive clones can be isolated alive by FACS and used to perform functional studies. b, Schematics and FACS plots of CaTCH reporter activation in bulk A375 cells harboring a single barcode (BC). GFP expression is only induced if a sgRNA complementary to the barcode is present. The experiment was repeated independently 3 times with similar results. c, Experimental layout to determine the sensitivity of CaTCH reporter activation in a spike-in experiment. d, FACS plots of the spike-in experiment shown in c. The top row shows the GFP signal, while the bottom row additionally visualizes the spiked-in iRFP+ cell populations. e, Quantification of Fig. 1d, including additional spike-in ratios (the corresponding FACS plots are shown in Extended Data Fig. 3a). n=3 biologically independent samples, n=6 for 0.001% spike-in. Data displayed as mean ± standard deviation (SD). f, Experimental outline to trace and CaTCH-isolate pre-existing, therapy-resistant cell clones: NrasG12D-iRFP expressing clones with a known BC were spiked into a complex barcoded background population and treated with vehicle or RAFi. g, Enrichment of iRFP-positive cells over 31 days of RAFi-treatment measured by FACS; Extended Data Fig. 4a displays the corresponding plots. n=3 biologically independent samples, except for vehicle day 7 n=1, data displayed as mean ± standard error of mean (SEM). h, FACS plots display the CaTCH reporter activation of spiked-in cells. GFP+ cells were sorted, expanded, and their BC sequenced. The bar graph shows the percentage of identified reads corresponding to the target BC after 31 days of vehicle or RAFi-treatment (n=3 biologically independent samples, data displayed as mean ± standard deviation) or after CaTCH isolation (n=1).
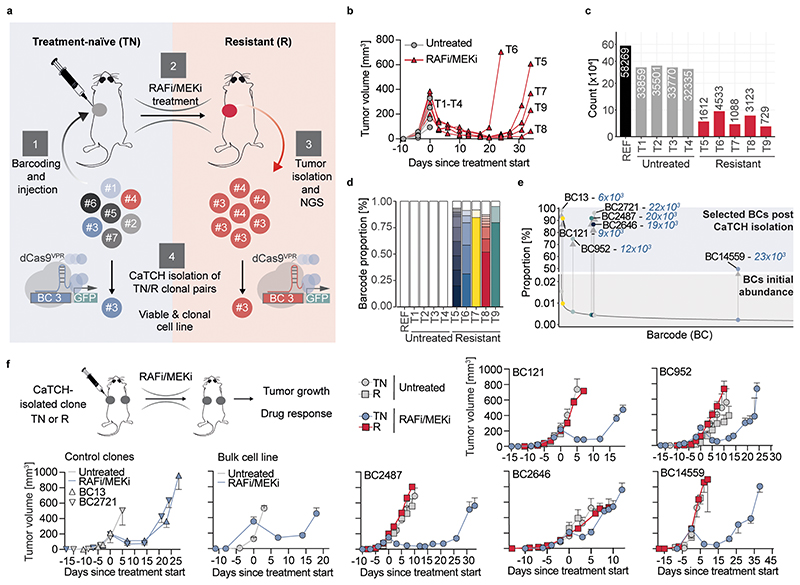
a, Experimental outline: (1) A population of barcoded cells is injected subcutaneously into C57BL/6 mice. (2) After RAFi/MEKi treatment and development of resistance (3) tumors are excised, BC-sequenced and taken into culture. (4) Clones of interest are CaTCH-isolated from the tumor-derived, resistant (R) cells and from the treatment-naïve (TN) starting population. b, Individual tumor growth curves of RAFi/MEKi-treated or vehicle treated melanoma tumors. Corresponding survival curve is shown in Extended Data Fig. 5a. (Untreated=4 tumors isolated from 4 mice; RAFi/MEKi=5 tumors isolated from 5 mice). c, Total number of unique BCs identified by NGS (REF=starting cell line, T1-T9=individual tumors, one tumor per mouse). d, BC composition identified by NGS. BCs more abundant than 1% of the sample are highlighted individually in color, BCs comprising less than 1% barcode proportion were summed up (white bars). e, BC proportion before (bottom, grey) and after (top, blue) CaTCH-isolation from the TN starting population. BCs are sorted by their distribution in the starting population from high (left) to low (right). Isolated BCs are highlighted by dots, their fold-change enrichment after CaTCH-isolation is indicated in blue. BCs were named by their abundance-rank in the starting population (1=most abundant). f, Experimental outline and in vivo RAFi/MEKi treatment response of tumors established from single CaTCH-isolated clones. Data displayed as mean ± standard error of mean (SEM). The corresponding survival curves are shown in Extended Data Fig. 7d. n=tumors, two tumors per mouse, BC121: TNUT n=6, RUT n=6, TNRAFi/MEKi n=10, RRAFi/MEKi n=10; BC952: TNUT n=6, RUT n=6, TNRAFi/MEKi n=8, RRAFi/MEKi n=10; BC2487: TNUT n=6, RUT n=6, TNRAFi/MEKi n=8, RRAFi/MEKi n=10; BC2646: TNUT n=6, RUT n=4, TNRAFi/MEKi n=10, RRAFi/MEKi n=6, experiment performed twice; BC14559: TNUT n=6, RUT n=6, TNRAFi/MEKi n=6, RRAFi/MEKi n=10, experiment performed twice; BC13: TNUT n=6, TNRAFi/MEKi n=8; BC2721: TNUT n=6, TNRAFi/MEKi n=10; BULK: TNUT n=6, TNRAFi/MEKi n=10.
References
-
- Reya T, Morrison SJ, Clarke MF, Weissman IL. Stem cells, cancer, and cancer stem cells. Nature. 2001;414:105–111. - PubMed
-
- Simons BD, Clevers H. Strategies for Homeostatic Stem Cell Self-Renewal in Adult Tissues. Cell. 2011;145:851–862. - PubMed
-
- Shakiba N, et al. Cell competition during reprogramming gives rise to dominant clones. Science (80-) 2019;364:eaan0925. - PubMed
Publication types
MeSH terms
Substances
Grants and funding
LinkOut - more resources
Full Text Sources
Molecular Biology Databases
Research Materials
