Clinical Trial
. 2020 Aug;26(8):1285-1294.
doi: 10.1038/s41591-020-0985-2. Epub 2020 Jul 27.

Assessment of cognitive and neural recovery in survivors of pediatric brain tumors in a pilot clinical trial using metformin

Affiliations
Clinical Trial

Assessment of cognitive and neural recovery in survivors of pediatric brain tumors in a pilot clinical trial using metformin

Ramy Ayoub et al. Nat Med. 2020 Aug.

Abstract

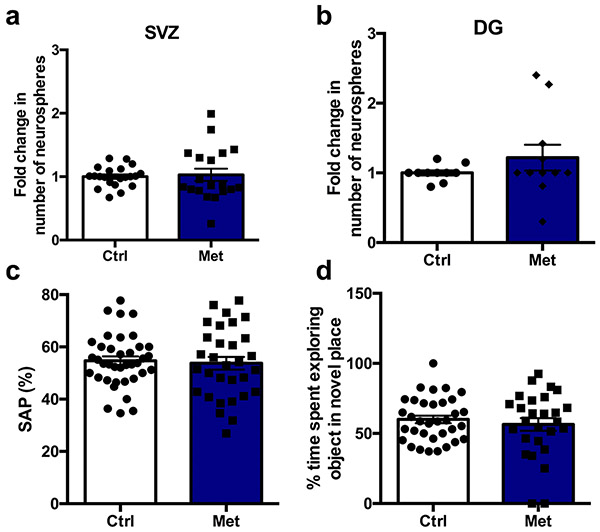
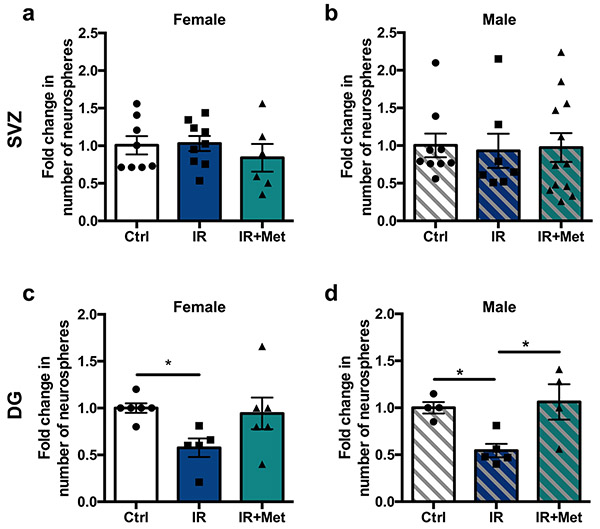
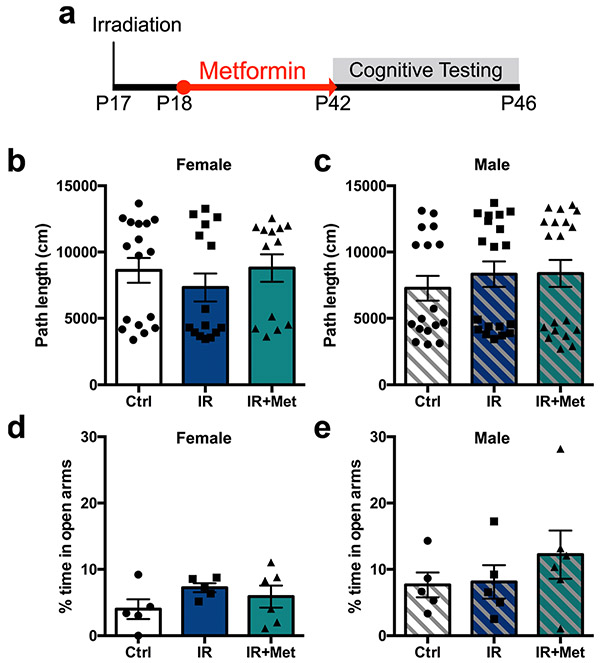
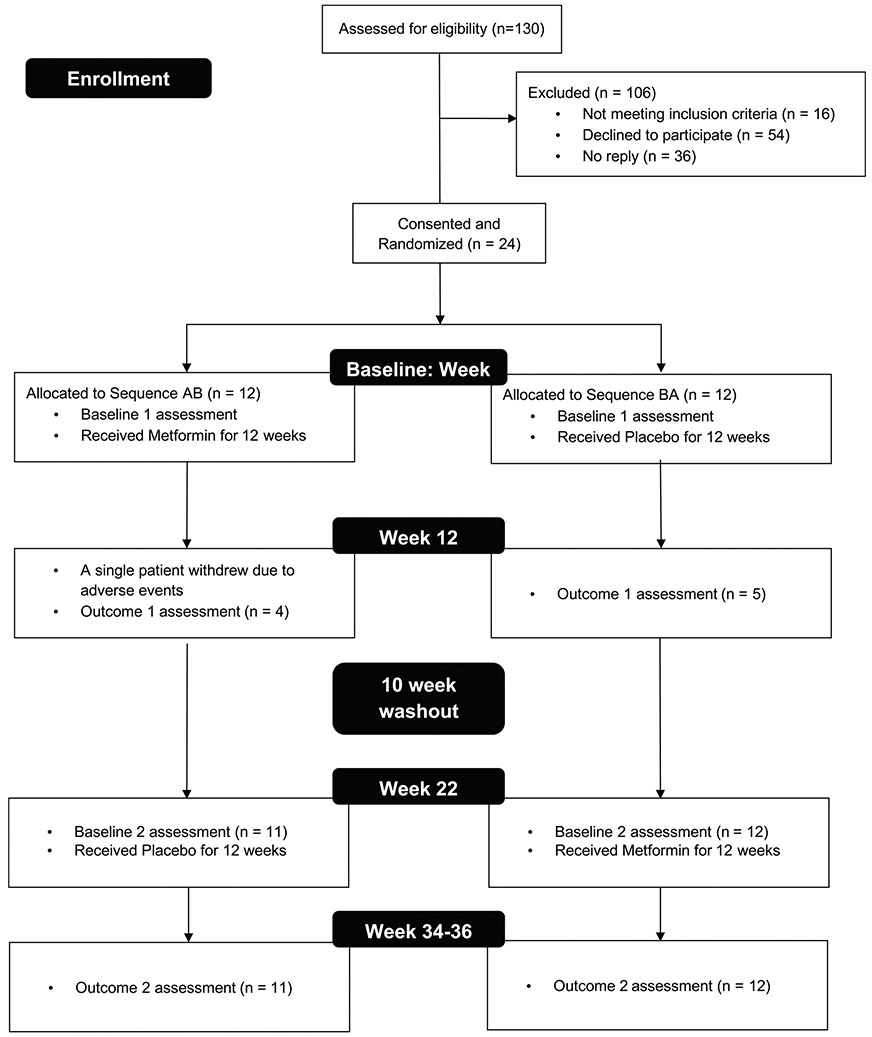
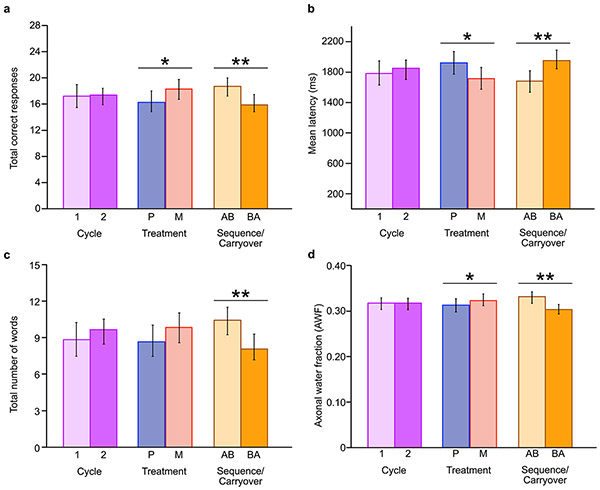
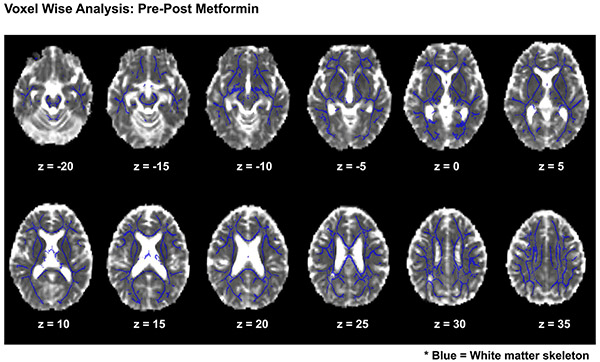
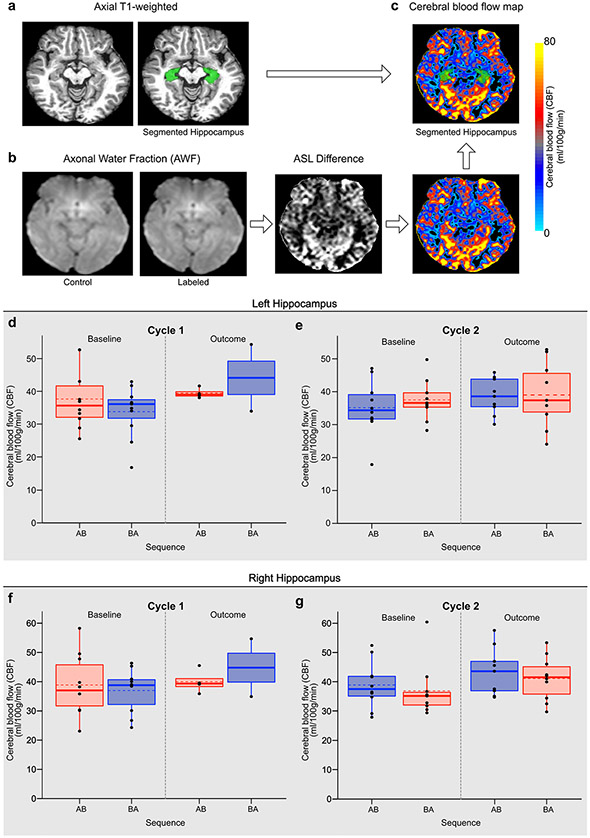
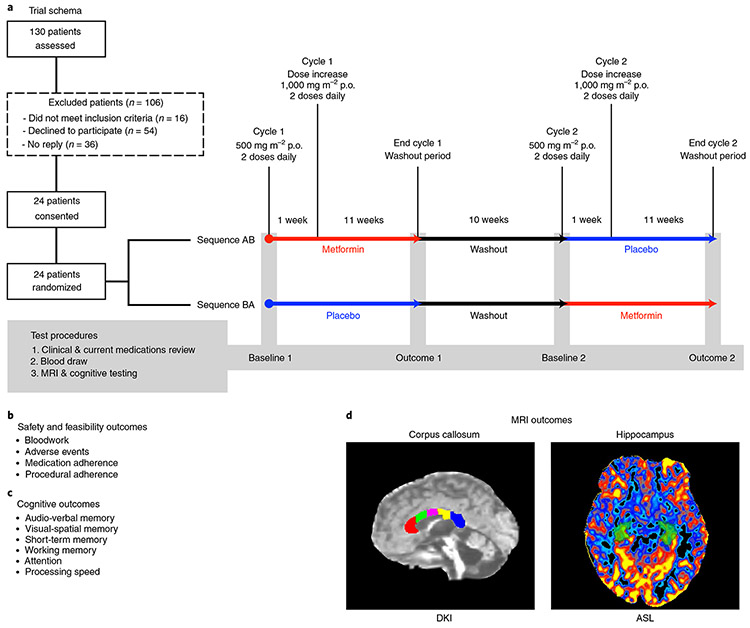
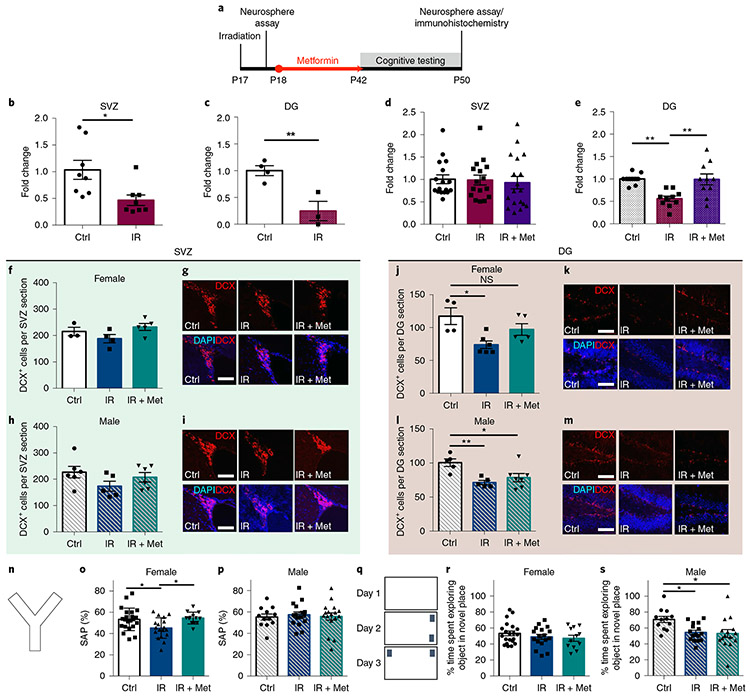
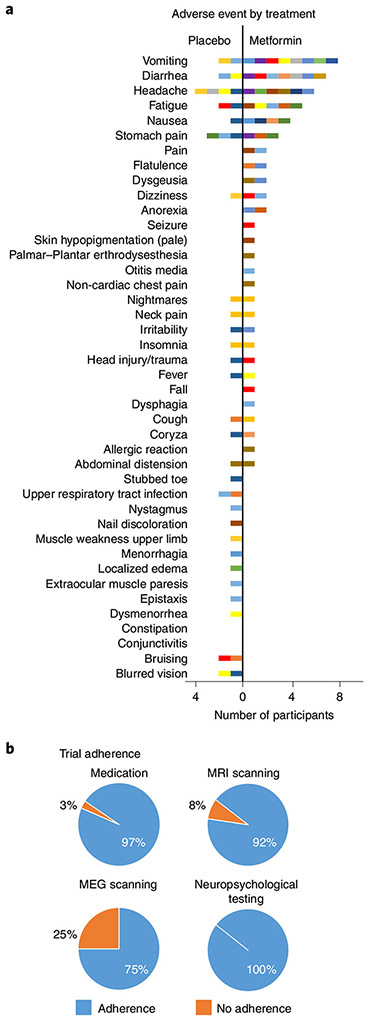
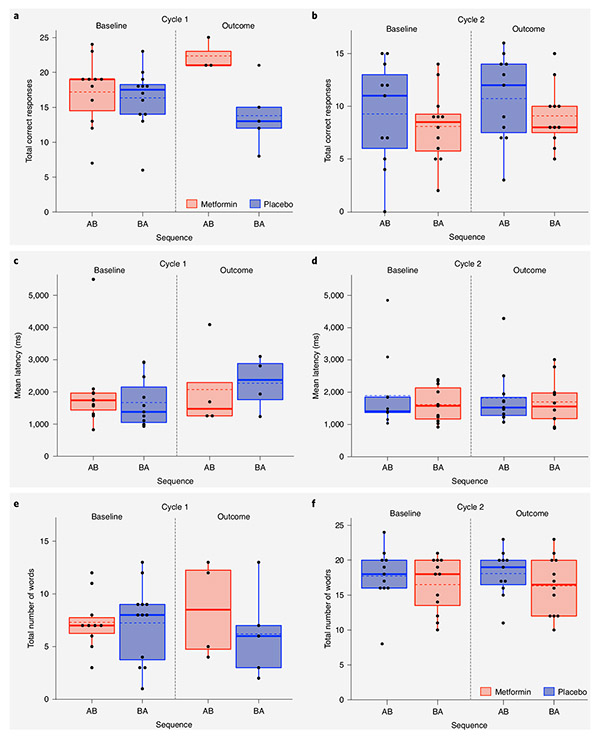
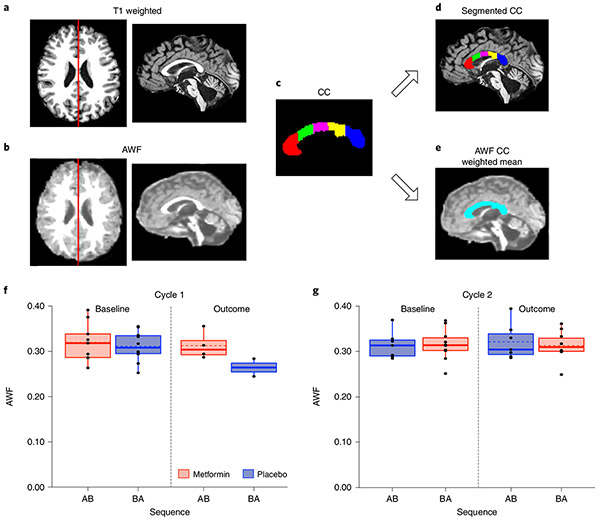
We asked whether pharmacological stimulation of endogenous neural precursor cells (NPCs) may promote cognitive recovery and brain repair, focusing on the drug metformin, in parallel rodent and human studies of radiation injury. In the rodent cranial radiation model, we found that metformin enhanced the recovery of NPCs in the dentate gyrus, with sex-dependent effects on neurogenesis and cognition. A pilot double-blind, placebo-controlled crossover trial was conducted (ClinicalTrials.gov, NCT02040376) in survivors of pediatric brain tumors who had been treated with cranial radiation. Safety, feasibility, cognitive tests and MRI measures of white matter and the hippocampus were evaluated as endpoints. Twenty-four participants consented and were randomly assigned to complete 12-week cycles of metformin (A) and placebo (B) in either an AB or BA sequence with a 10-week washout period at crossover. Blood draws were conducted to monitor safety. Feasibility was assessed as recruitment rate, medication adherence and procedural adherence. Linear mixed modeling was used to examine cognitive and MRI outcomes as a function of cycle, sequence and treatment. We found no clinically relevant safety concerns and no serious adverse events associated with metformin. Sequence effects were observed for all cognitive outcomes in our linear mixed models. For the subset of participants with complete data in cycle 1, metformin was associated with better performance than placebo on tests of declarative and working memory. We present evidence that a clinical trial examining the effects of metformin on cognition and brain structure is feasible in long-term survivors of pediatric brain tumors and that metformin is safe to use and tolerable in this population. This pilot trial was not intended to test the efficacy of metformin for cognitive recovery and brain growth, but the preliminary results are encouraging and warrant further investigation in a large multicenter phase 3 trial.


Figures

Extended Data Fig. 1 ∣
Extended Data Fig. 1 ∣. Metformin in the absence of injury has no significant effect on the number of neurospheres or on behavioural assays.
a, b, Fold change in the number of neurospheres from the (a) SVZ (n = 21 Ctrl, 19 Met mice over 10 independent experiments; t(38) = 0.10, p = 0.92) and (b) DG (n = 12 Ctrl, 10 Met mice over 5 independent experiments; t(20) = 0.90, p = 0.38) 5 weeks post-radiation. c, Spontaneous alternation performance measured using the Y maze at P43 (n = 38 Ctrl, 31 Met mice over 14 independent experiments; t(67) = 0.34, p = 0.74). d, Percentage of time spent exploring objects in a novel place measured using the novel place recognition task from P44-46 (n = 34 Ctrl, 27 Met over 13 independent experiments; t(59) = 0.70, p = 0.48). Two-sided unpaired t-test was used for all analyses. Data is presented as mean ± SEM.
Extended Data Fig. 2 ∣
Extended Data Fig. 2 ∣. Metformin’s effects on NSC pool recovery following juvenile cranial radiation are not sex-dependent.
a, b, Fold change in the number of neurospheres from the SVZ 5 weeks post-radiation in (a) females (n = 8 Ctrl, 9 IR, 6 IR + Met mice over 6 independent experiments; F(2,20) = 0.56, p = 0.58) and (b) males (n = 9 Ctrl, 7 IR, 12 IR+Met mice over 6 independent experiments; F(2,25) = 0.03, p = 0.97). (c-d) Fold change in the number of neurospheres from the DG 5 weeks post-radiation in (c) females (n = 6 Ctrl, 5 IR, 6 IR+Met mice over 4 independent experiments; F(2,14) = 3.47, p = 0.06; Ctrl vs. IR, p = 0.0496) and (d) males (n = 4 Ctrl, 5 IR, 4 IR+Met over 4 independent experiments; F(2,10) = 6.47, p = 0.02; Ctrl vs. IR, p = 0.04; IR vs. IR+Met, p = 0.02). *p< 0.05, one-way ANOVA with Tukey’s test was used for all analyses. Data is presented as mean ± SEM.
Extended Data Fig. 3 ∣
Extended Data Fig. 3 ∣. Cranial radiation does not lead to impairments in the open field test or in the elevated plus maze.
a, Experimental paradigm. IR=cranial radiation. b, c, Path length travelled over 10 minutes in an open arena by (b) females (n = 17 Ctrl, 15 IR, 13 IR+Met mice over 13 independent experiments; F(2,42) = 0.62, p = 0.54) and (c) males (n = 17 Ctrl, 19 IR, 19 IR+Met mice over 13 independent experiments; F(2,52) = 0.40, p = 0.67). d, e, Percentage of time spent in the open arms of the elevated plus maze over 10 minutes by (d) females (n = 5 Ctrl, 5 IR, 6 IR+Met mice over 4 independent experiments; F(2,13) = 1.26, p = 0.32) and (e) males (n = 5 Ctrl, 5 IR, 6 IR+Met mice over 4 independent experiments; F(2,13) = 0.78, p = 0.48). One-way ANOVA with Tukey’s test was used for all analyses. Data is presented as mean ± SEM.
Extended Data Fig. 4 ∣
Extended Data Fig. 4 ∣. Consort table.
Eligible participants were identified via database review. Randomization was conducted by the Research Support Pharmacy and all research personnel remained blind to treatment assignment until all participants had completed the trial and data processing and scoring was completed. Initially, due to the pilot nature of the trial, neuroimaging and neuropsychological assessments were acquired at three time points (Baseline 1 and 2; Outcome 2). With an amendment to the study protocol, subsequent participants were assessed at four time points (Baseline 1 and 2; Outcome 1 and 2). Therefore, fewer Outcome 1 than Outcome 2 data points were acquired. Linear mixed modeling can be used in the context of such missing data. The single participant who consented but did not complete the trial was not included in the analyses.
Extended Data Fig. 5 ∣
Extended Data Fig. 5 ∣. Estimated marginal means for linear mixed models of cognitive and WMTI outcomes.
Data are presented as estimated marginal means from seperate general linear mixed models (two sided) with two sets of outcomes (Outcome 1 and 2 corresponding to the end of the first and second 12-week treatment cycles, respectively). We examined the fixed effects of cycle (the first versus second 12-week treatment cycle), treatment (metformin versus placebo), and sequence (metformin first, placebo second [AB] versus placebo first, metformin second [BA]). Bar graphs show estimated means+/− SEMs from the following model: Outcome measure = cycle + treatment + sequence + covariate (Baseline measure) + (1∣ participant ID+ε, where cycle, treatment, and sequence are independent fixed effects and where the measures are: a) total correct on the LSWM (n = 23); b) CANTAB mean latency (n = 22); c) total number of words recall for immediate recall (n = 23); and d) AWF. Standard error bars are shown for each estimated mean. All models were corrected for multiple comparisons (False Discovery Rate (FDR) q < .10): * p < 0.05, ** q < 0.10 from the linear mixed models (Panel a-c, qs = 0.09; Panel d, q = 0.08).
Extended Data Fig. 6 ∣
Extended Data Fig. 6 ∣. Voxel wise analyses of treatment effects.
We used a longitudinal voxel wise approach to test for clusters of significant changes in AWF and De,⊥ following metformin in all participants using Tract Based Spatial Statistics (TBSS). For 2 sided comparisons across treatment conditions, individual difference maps for AWF and De,⊥ (post-metformin minus pre-metformin) were projected onto the skeleton and tested for voxels where change was significantly different from zero using threshold-free cluster enhancement (TFCE). For these analyses, the null distribution of the cluster-size statistic was built up over 5000 random permutations. Cluster size was thresholded at P < 0.05, which is family wise fully corrected for multiple comparisons across space. Images are presented in the axial frame in radiological convention within Montreal Neurological Institute (MNI) Z-coordinates. The white matter skeleton is displayed in blue. No significant clusters of change were evident for AWF (p = .90) or De,∣ (p = .47) across the white matter skeleton.
Extended Data Fig. 7 ∣
Extended Data Fig. 7 ∣. Arterial Spin Labelling and Cerebral Blood Flow within the Hippocampus as a function of cycle, treatment, and sequence effects for the right and left hippocampi and adjusted for baseline hippocampal CBF.
a, Axial T1-weighted image with FreeSurfer hippocampus segmentation shown. b, PASL image processing pipeline shown in the axial plane, including PASL Control, PASL Labeled image, Perfusion weighted Image and Cerebral Blood Flow Map. c, Segmented hippocampi registered to the CBF map. Boxplots showing all data points at baseline and outcome assessment with the mean (dashed line) and median (solid line) sequence group observations for CBF (ml/100 g/min) for: the left hippocampus at d) Cycle 1 and e) Cycle 2; and the right hippocampus at f) Cycle 1 and g) Cycle 2. Metformin treatment condition is shown in red and placebo in blue. The upper and lower limits of the box plots are the third and first quartiles (75th and 25th percentile), respectively. The whiskers extend up to 1.5 times the interquartile range from the top (bottom) of the box to the furthest datum within that distance: Data beyond this distance are represented individually as points.
Fig. 1 ∣
Fig. 1 ∣. Pilot trial design and procedures.
a, Eligible participants were identified via database review and randomized to receive metformin or placebo in either an AB (metformin then placebo) or BA (placebo then metformin) sequence. MRI and cognitive testing were conducted at study entry (baseline 1), after ~12 weeks of treatment 1 (outcome 1), after a 10-week washout period at 22 weeks (baseline 2) and at the end of the trial at ~34 weeks (outcome 2). b, Safety and feasibility outcomes. c, Cognitive outcomes included tests of auditory-verbal memory using the CAVLT-2 or RAVLT, and tests of visual-spatial memory and working memory from the NIH Toolbox. We also calculated a composite accuracy and latency score across tests of attention, short-term memory and processing speed from the CANTAB. d, MRI outcomes included WMTI metrics sensitive to myelin (AWF and extra-axonal radial diffusivity (De,⊥)). An AWF map is shown from within the corpus callosum acquired from DKI and arterial spin labeling (ASL) within the hippocampus. Both the corpus callosum and hippocampus were delineated using an anatomic T1 sequence and a semiautomated segmentation pipeline using FreeSurfer. DKI and ASL scans were registered with the anatomic T1 sequence to obtain the respective metrics within the corpus callosum and hippocampus.
Fig. 2 ∣
Fig. 2 ∣. Cranial radiation leads to cellular and cognitive deficits and metformin is able to rescue these deficits in females.
a, Experimental schematic. b, Fold change in the number of neurospheres from the SVZ 2 d after radiation (n = 8 mice per group over three independent experiments; t(14) = 2.81, P = 0.01; two-sided unpaired t test). Ctrl, control; IR, cranial radiation. c, Fold change in the number of neurospheres from the DG 1 d after radiation on P17 (n = 4 Ctrl and 3 IR mice over three independent experiments; t(5) = 4.04, P = 0.01; two-sided unpaired t test). d,e, Fold change in the number of neurospheres from the SVZ (n = 17 Ctrl, 16 IR and 18 IR + Met mice over ten independent experiments; F(2,48) = 0.11, P = 0.89; one-way ANOVA) (d) and DG (n = 10 mice per group over four independent experiments; F(2,27) = 9.81, P = 0.001; Ctrl vs. IR, P = 0.002; IR vs. IR + Met, P = 0.002; one-way ANOVA with Tukey’s test) (e) 5 weeks after radiation. Met, metformin. f,h, Numbers of DCX+ cells per section in the female (n = 3 Ctrl, 4 IR and 5 IR + Met mice over three independent experiments; F(2,9) = 2.453, P = 0.14; one-way ANOVA) (f) and male (n = 6 Ctrl, 5 IR and 6 IR + Met mice over three independent experiments; F(2,14) = 1.77, P = 0.21; one-way ANOVA) (h) SVZ after radiation and metformin treatment. g,i, DCX+ cells in the SVZ of female (g) and male (i) mice (scale bars, 50μm). j,l, Numbers of DCX+ cells per section in the female (n = 4 Ctrl, 6 IR and 5 IR + Met mice over four independent experiments; F(2,12) = 6.22, P = 0.01; Ctrl vs. IR, P = 0.01; Ctrl vs. IR + Met, P = 0.30; one-way ANOVA with Tukey’s test) (j) and male (n = 5 Ctrl, 5 IR and 7 IR + Met mice over four independent experiments; F(2,14) = 7.00, P = 0.008; Ctrl vs. IR, P = 0.008; Ctrl vs. IR + Met, P = 0.030; one-way ANOVA with Tukey’s test) (l) DG after radiation and metformin treatment. k,m, DCX+ cells in the DG of female (k) and male (m) mice (scale bars, 50μm). n, Y maze apparatus. o,p, Spontaneous alternation performance (SAP) measured using the Y maze at P43 in females (n = 21 Ctrl, 17 IR and 12 IR + Met mice over 12 independent experiments; F(2,47) = 6.04, P = 0.005; Ctrl vs. IR, P = 0.02; Ctrl vs. IR + Met, P = 0.71; one-way ANOVA with Tukey’s test) (o) and males (n = 12 Ctrl, 16 IR and 16 IR + Met mice over 12 independent experiments; F(2,41) = 0.11, P = 0.89; one-way ANOVA) (p). q, Novel place recognition apparatus. r,s, Percentage of time spent exploring objects in the novel place recognition task from P44-P46 in females (n = 21 Ctrl, 17 IR and 12 IR + Met mice over 12 independent experiments; F(2,47) = 0.98, P = 0.38; one-way ANOVA) (r) and males (n = 12 Ctrl, 16 IR and 16 IR + Met mice over 12 independent experiments; F(2,41) = 5.16, P = 0.01; Ctrl vs. IR, P = 0.02; Ctrl vs. IR + Met, P = 0.02; one-way ANOVA with Tukey’s test) (s). *P < 0.05, **P < 0.01; NS, not significant. Data are represented as means ±s.e.m.
Fig. 3 ∣
Fig. 3 ∣. Pilot trial adverse events and adherence.
a, The frequency of all adverse events experienced during metformin and placebo treatment for all participants. For comparison purposes, the graph shows the frequency of adverse events recorded during metformin treatment. Each participant is represented by a single color, and participants who experienced multiple adverse events are represented with the same color in both the metformin and placebo panels. All adverse events are reported, including 15 adverse events that were not attributed to metformin by the attending physician (for example, seizure and head injury/trauma in a single participant). During treatment with metformin, 19 participants experienced at least one adverse event and 14 of these reported multiple adverse events. One participant experienced nausea and diarrhea while being treated with metformin and withdrew from the study after 1 week. By comparison, when taking placebo, 13 participants experienced at least one adverse event (grade range 1-2) and 7 of these reported multiple adverse events. b, Adherence to taking the study pills and study procedures. Adherence was high except for magnetoencephalography (MEG) scanning, where there was a lack of usable neural data owing to poor adherence and motion artifact; this outcome was therefore not evaluated in the trial.
Fig. 4 ∣
Fig. 4 ∣. Baseline and outcome data points for LSWM, average reaction time on the CANTAB tests and immediate recall on the CAVLT-2/RAVLT.
a–f, Box plots showing baseline and outcome assessment data points used for the following model: cognitive outcome = cycle + treatment + sequence + covariate (cognitive baseline) + (1∳ participant ID) + ε, where cycle, treatment and sequence are independent fixed effects and the cognitive measure is total correct responses on LSWM at cycle 1 (a) and cycle 2 (b); average reaction time across CANTAB tests at cycle 1 (c) and cycle 2 (d); and total number of words recalled for immediate recall at cycle 1 (e) and cycle 2 (f). True/unadjusted mean (dashed line) and median (solid line) values are shown for each sequence group. The metformin treatment condition is shown in red, and the placebo condition is shown in blue. The upper and lower limits of the boxes are the third and first quartiles (75th and 25th percentile), respectively. The whiskers extend to 1.5 times the interquartile range from the top (bottom) of the box to the furthest datum within that distance; data beyond this distance are represented individually as points.
Fig. 5 ∣
Fig. 5 ∣. Baseline and outcome data points for AWF within the corpus callosum.
a, T1-weighted image in the axial plane. The red line depicts the slice shown in the adjacent sagittal view. b, AWF image in the axial plane. The red line depicts the slice shown in the adjacent sagittal view. c, Segmentation of the corpus callosum (CC) from FreeSurfer (red, anterior CC; green, middle anterior CC; magenta, central CC; yellow, middle posterior CC; blue, posterior CC). d, Volumes calculated for each region of interest from the T1-weighted image were used to weight the mean AWF across the whole corpus callosum. e, A single weighted mean of the AWF across all corpus callosum regions was calculated. f,g, Box plots showing baseline and outcome assessment data points used for the following model: diffusion imaging outcome = cycle + treatment + sequence + covariate (diffusion imaging baseline) + (1∣ participant ID) + ε, where cycle, treatment and sequence are independent fixed effects and the diffusion imaging measure is AWF at cycle 1 (f) and cycle 2 (g). True/unadjusted mean (dashed line) and median (solid line) values are shown for each sequence group. The metformin treatment condition is shown in red, and the placebo condition is shown in blue. The upper and lower limits of the box are the third and first quartiles (75th and 25th percentile), respectively. The whiskers extend to 1.5 times the interquartile range from the top (bottom) of the box to the furthest datum within that distance; data beyond this distance are represented individually as points.

References

    1. Miller FD & Kaplan DR Mobilizing endogenous stem cells for repair and regeneration: are we there yet? Cell Stem Cell 10, 650–652 (2012). - PubMed
    1. Ming GL & Song H Adult neurogenesis in the mammalian brain: significant answers and significant questions. Neuron 70, 687–702 (2011). - PMC - PubMed
    1. Lazarini F & Lledo PM Is adult neurogenesis essential for olfaction? Trends Neurosci. 34, 20–30 (2011). - PubMed
    1. Wang J et al. Metformin activates an atypical PKC–CBP pathway to promote neurogenesis and enhance spatial memory formation. Cell Stem Cell 11, 23–35 (2012). - PubMed
    1. Chow A & Morshead CM Cyclosporin A enhances neurogenesis in the dentate gyrus of the hippocampus. Stem Cell Res. 16, 79–87 (2016). - PubMed

Publication types

MeSH terms

Associated data