. 2021 Jan;5(1):77-88.
doi: 10.1038/s41551-020-0592-z. Epub 2020 Jul 27.

Classification of T-cell activation via autofluorescence lifetime imaging

Affiliations

Classification of T-cell activation via autofluorescence lifetime imaging

Alex J Walsh et al. Nat Biomed Eng. 2021 Jan.

Abstract

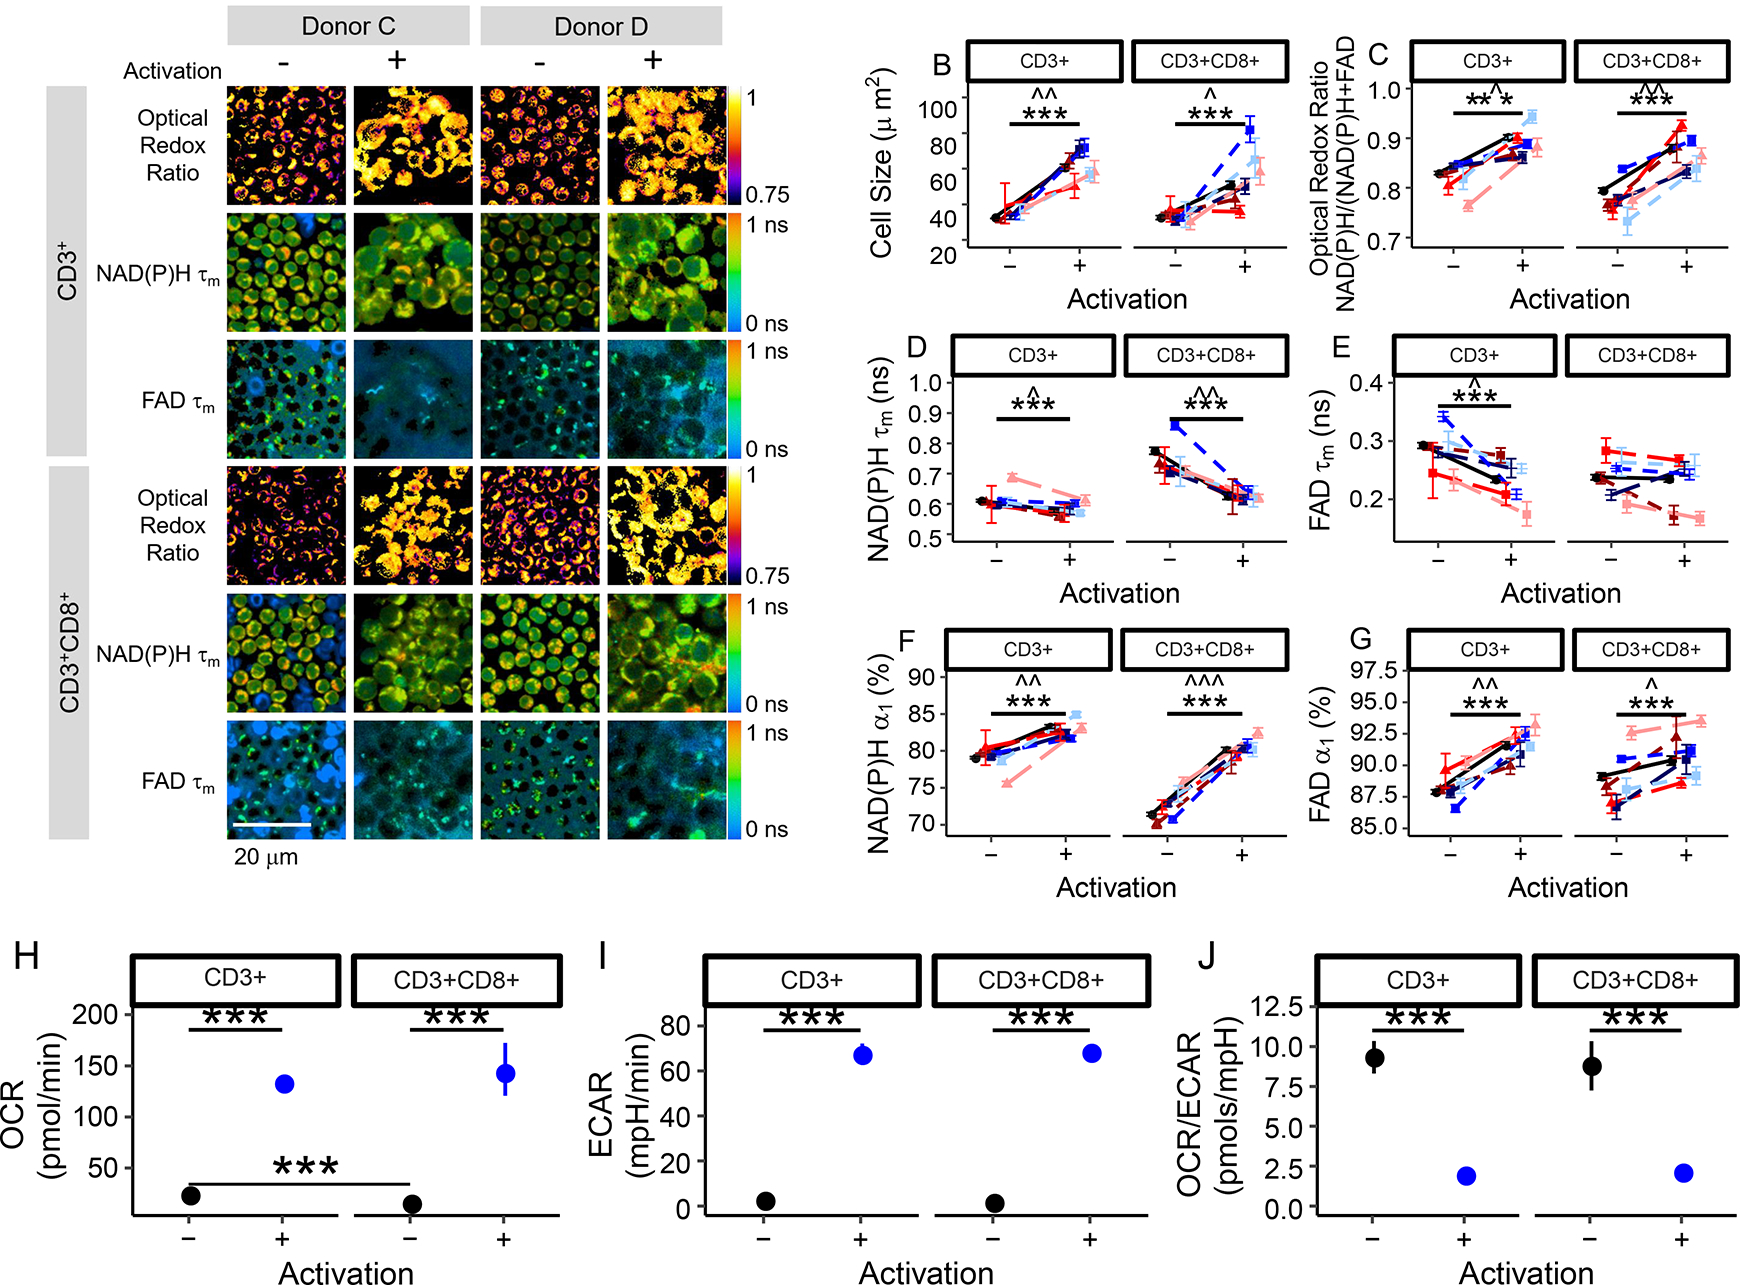
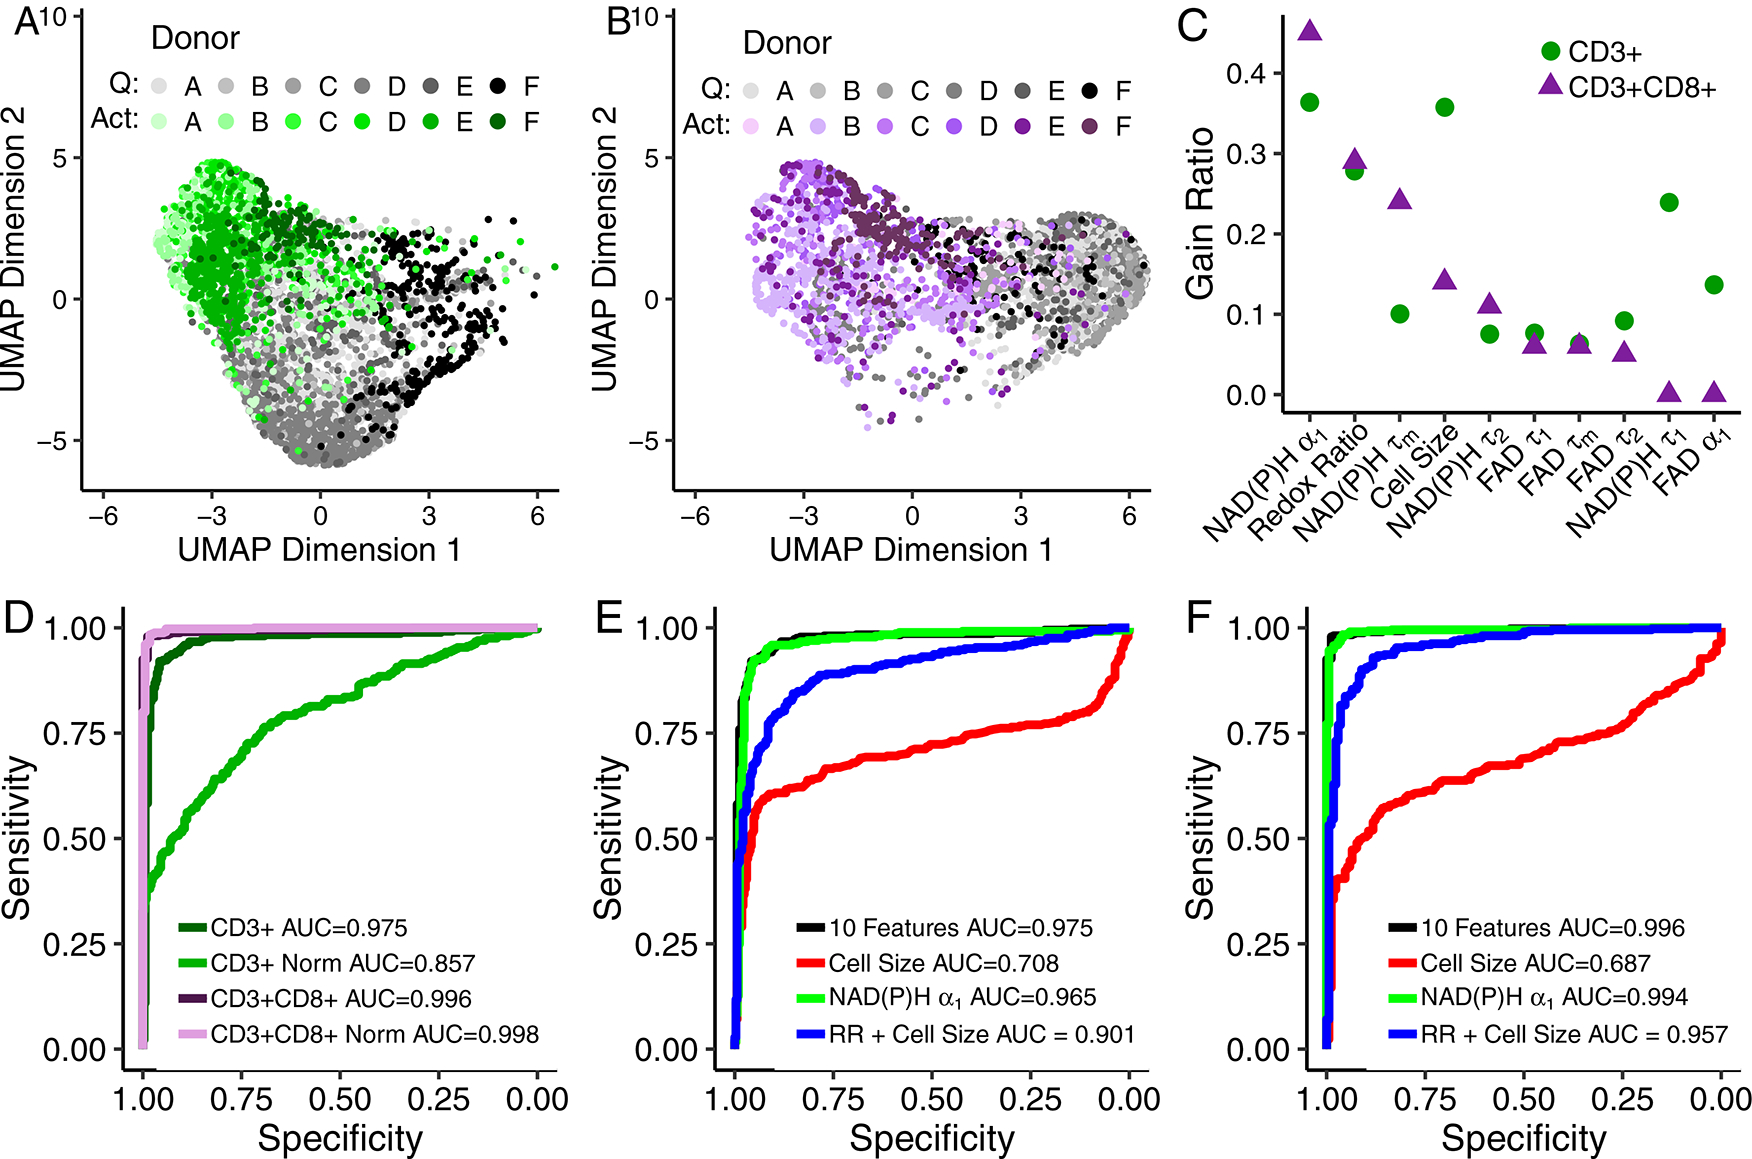
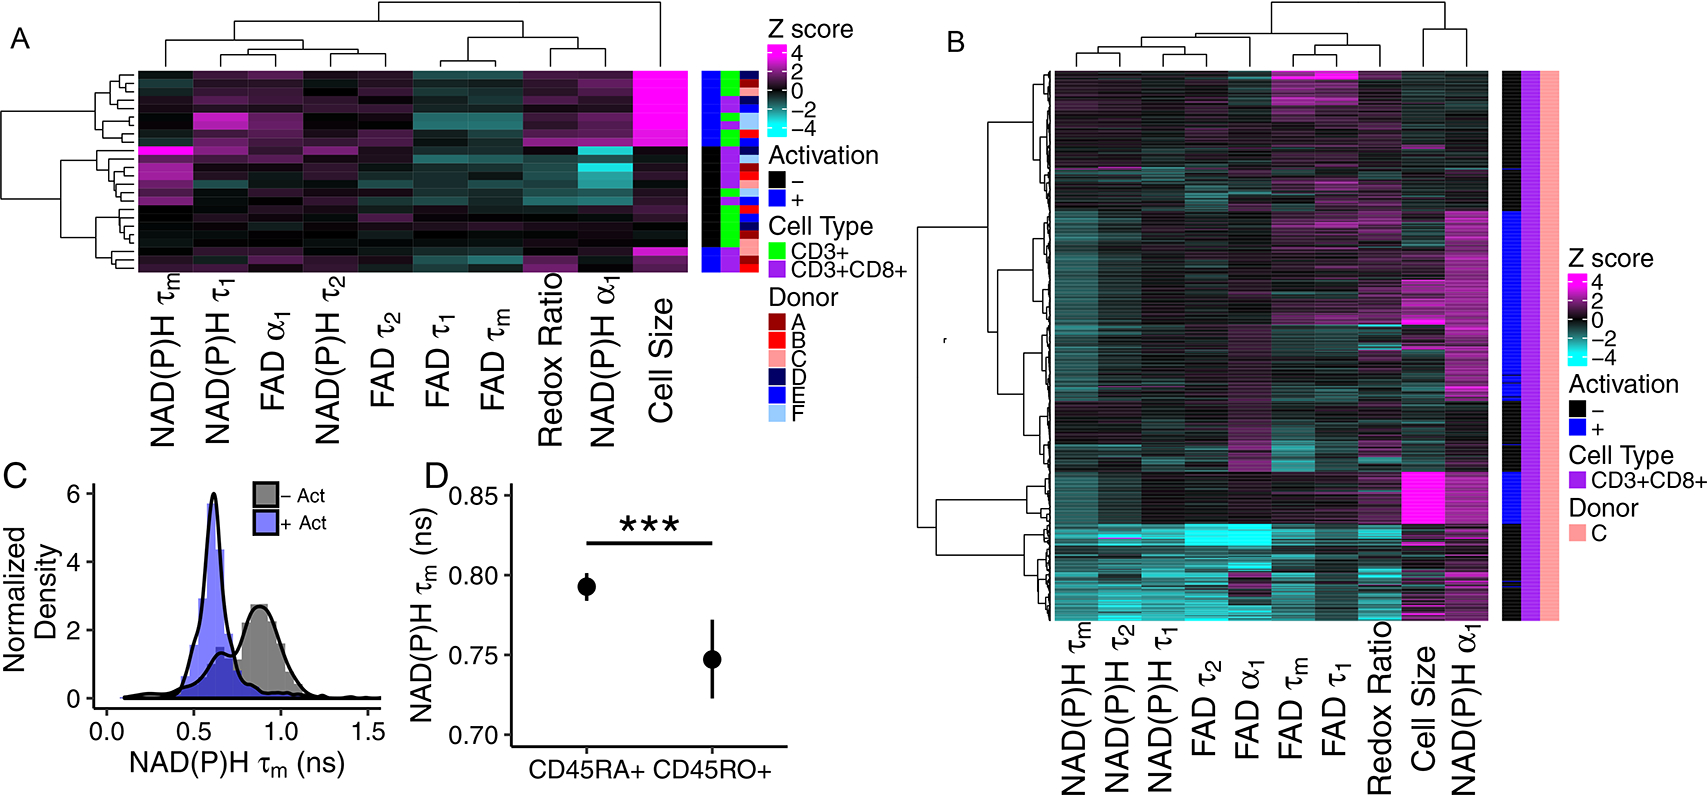
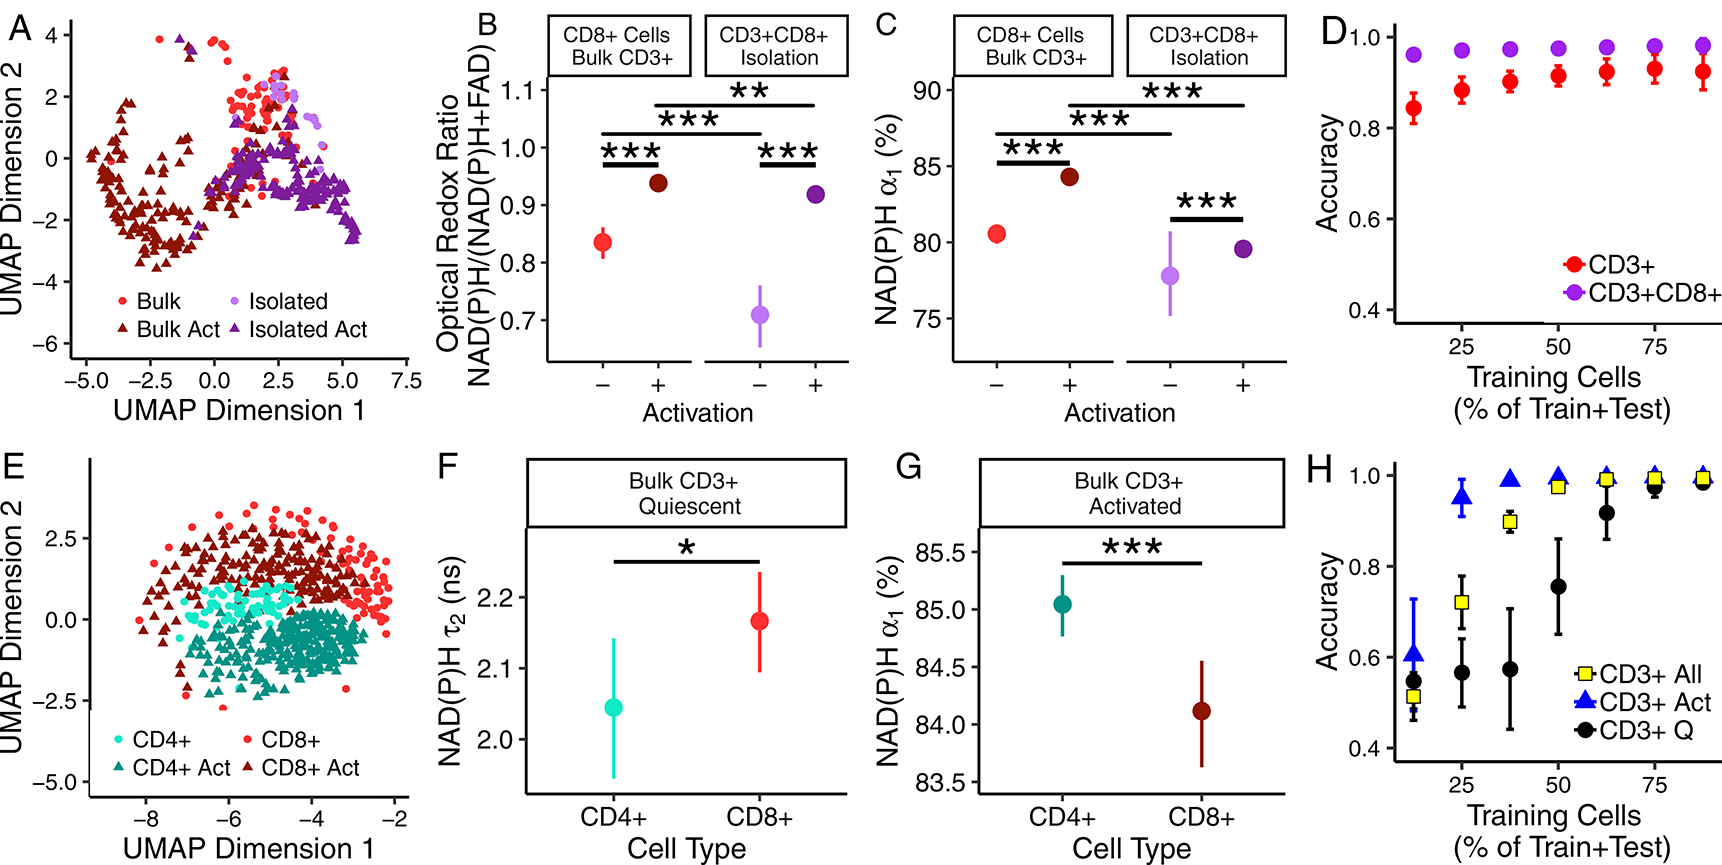
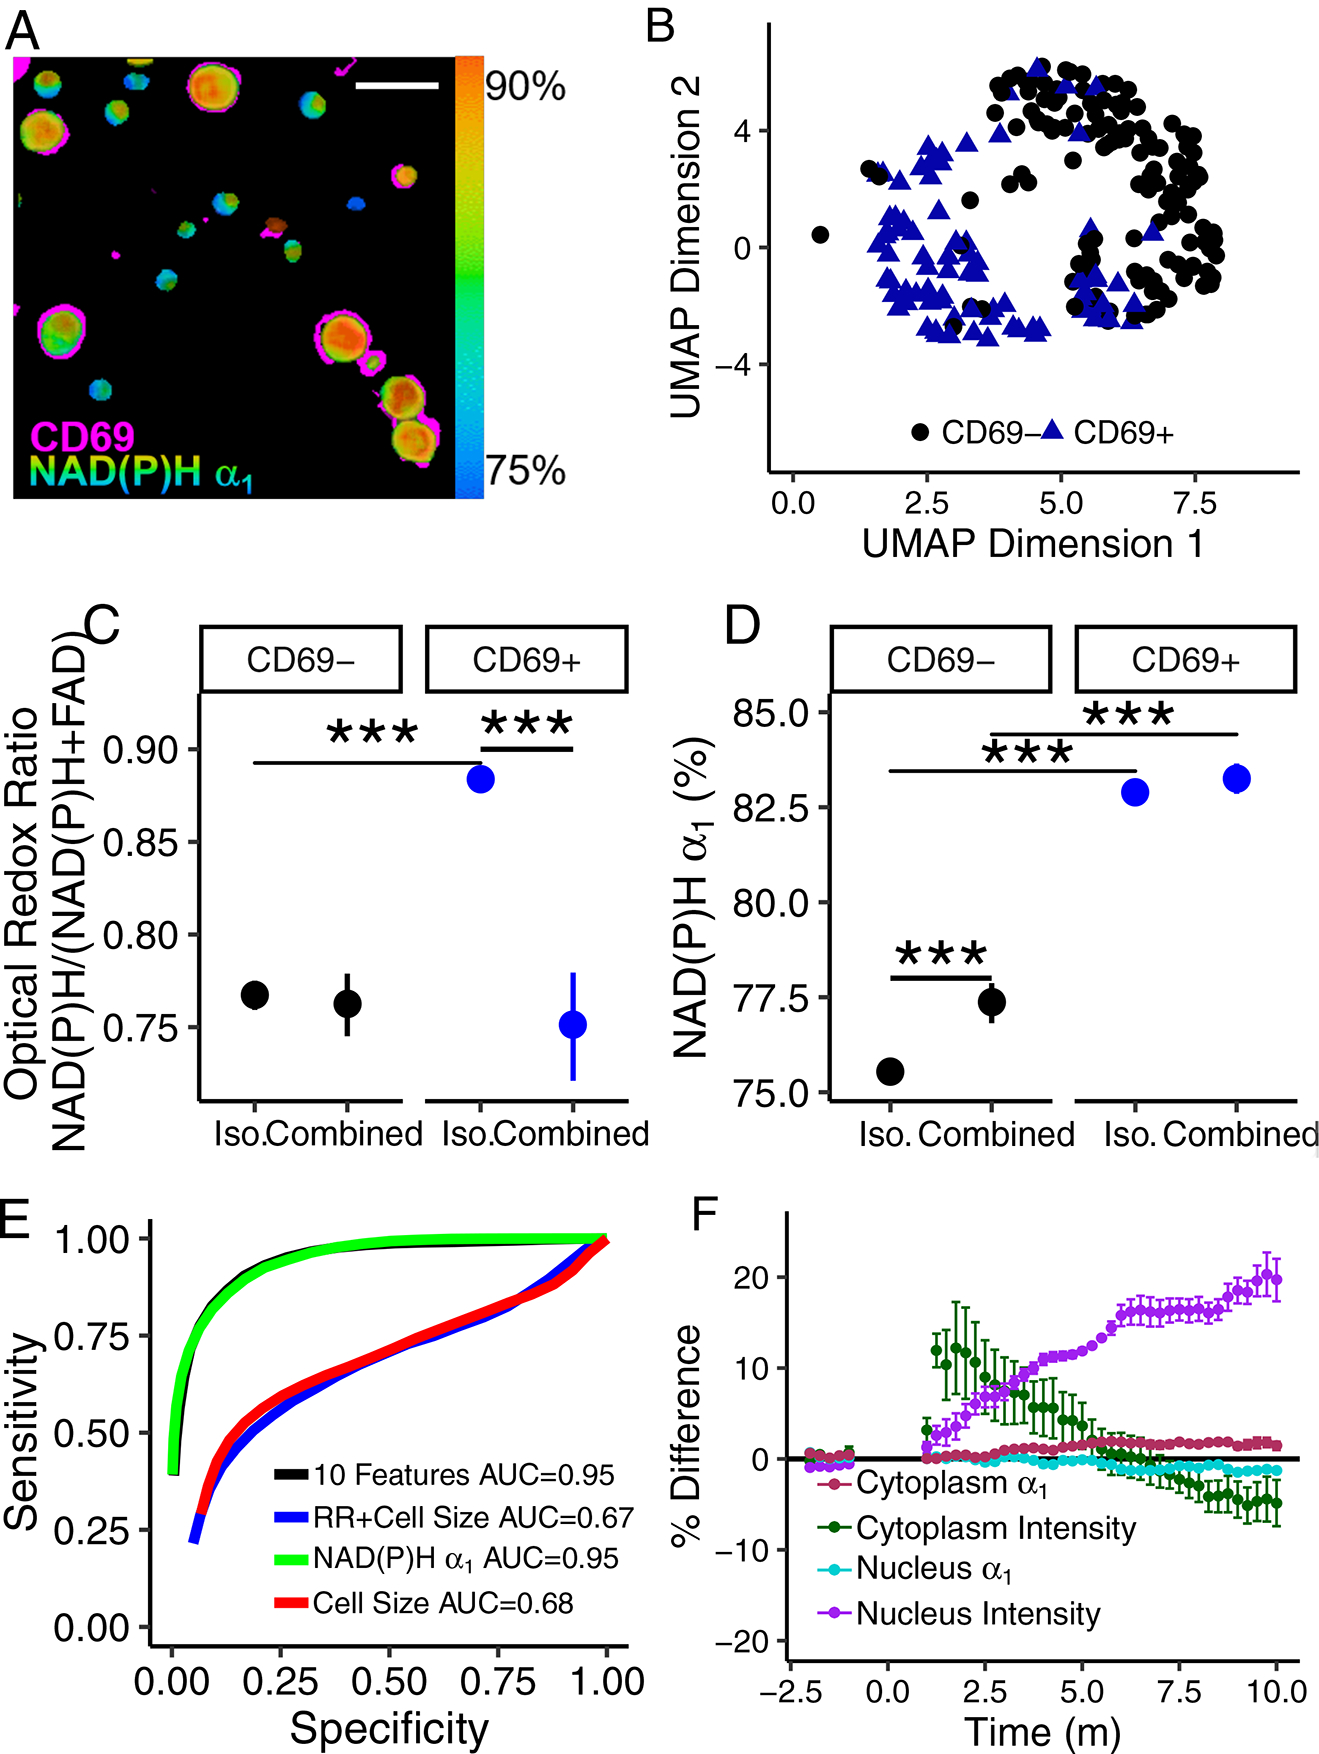
The function of a T cell depends on its subtype and activation state. Here, we show that imaging of the autofluorescence lifetime signals of quiescent and activated T cells can be used to classify the cells. T cells isolated from human peripheral blood and activated in culture using tetrameric antibodies against the surface ligands CD2, CD3 and CD28 showed specific activation-state-dependent patterns of autofluorescence lifetime. Logistic regression models and random forest models classified T cells according to activation state with 97-99% accuracy, and according to activation state (quiescent or activated) and subtype (CD3+CD8+ or CD3+CD4+) with 97% accuracy. Autofluorescence lifetime imaging can be used to non-destructively determine T-cell function.


Conflict of interest statement

Competing interests

A.W. and M.S. are mentioned as co-inventors in a patent application (“Systems and methods for sorting T cells by activation state”, #62/724428, August 2018) covering devices and methods to sort T cells based on fluorescence-lifetime components.

Figures

Fig. 1 |
Fig. 1 |. NAD(P)H and FAD autofluorescence imaging reveals metabolic differences between quiescent and activated T cells.
(a) Representative optical redox ratio, NAD(P)H τm, and FAD τm images (4 images selected out of 202 images acquired from 6 different donors with similar results) of quiescent (columns 1, 3) and activated (columns 2, 4) CD3+ (rows 1–3) and CD3+CD8+ (row 4–6) T cells from two different donors. Scale bar is 20 μm. Cell size (b), optical redox ratio (c), NAD(P)H τm (d), FAD τm (e), NAD(P)H α1 (f), and FAD α1 (g) of quiescent and activated CD3+ and CD3+CD8+ T cells. Black circles represent mean of all data (6 donors), triangles (donors A [dark red], B [medium red], and F [light red]) represent data from female donors, squares (donors C [dark blue], D [medium blue], and E [light blue]) represent data from male donors. Each colour shade represents data from an individual donor. Data are mean +/− 99% CI. Horizontal lines indicate statistical comparisons, Stars (*** p<0.001) indicate statistical comparisons at the cellular level (n=4,877 biologically independent CD3+ T cells from 6 donors and n=3,478 biologically independent CD3+CD8+ T cells from 6 donors) from a two-sided logistic regression, generalized linear model using an α significance level of 0.05. Carets (B: ˆˆ p=0.001, ˆ=0.016; C: ˆ p=0.011, ˆˆ p=0.002; D: ˆ p=0.015, ˆˆ p=0.002; E: ˆ p=0.022; F: ˆˆ p=0.008, ˆˆˆ p<0.001; G: ˆˆ p=0.002, ˆ p=0.021) indicate significance at the donor level, n=6 biologically independent donors. Aggregated cellular data was compared using a double-sided paired t-test. (h-j) Cellular respiration increases in activated T cells. The oxygen consumption rate (OCR; panel H) and extracellular acidification rate (ECAR, panel I) are increased in activated bulk CD3+ and isolated CD3+CD8+ T cells. The ratio of OCR to ECAR (J) is significantly decreased in activated bulk CD3+ and isolated CD3+CD8+ T cells as compared with that of quiescent T cells. *** p<1*10−5, horizontal lines indicate statistical comparisons, double-sided, Student’s t-test, n=6 wells/group CD3+CD8+ isolation, n=12 wells/group CD3+ isolation (1 donor). Mean +/− 95% CI. Error bars smaller than the symbol for the mean are not shown.
Fig 2 |
Fig 2 |. Autofluorescence imaging endpoints allow classification of quiescent and activated T cells.
(A-B) UMAP data reduction technique allows visual representation of the separation between quiescent (“Q”) and activated (“Act”) bulk CD3+ (A) and isolated CD3+CD8+ (B) T cells. Each colour corresponds to a different donor, greys correspond to quiescent cells and green or purple to activated CD3+ or CD3+CD8+ T cells, respectively. Data are from 6 donors. Each dot represents a single cell, n=4,877 CD3+ T cells and n=3,478 CD3+CD8+ T cells. (C) Feature weights for classification of quiescent versus activated T cells by the gain ratio method. Analysis was performed at the cellular level with data from 6 donors. (D) ROC curves of the test data for logistic regression models for classification of activation state within bulk CD3+ T cells, bulk CD3+ T cells normalized within each donor (CD3+ Norm), isolated CD3+CD8+ T cells, and isolated CD3+CD8+ T cells normalized within each donor (CD3+CD8+ Norm). (E-F) ROC curves of the test data for logistic regression classification models computed using different features for the classification of (E) quiescent or activated bulk CD3+ or (F) isolated CD3+CD8+ T cells. Models for subfigures D-F were trained on cells that lacked same cell validation data from donors A, B, C, and D but were known to be quiescent or activated by culture conditions (n = 4,131 biologically independent CD3+ cells, n=2,655 biological independent CD3+CD8+ cells), and cells from donors B, E, and F with CD69 validation of activation state were used to test the models (n = 696 biologically independent CD3+ cells, n=595 biologically independent CD3+CD8+ cells). Redox Ratio = NAD(P)H/(NAD(P)H+FAD).
Fig 3 |
Fig 3 |. Autofluorescence imaging reveals inter- and intra-donor T cell heterogeneity.
(A) Heatmap of z-scores of NAD(P)H and FAD autofluorescence imaging endpoints where each row is the mean data aggregating all cells from a single donor, subtype (CD3+ or CD3+CD8+), and activation, n=6 biologically independent donors. Data clusters by activation state and isolation (bulk CD3+ or isolated CD3+CD8+). (B) Heatmap of z-scores of NAD(P)H and FAD autofluorescence imaging endpoints of CD3+CD8+ T cells from a single donor, each row is a single cell (n=635 cells). Distinct clusters are identified within the quiescent and activated CD3+CD8+ T cells. (C) Histogram analysis of NAD(P)H τm reveals two populations in quiescent CD3+CD8+ T cells across all 6 donors (n=2126 quiescent cells, 1352 activated cells, - Act = quiescent cells, + Act = cells exposed to anti-CD3/CD2/CD28 for 48hr). (D) NAD(P)H τm is decreased in CD45RO+ CD3+CD8+ T cells compared to NAD(P)H τm of CD45RA+ CD3+CD8+ T cells (CD45RA+ n=265 cells, CD45RO+ n=33 cells from 3 donors, *** p=0.00058, two-sided logistic regression, generalized linear model. p>0.05 for data aggregated to the donor level, two-sided paired t-test.) Mean +/− 95% confidence interval. Redox Ratio = NAD(P)H/(NAD(P)H+FAD).
Fig 4 |
Fig 4 |. T cell population composition affects T cell autofluorescence.
(A) UMAP of NAD(P)H and FAD autofluorescence endpoints of quiescent and activated (“Act”) CD3+CD8+ T cells identified within bulk CD3+ and specific CD3+CD8+ isolations, n=477 biologically independent cells from 3 donors. (B) Optical redox ratio and (C) NAD(P)H α1 of CD3+CD8+ T cells cultured as an isolated population (CD3+CD8+ specific isolation, n=39 quiescent cells, n=174 activated cells, from 3 donors) and with CD3+CD4+ T cells (bulk CD3+ isolation, n=83 quiescent cells, n=170 activated cells, from 3 donors). Mean +/− 95% confidence interval. Horizontal lines indicate statistical comparisons, ** p=0.002, *** p<0.001 for cell level comparisons using a two sided logistic regression, linear generalized model. Donor level p-values provided in Supplementary Tables 2–4. (D) Accuracy of random forest classification of quiescent versus activated CD3+CD8+ T cells from CD3+CD8+ specific isolation (n=213 cells, 3 donors) and bulk CD3+ isolation (n=253 cells, 3 donors). Mean +/− 95% confidence interval for 50 iterations. (E) UMAP of NAD(P)H and FAD autofluorescence imaging endpoints of quiescent and activated CD3+CD4+ and CD3+CD8+ cells identified within bulk CD3+ populations, n=583 biologically independent cells from 3 donors. (F) NAD(P)H τ2 of quiescent CD3+CD4+ and CD3+CD8+ cells (bulk CD3+ isolation, n=66 quiescent CD3+CD4+ T cells, n=83 quiescent CD3+CD8+ T cells from 3 donors, * p=0.04, two-sided logistic regression, generalized linear model; p>0.05 for two sided paired t-test at the donor level, mean +/− 95% confidence interval). (G) NAD(P)H α1 of activated CD3+CD4+ and CD3+CD8+ cells (bulk CD3+ isolation, n=264 activated CD3+CD4+ T cells, n=170 activated CD3+CD8+ T cells from 3 donors, *** p=0.0004, two-sided logistic regression, generalized linear model; p>0.05 for two sided paired t-test at the donor level, mean +/− 95% confidence interval. (H) Accuracy of random forest classification of CD3+CD4+ and CD3+CD8+ T cells from quiescent (2 group classification, “CD3+ Q”), activated (2 group classification, “CD3+ Act”), or both quiescent and activated T cells (4 group classification, “CD3+ All”) within bulk CD3+ isolations, total observations include 66 quiescent CD3+CD4+ T cells, 83 quiescent CD3+CD8+ T cells, 264 activated CD3+CD4+ T cells, and 170 activated CD3+CD8+ T cells from 3 donors. Mean +/− 95% confidence interval for 50 iterations.
Fig 5 |
Fig 5 |. Autofluorescence imaging allows classification of quiescent and activated T cells within combined quiescent and activated T cell populations.
(A) Representative NAD(P)H α1 image of 4 images acquired with similar results of combined quiescent (CD69) and activated (CD69+) T cells with CD69 immunofluorescence overlaid in pink. Scale bar is 30 μm. CD69 image is shifted to account for cell movement between frames. (B) UMAP representation of NAD(P)H and FAD imaging endpoints of CD69 and CD69+ CD3+ T cells from a combined population of quiescent and activated T cells, n=265 biologically independent cells from 1 donor. (C) Optical redox ratio and (D) NAD(P)H α1 of isolated (“Iso.”) and combined quiescent (CD69) and activated (CD69+) CD3+ T cells. Mean +/− 95% confidence interval. Horizontal lines indicate statistical comparisons, *** p<1*10−9 for cell level analysis using a two sided logistic regression, generalized linear model, n=733 biologically independent cells, single donor. (E) ROC curves of logistic regression classification of quiescent and activated CD3+ T cells from a combined population of CD69 and CD69+ T cells from a single donor, n=250 biologically independent cells. (F) Percent difference of NAD(P)H α1 and fluorescence intensity in CD3+ T cell nuclei and cytoplasms over time. Anti-CD2/CD3/CD28 added at t=0 m. Mean +/− SE of n=94 biologically independent cells from 3 different donors.

Comment in

  • Label-free T cell characterization.
    Mukhopadhyay M. Mukhopadhyay M. Nat Methods. 2020 Oct;17(10):957. doi: 10.1038/s41592-020-00975-7. Nat Methods. 2020. PMID: 32994563 No abstract available.

References

    1. Mosmann TR & Coffman RL in Advances in Immunology Volume 46 111–147 (Elsevier, 1989). - PubMed
    1. Bettelli E, Korn T & Kuchroo VK Th17: the third member of the effector T cell trilogy. Current Opinion in Immunology 19, 652–657 (Dec. 2007). - PMC - PubMed
    1. Pardoll DM The blockade of immune checkpoints in cancer immunotherapy. Nature Reviews Cancer 12, 252–264 (Apr. 2012). - PMC - PubMed
    1. Restifo NP, Dudley ME & Rosenberg SA Adoptive immunotherapy for cancer: harnessing the T cell response. Nature Reviews Immunology 12, 269–281 (Apr. 2012). - PMC - PubMed
    1. Canavan JB et al. Developing in vitro expanded CD45RA+ regulatory T cells as an adoptive cell therapy for Crohn’s disease. Gut 65, 584–594 (Feb. 2015). - PMC - PubMed

Publication types