. 2020 Aug;17(8):793-798.
doi: 10.1038/s41592-020-0905-x. Epub 2020 Jul 27.

Cumulus provides cloud-based data analysis for large-scale single-cell and single-nucleus RNA-seq

Affiliations

Cumulus provides cloud-based data analysis for large-scale single-cell and single-nucleus RNA-seq

Bo Li et al. Nat Methods. 2020 Aug.

Abstract

Massively parallel single-cell and single-nucleus RNA sequencing has opened the way to systematic tissue atlases in health and disease, but as the scale of data generation is growing, so is the need for computational pipelines for scaled analysis. Here we developed Cumulus-a cloud-based framework for analyzing large-scale single-cell and single-nucleus RNA sequencing datasets. Cumulus combines the power of cloud computing with improvements in algorithm and implementation to achieve high scalability, low cost, user-friendliness and integrated support for a comprehensive set of features. We benchmark Cumulus on the Human Cell Atlas Census of Immune Cells dataset of bone marrow cells and show that it substantially improves efficiency over conventional frameworks, while maintaining or improving the quality of results, enabling large-scale studies.


Conflict of interest statement

Competing interests

AR is a founder of and equity holder in for Celsius Therapeutics, an SAB member of ThermoFisher Scientific, Neogene Therapeutics, and Syros Pharamceuticals, and Asimov, and an equity holder in Immunitas. NH is a founder and SAB member of Neon Therapeutics.

Figures

Extended Data Fig. 1
Extended Data Fig. 1. The new HVG selection procedure provides excellent quality vs. the standard procedure.
a. New HVG selection procedure (n = 16,613 robust genes). Variance (y axis) vs. mean (x axis) of log expression. Red: fit LOESS curve. HVGs (blue) are defined as the genes above the LOESS curve. b. Curated immune genes captured by each procedure. The number of ImmPort curated immune genes selected by a standard HVG procedure (red) and Cumulus (blue). c. Analysis with HVGs by new approach highlighted an additional cell type (n = 274,182 bone marrow cells). FIt-SNE plots of cells from the bone marrow dataset generated by Cumulus with HVG genes selected by the standard (left) and new (right) procedure and colored by cell subset annotations. Bottom: Adjusted Mutual Information (AMI) score shows overall high concordance. Only the plot from the new procedure identifies megakaryocytes. HSCs: hematopoietic stem cells; MSCs: mesenchymal stem cells; cDCs: conventional dendritic cells; pDCs: plasmacytoid dendritic cells; NK cells: natural killer cells.
Extended Data Fig. 2
Extended Data Fig. 2. Benchmarking of batch correction methods on 34,654 bone marrow cells.
a. Execution time of each method. b.-g. UMAP visualizations of the bone marrow cells (n = 34,654) colored by either cell type annotation (left) or donor identity (right) without batch correction (b, baseline), Pegasus with L/S adjustment (c), ComBat (d), MNN (e), BBKNN (f), and Seurat v3 (g).
Extended Data Fig. 3
Extended Data Fig. 3. Benchmarking of approximate nearest neighbor finding methods on the bone marrow dataset (n = 274,182 cells).
Accuracy (a, y axis, % recall, Methods) and speed (b, y axis, minutes) of each of three methods. Boxplot (a): Line: median; box boundaries: lower and upper quartiles; whiskers: 1.5 interquartile range (IQR) below and above the low and high quartile, respectively.
Extended Data Fig. 4
Extended Data Fig. 4. Adjusting diffusion pseudotime map parameters for visualization of pseudotemporal trajectories.
a. Using a large number of diffusion pseudotime components yields a developmental trajectory that enhances separation of trajectories of different cell populations (n = 274,182 bone marrow cells). FLEs of single cell (colored by cell type annotation) generated from diffusion pseudotime maps (t = ∞) with 15 (left), 50 (middle) or 100 (right) components. CD8+ and CD4+ naïve T cells are fused together in the left FLE (circled in red). Erythrocytes and Pro-B cells are overlapped in the middle FLE (circled in Red). b. Choosing the timescale t for a diffusion pseudotime map. Von Neumann entropy (y axis) for diffusion maps with 100 components calculated from the bone marrow data at different timescales (x axis). Black point: knee point.
Extended Data Fig. 5
Extended Data Fig. 5. Spectral community detection algorithms combine the strengths of spectral clustering and community detection algorithms.
FIt-SNE of bone marrow single cells (dots, n = 274,182) colored by cluster assignment from (a) Spectral (left) vs. Louvain (right) clustering; (b) Louvain (left) vs. Spectral Louvain (right) clustering; or (c) Leiden (left) vs. spectral Leiden (right) clustering. Top: Execution time; bottom: Adjusted Mutual Information (AMI). Post hoc annotation labels are listed.
Extended Data Fig. 6
Extended Data Fig. 6. Deep-learning based visualization speeds up t-SNE and FLE visualizations while maintaining comparable quality.
Visualization of cell profiles (dots) from the full bone marrow data set (n = 274,182) colored by the same Louvain cluster membership (color; legend shows post hoc annotations) and laid out by (a) t-SNE (left), Net-tSNE (middle), or FIt-SNE (right); or (b) by FLE (left) or Net-FLE (right). Top: Execution time and kSIM acceptance rate.
Extended Data Fig. 7
Extended Data Fig. 7. Benchmark the count step with respect to number of channels for the bone marrow dataset.
Plot of maximum runtime in hours (left) and amortized total costs (right) in US dollars against the number of 10x channels.
Figure 1.
Figure 1.. Cumulus: a scalable, feature-rich, accessible cloud-based framework for sc/sn RNA-seq analysis.
a. Cumulus data analysis workflow. Cumulus takes raw BCL files as input and outputs diverse analysis results, with three key computational steps – mkfastq, count, and analysis. b. sc/snRNA-seq analysis tasks in Pegasus. c. Cumulus enables flexible interactive data visualization and analysis. Users can instantly visualize Cumulus analysis results with Cirrocumulus, or publicly available visualization tools such as cellxgene, UCSC cell browser and scSVA. They can also interactively explore them on Terra Jupyter notebooks using Pegasus and deposit their data into the Single Cell Portal.
Figure 2.
Figure 2.. Algorithmic and implementation improvements underlying Pegasus’s high scalability.
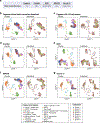
a. Trade-off between kBET and kSIM acceptance rates across different methods. kBET (y axis) and kSIM (x axis) acceptance rates of Pegasus, ComBat, MNN, BBKNN and Seurat v3 on 34,654 bone marrow cells. b. Improved resolution of a developmental bifurcation with diffusion pseudotime map with timescale selected by von Neumann entropy (n = 274,182 bone marrow cells). Diffusion maps of cells colored by subset annotation (color legend), generated by DPT (left) and Pegasus (right). Red square: area of bifurcation from hematopoietic stem cells (HSCs) to CD14+ monocytes (orange arrow) and conventional dendritic cells (cDCs, purple arrow) (zoom, right), in each map. c. Deep-learning-based efficient visualization with Net-*. From left: a small fraction of cells is subsampled based on local density and then embedded (e.g., with UMAP); a deep regressor is trained on the subsampled cells to predict the embedding coordinates; it is then used to predict embedding coordinates for remaining cells; all the coordinates are fine-tuned by applying the embedding algorithm (e.g., UMAP) for a small number of iterations. d. Net-UMAP visualization is faster than UMAP while maintaining visualization quality (n = 274,182 bone marrow cells). Embedding generated by UMAP (left) and Net-UMAP (right) of cells, colored by subset annotation. Top: Execution time and kSIM acceptance rate.

References

    1. Regev A et al. The human cell atlas white paper. arXiv:1810.05192 [q-bio] (2018).
    1. Macosko EZ et al. Highly parallel genome-wide expression profiling of individual cells using nanoliter droplets. Cell 161, 1202–1214 (2015). - PMC - PubMed
    1. Rosenberg AB et al. Single-cell profiling of the developing mouse brain and spinal cord with split-pool barcoding. Science 360, 176–182 (2018). - PMC - PubMed
    1. Cao J et al. The single-cell transcriptional landscape of mammalian organogenesis. Nature 566, 496–502 (2019). - PMC - PubMed
    1. Yang A, Troup M, Lin P & Ho JWK Falco: a quick and flexible single-cell RNA-seq processing framework on the cloud. Bioinformatics 33, 767–769 (2017). - PubMed

Publication types

MeSH terms