. 2020 Aug;2(8):763-774.
doi: 10.1038/s42255-020-0229-2. Epub 2020 Jul 27.

Profound and redundant functions of arcuate neurons in obesity development

Affiliations

Profound and redundant functions of arcuate neurons in obesity development

Canjun Zhu et al. Nat Metab. 2020 Aug.

Abstract

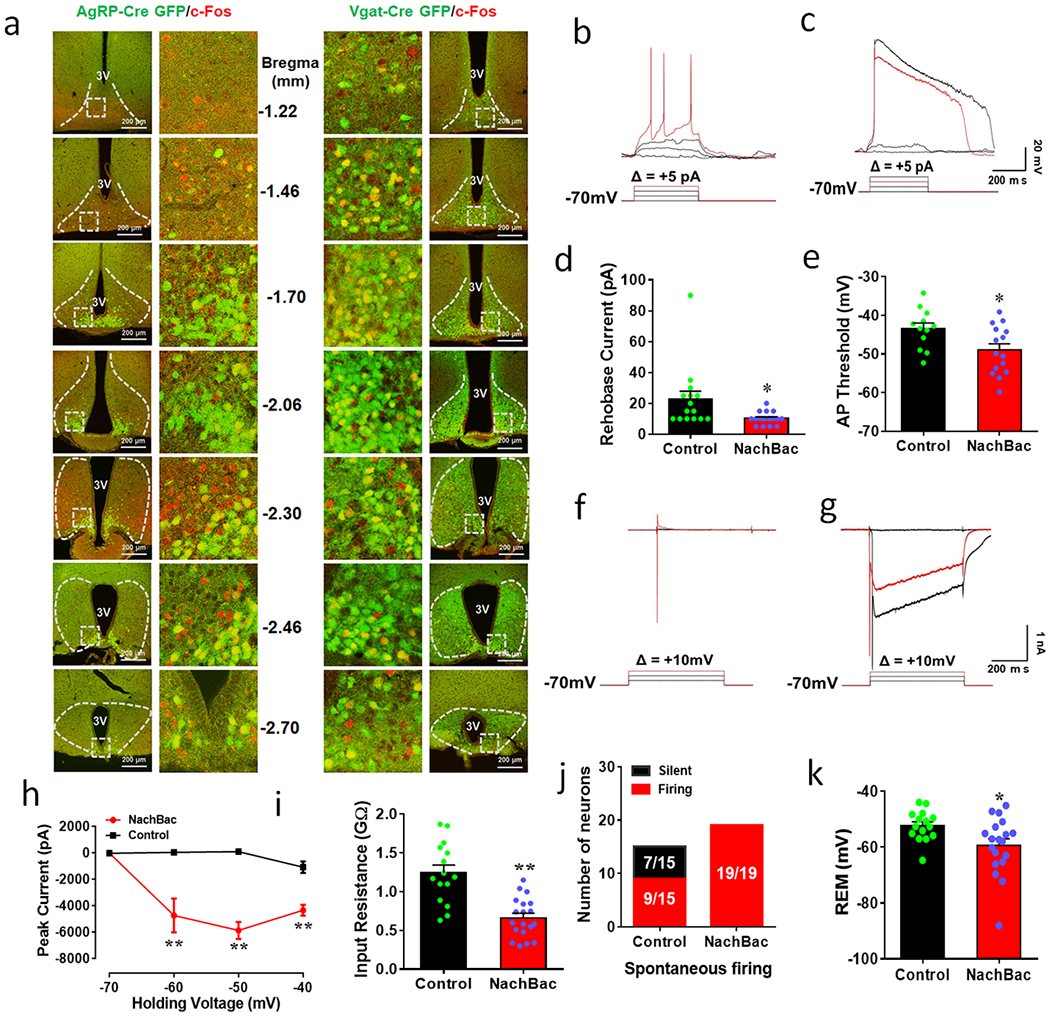
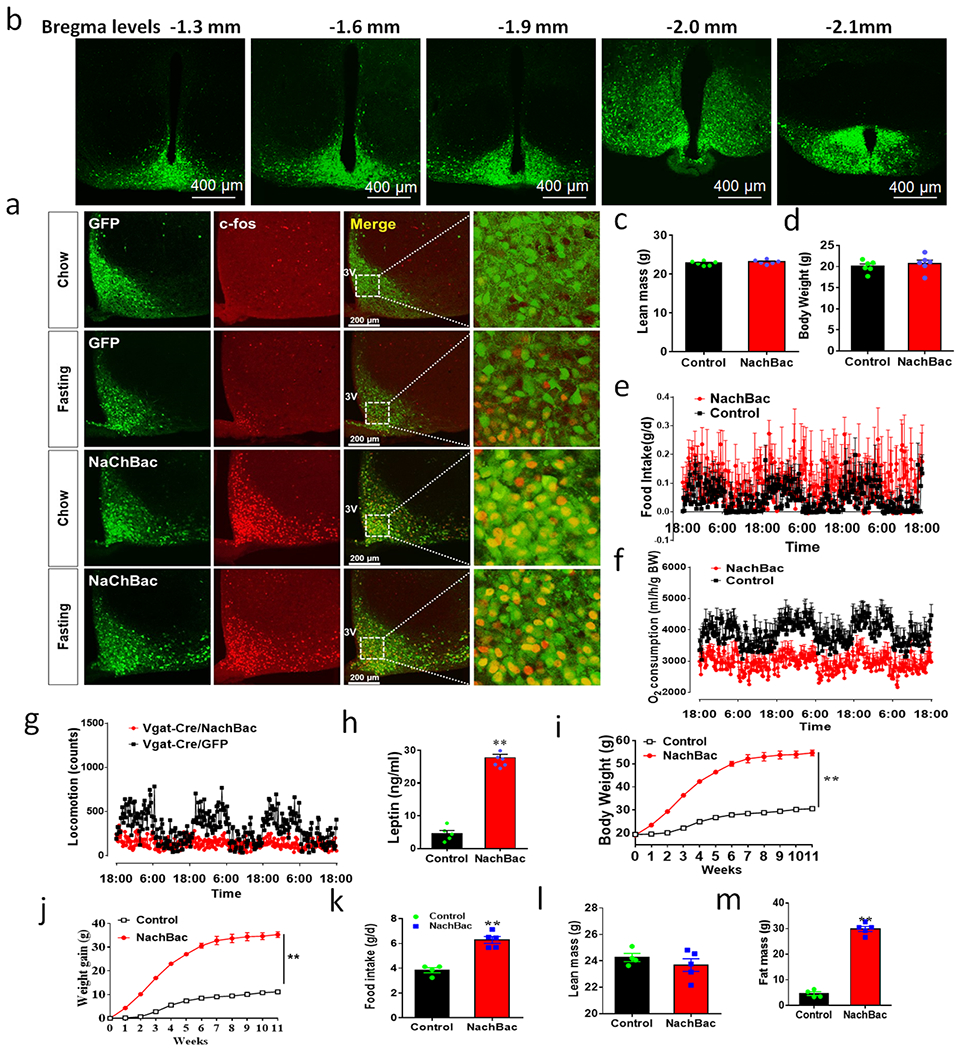
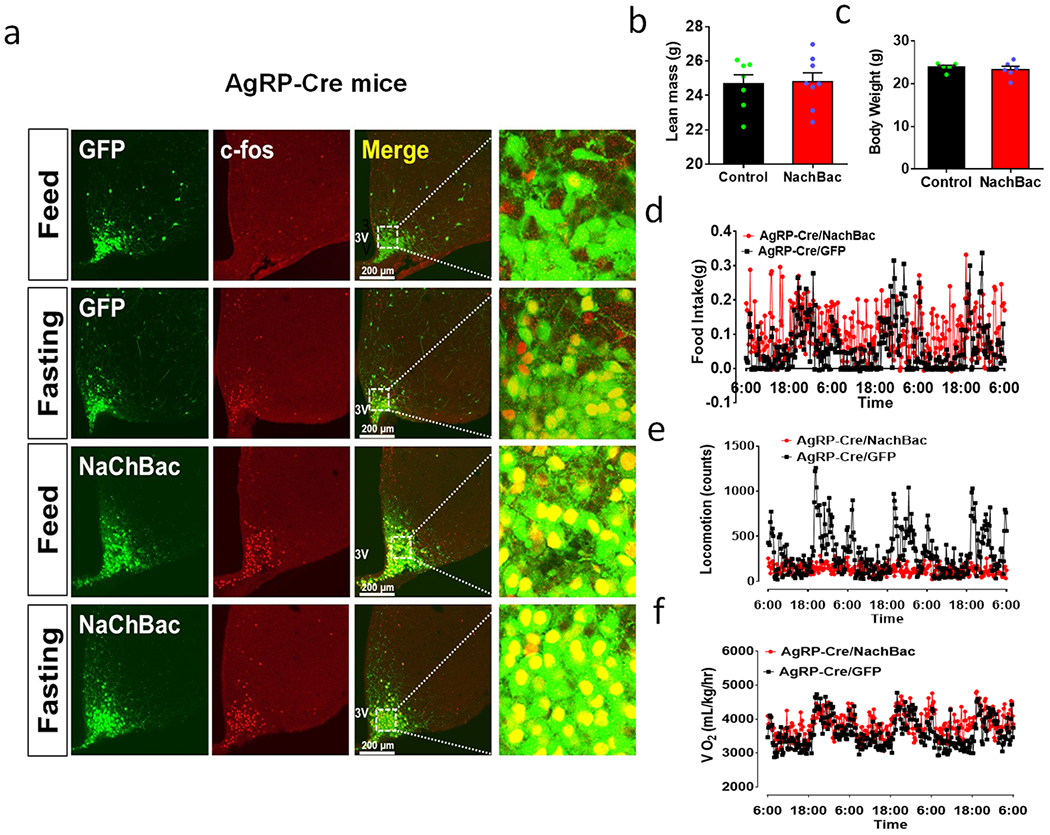
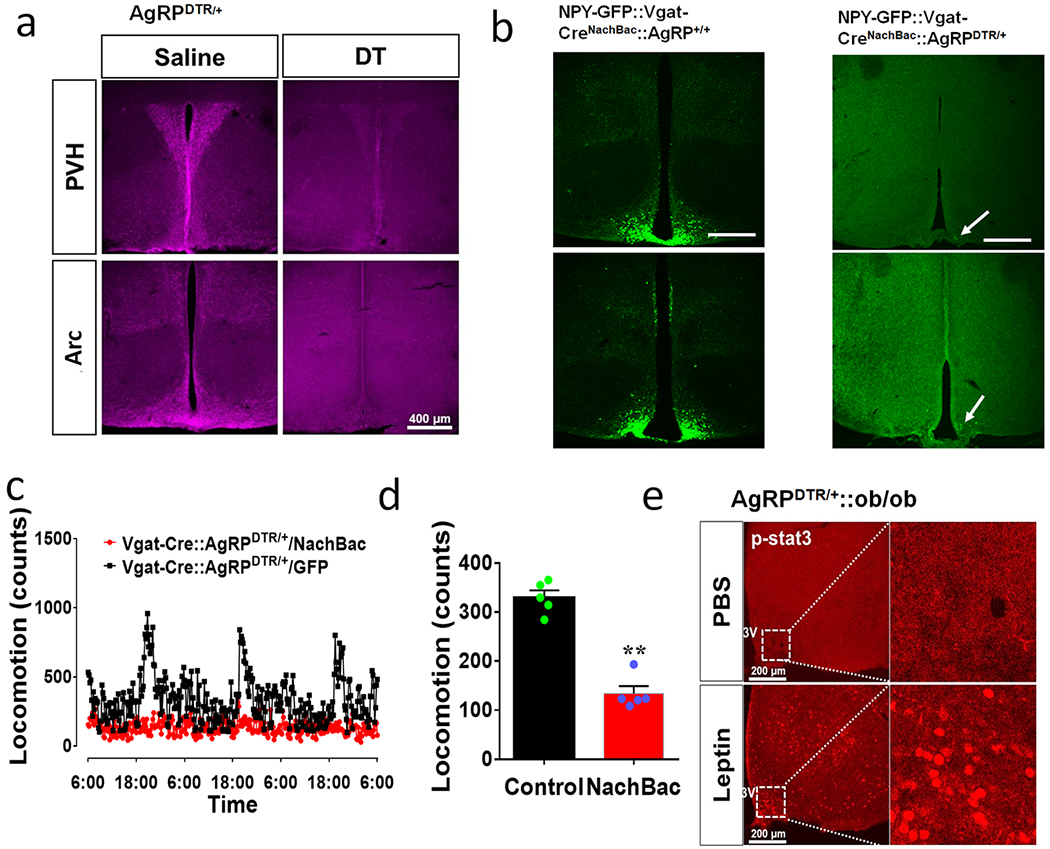
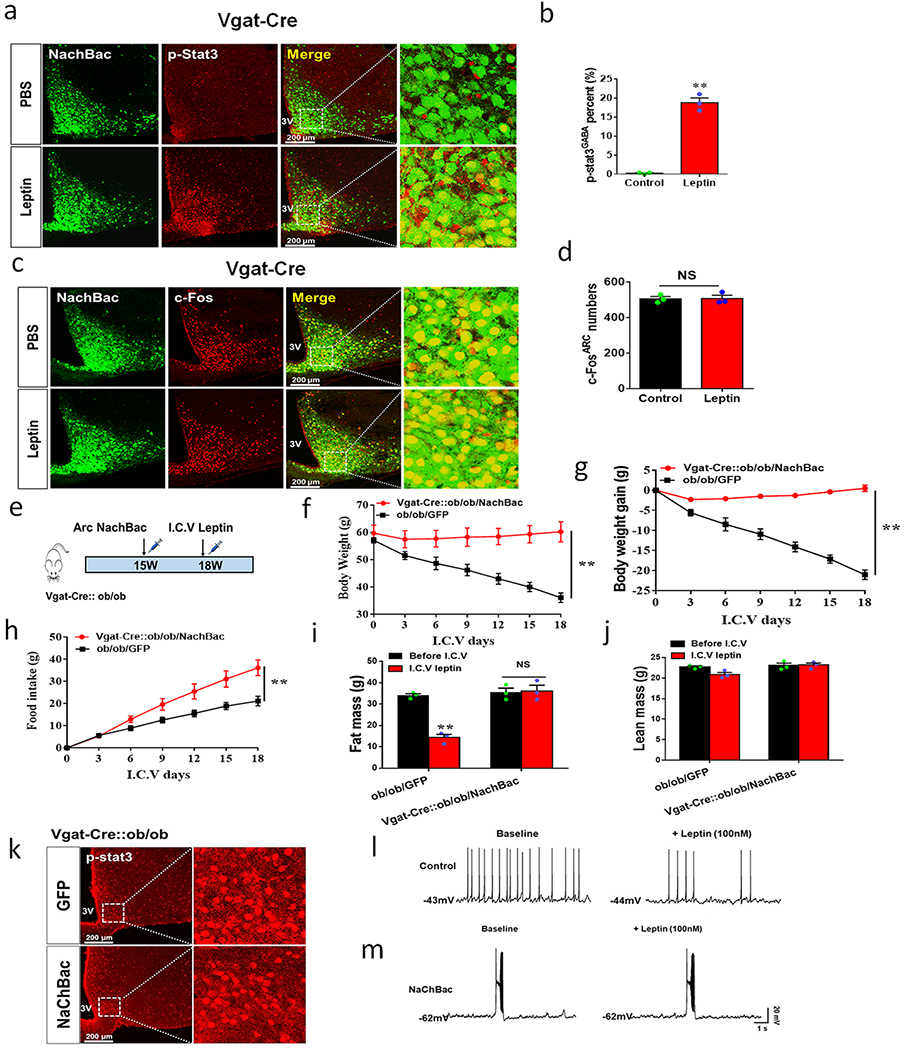
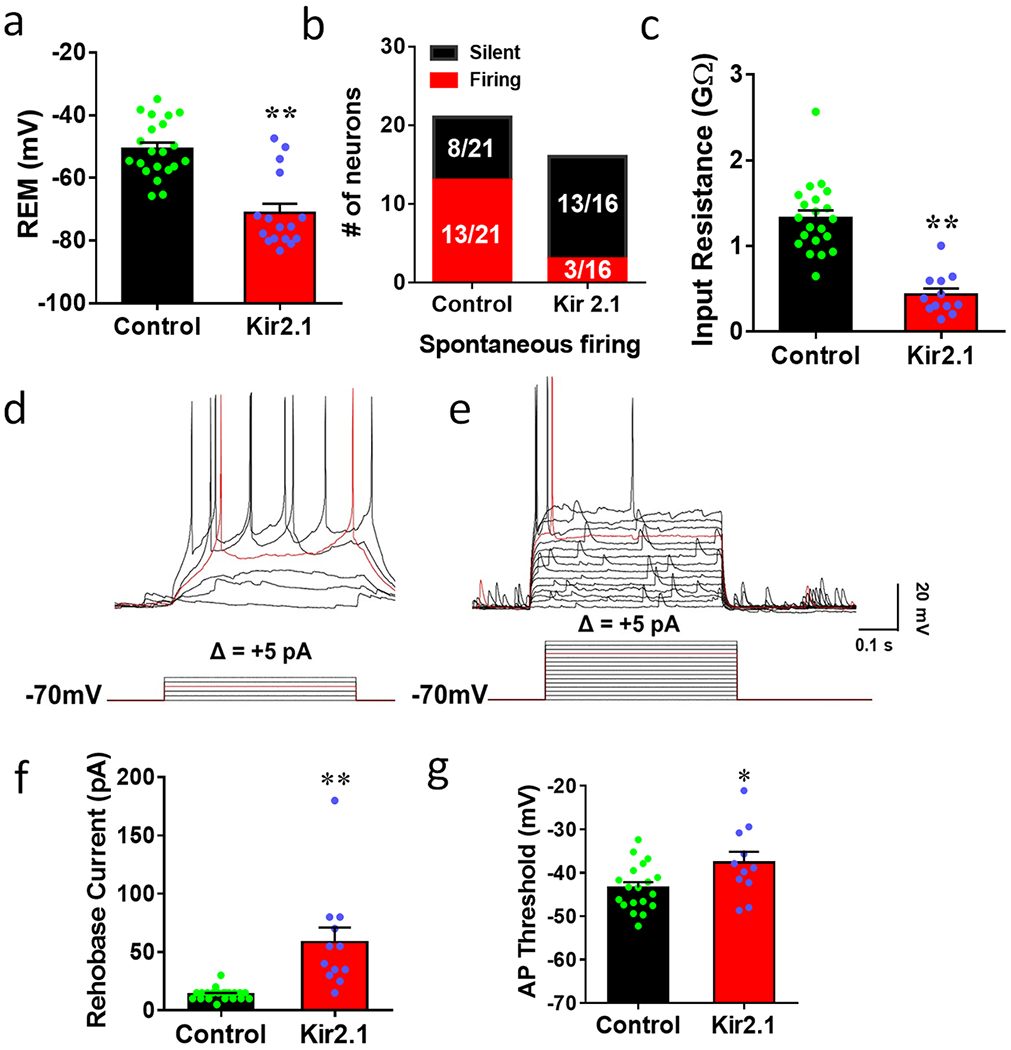
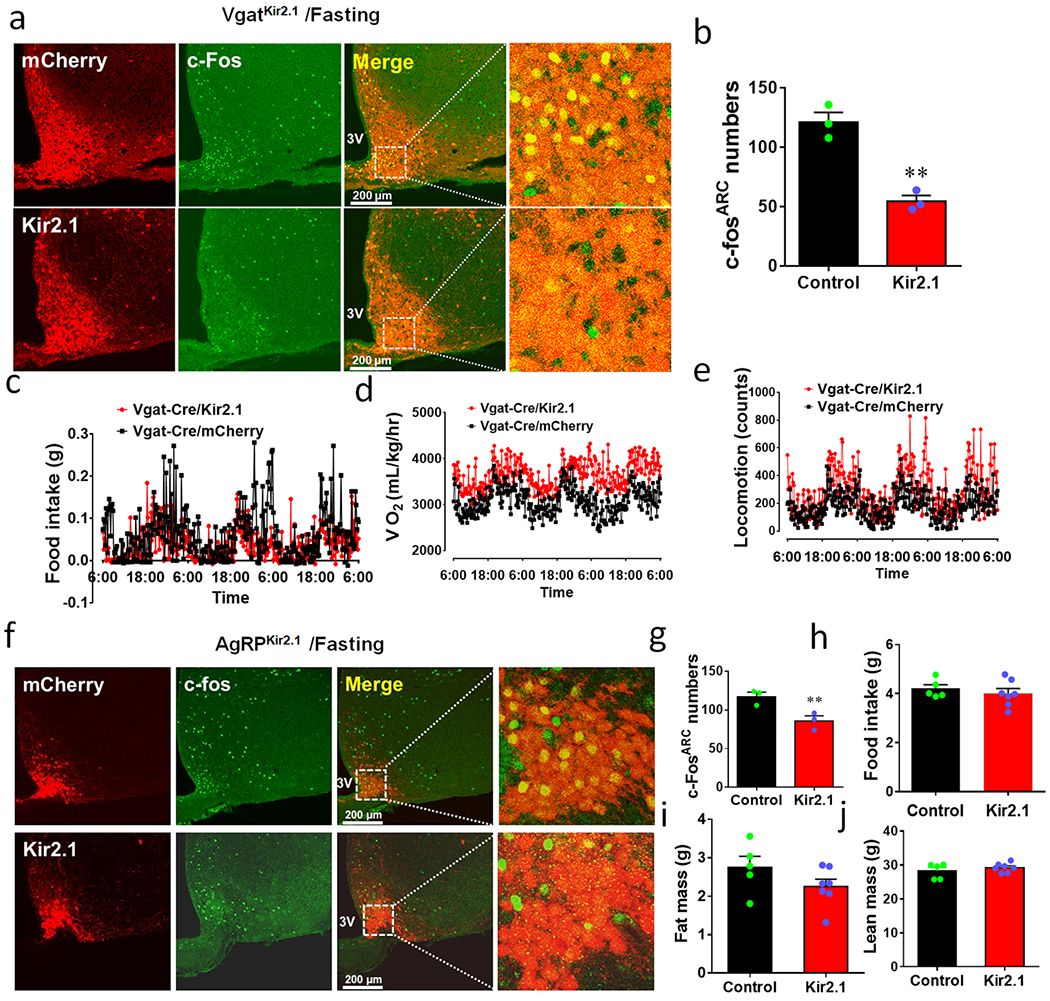
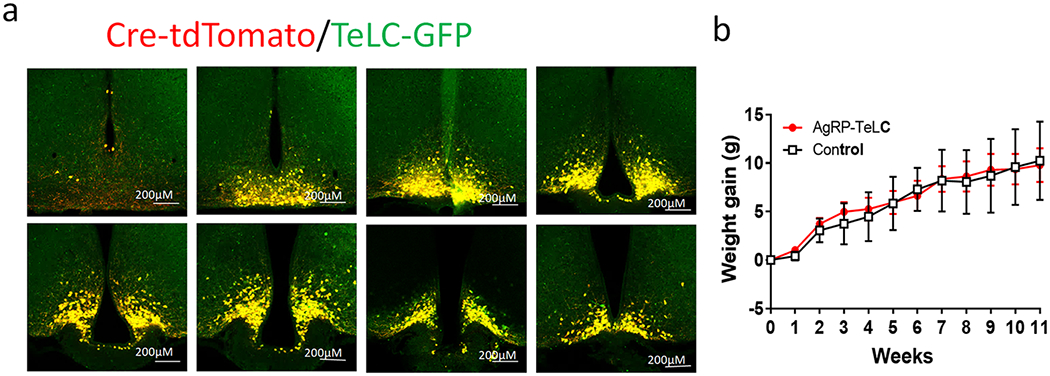
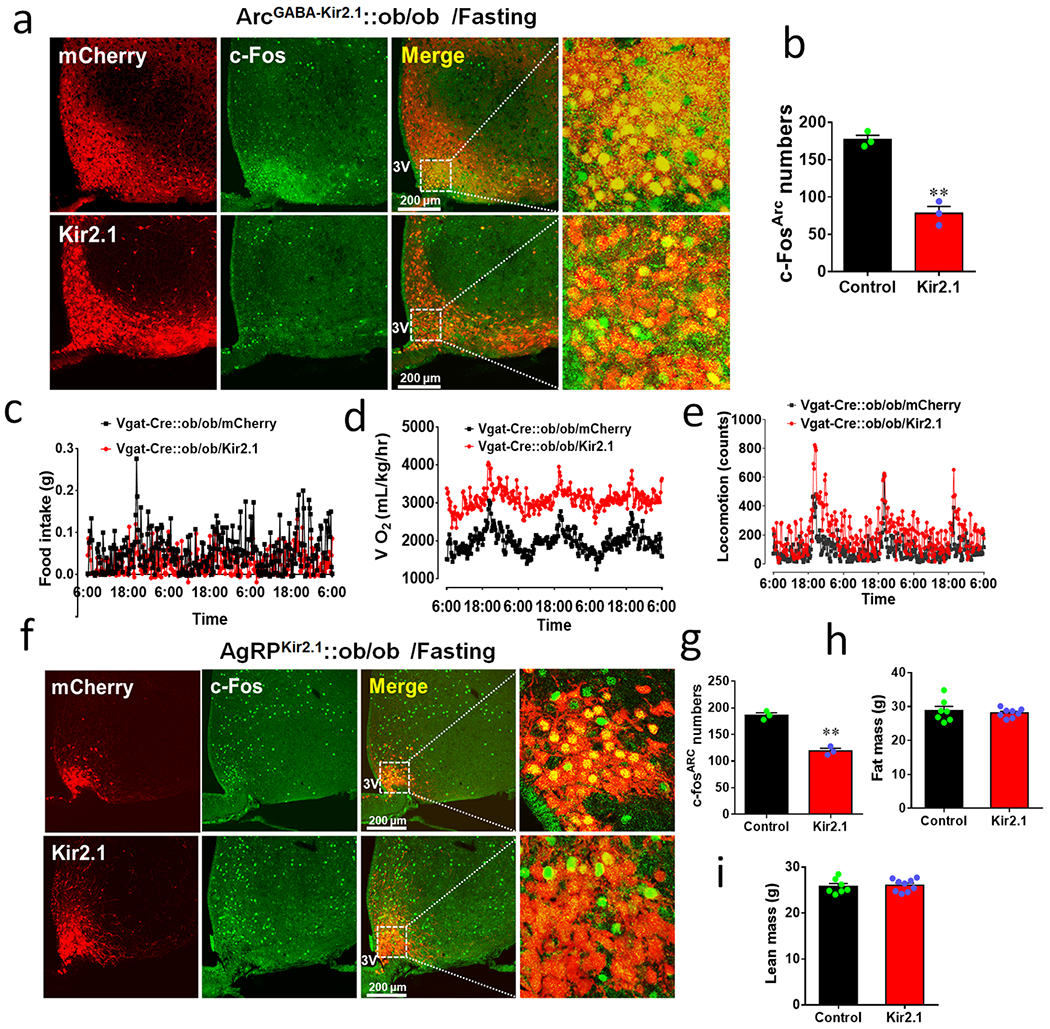
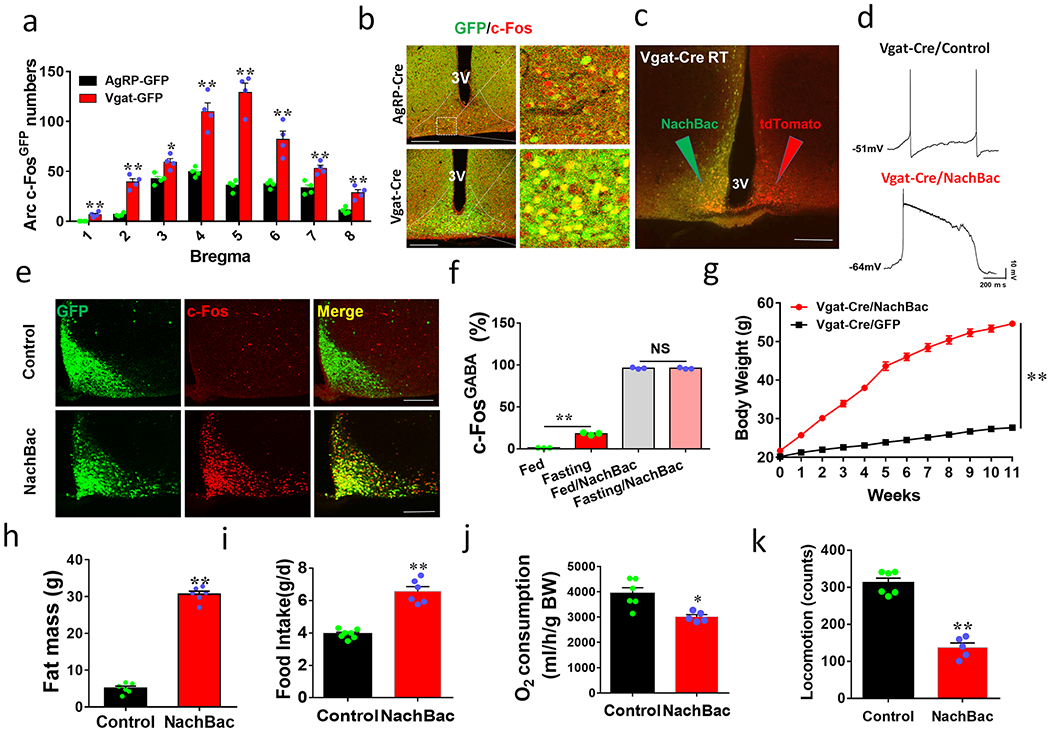
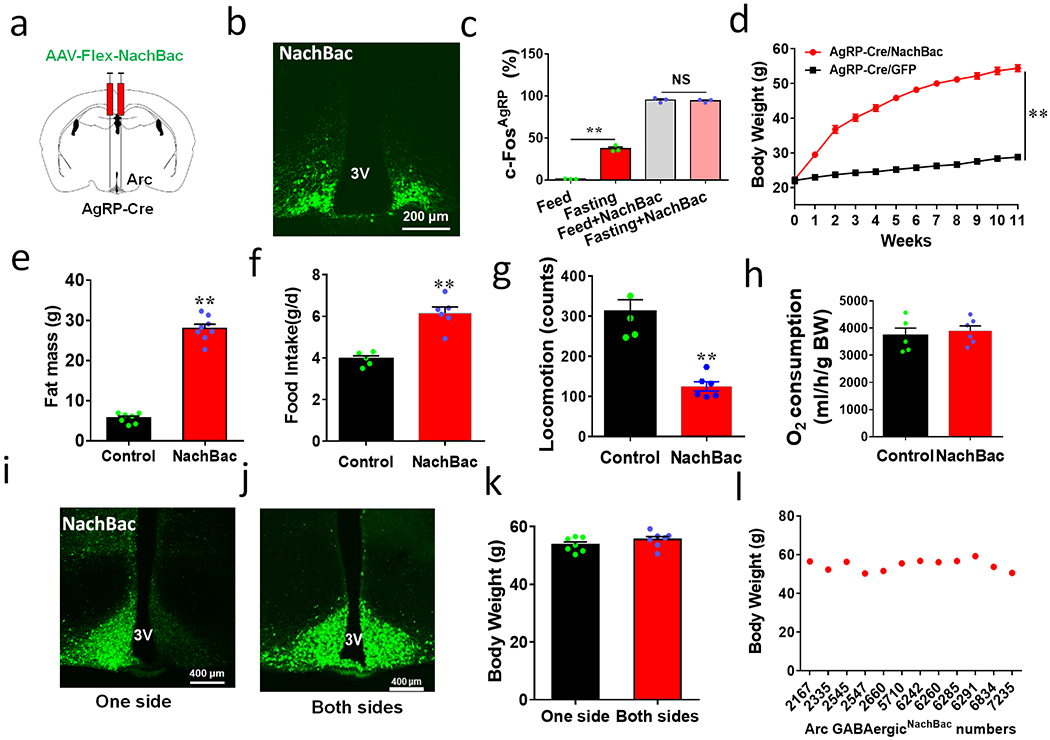
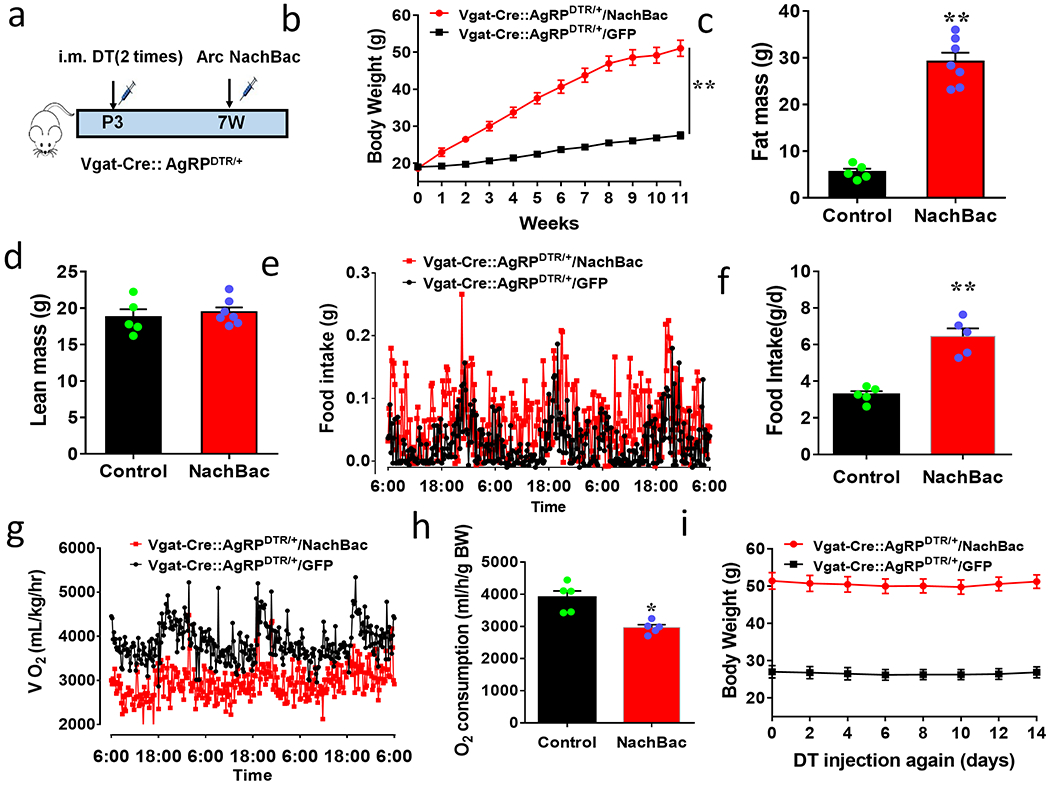
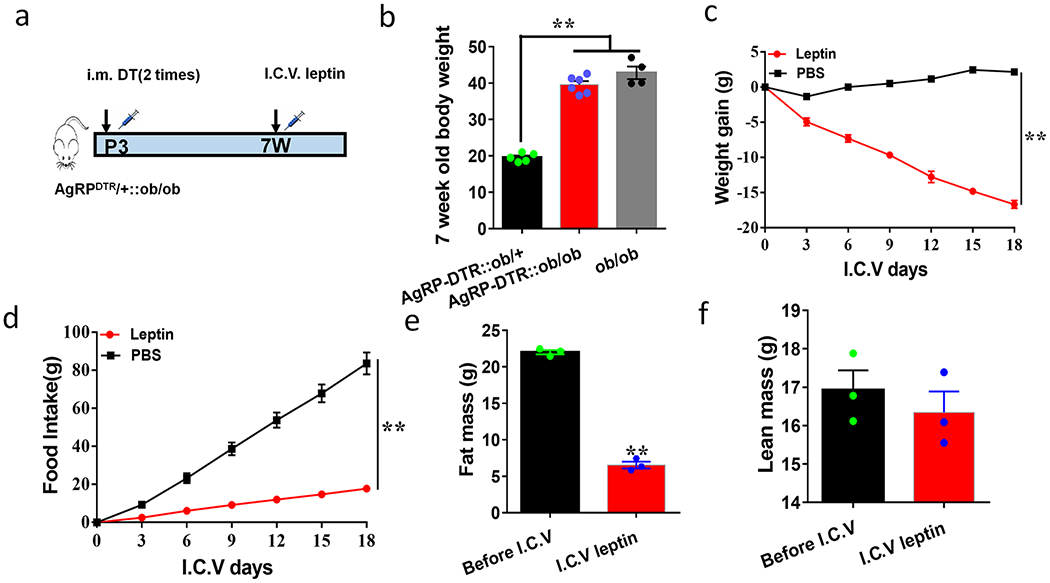
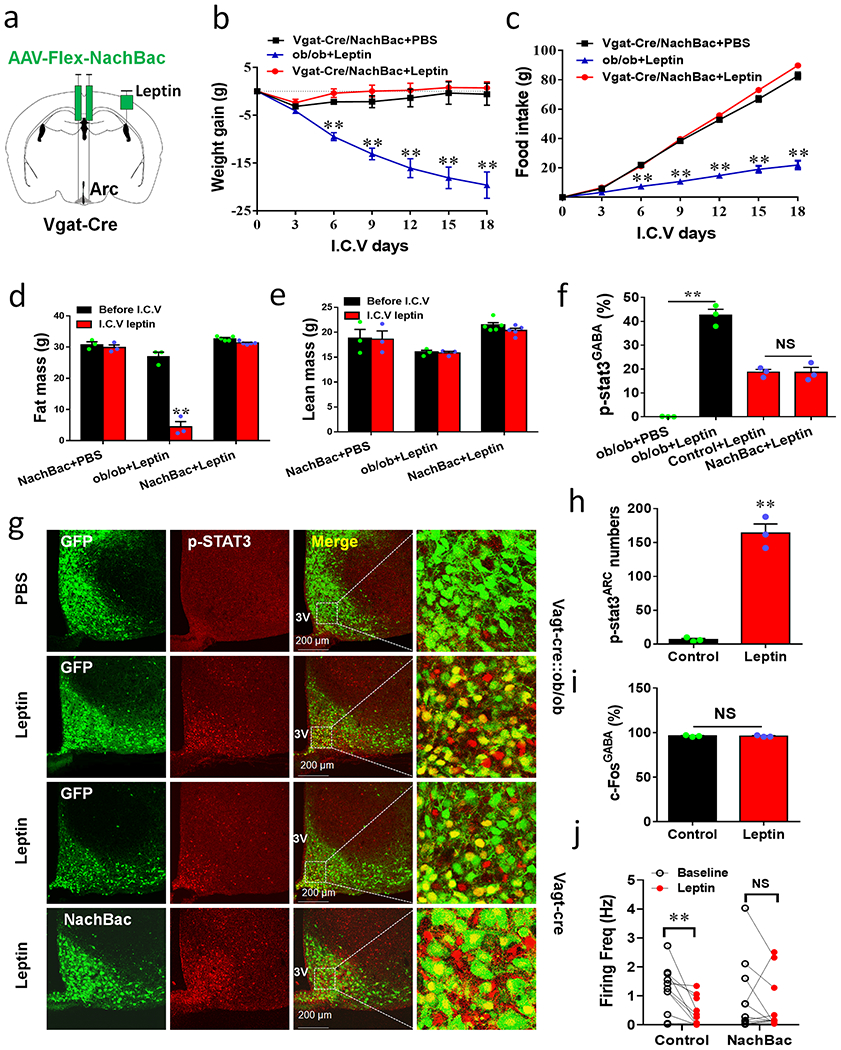
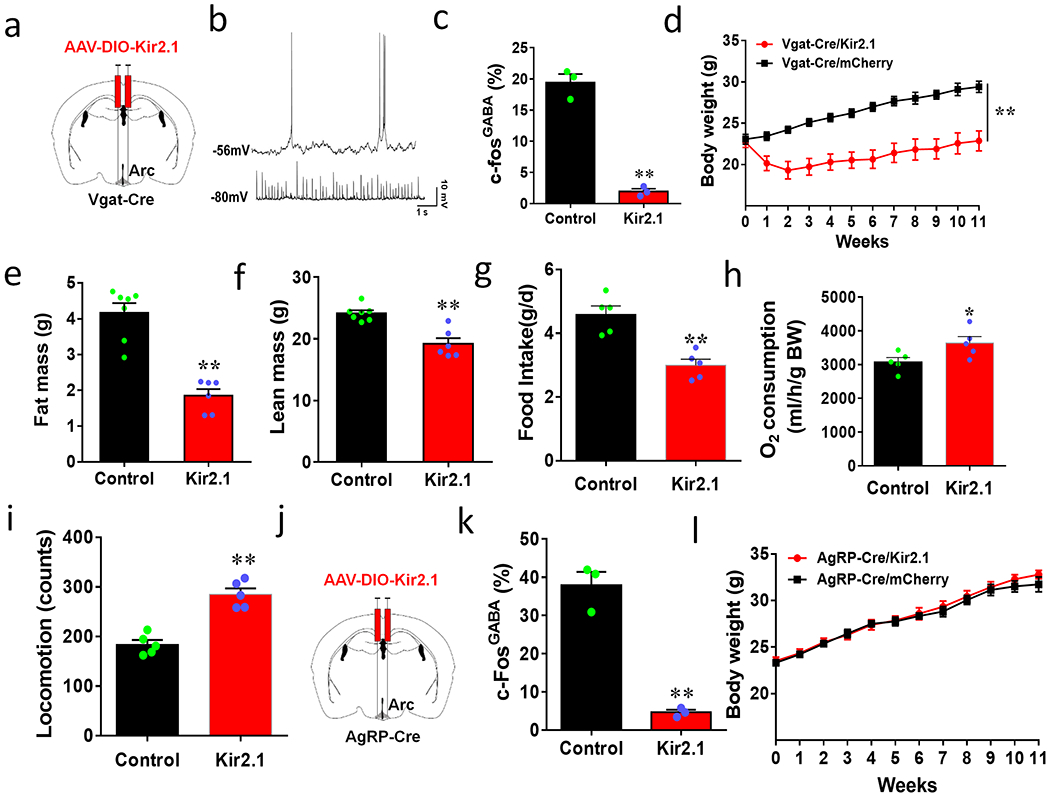
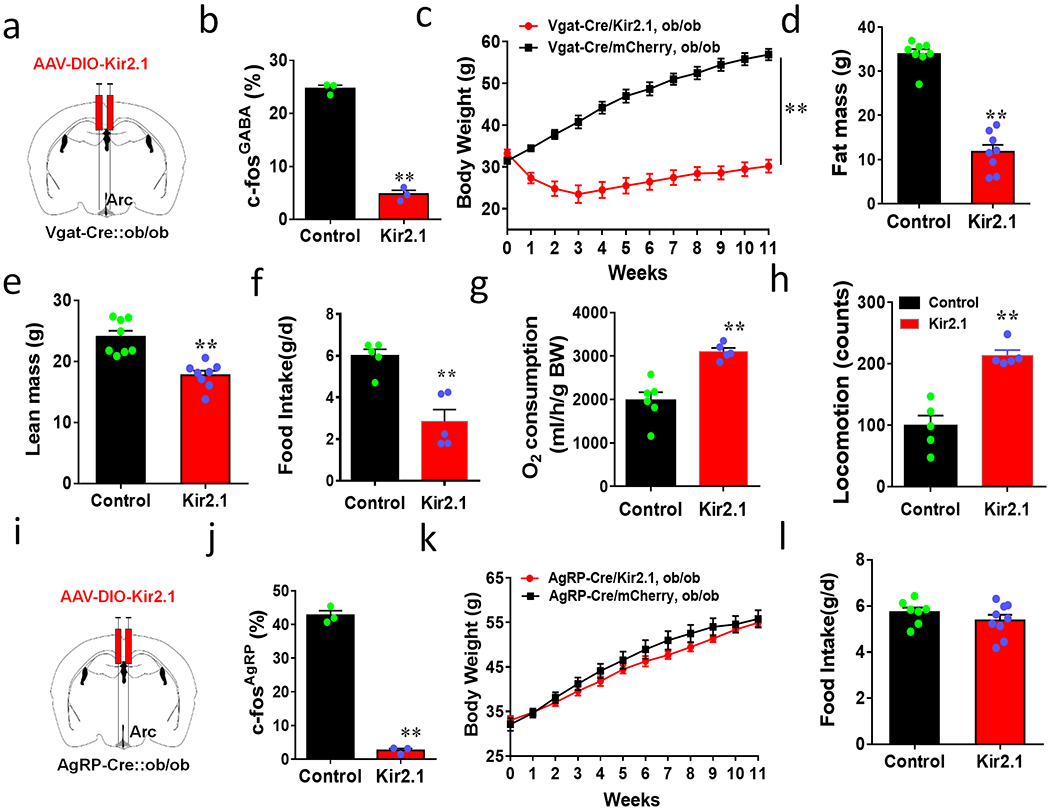
The current obesity epidemic faces a lack of mechanistic insights. It is known that the acute activity changes of a growing number of brain neurons rapidly alter feeding behaviour; however, how these changes translate to obesity development and the fundamental mechanism underlying brain neurons in controlling body weight remain elusive. Here, we show that chronic activation of hypothalamic arcuate GABAergic (GABA+), agouti-related protein (AgRP) neurons or arcuate non-AgRP GABA+ neurons leads to obesity, which is similar to the obese phenotype observed in ob/ob mice. Conversely, chronic inhibition of arcuate GABA+, but not AgRP, neurons reduces ageing-related weight gain and corrects ob/ob obesity. These results demonstrate that the modulation of Arc GABA+ neuron activity is a fundamental mechanism of body-weight regulation, and that arcuate GABA+ neurons are the major mediator of leptin action, with a profound and redundant role in obesity development.


Conflict of interest statement

Competing interests:

All authors declare no competing interests.

Figures

Extended Data Fig. 1
Extended Data Fig. 1. Fasting-induced response of c-Fos expression between ArcAgRP and ArcGABA+ neurons and NaChBac expression increases neuron activity.
a, Matched sections from Arc in serial rostral to caudal Bregma levels (mm) showing c-Fos (red) and GFP reporter for AgRP neurons (left panels) or ArcGABA+ neurons (right panels). The pictures shown in the middle are magnified pictures of the boxed area at each indicated Bregma level. 3V: the third ventricle. This experiment was repeated in 4 animals/group as indicated in Fig. 1a. b-k, Brain slices from Vgat-Cre::Ai9 reporter mice with stereotaxic injections of Cre-dependent GFP or NachBac vectors to the Arc were used for recording. b-c, Representative traces showing action potential firing by current injections in a step wise increment of 5pA with voltage clamped at −70 mV in control (b) and NachBac expressing neurons (c). d-e, Comparison in Rheobase (minimum current size required to be injected to elicit AP firing) (d, t=2.523, df=31, *p=0.0170) and comparison in minimum membrane potential required to elicit AP firing (e, t=2.436, df=25, *p=0.0223). f-g, Representative traces showing Na+ current traces with step wise voltage depolarization at the +10mV increment from −70mV in control (f) and NachBac expressing neurons (g). h-k, Comparison in Na+ currents at the indicated voltages (h, −60 mV: t=3.507, df=30, **p=0.0015; −50mV: t=8.754, df=30, **p<0.0001; −40 mV: t=5.459, df=30, **p<0.0001), in input resistance of the recorded neurons between groups (i, t=5.200, df=32, **p<0.0001), in number of recorded neurons showing spontaneous firing between groups (j) and in resting membrane potential (REM) between the two groups (k, t=2.441, df=32, *p=0.0204). For b-k, n=15 (control) or n=19 (NachBac), all with 2-sided paired Student’s t tests. 3V: the third ventricle. All data presented as mean+/−sem.
Extended Data Fig. 2
Extended Data Fig. 2. NachBac expression in ArcGABA+ neurons increases neuron activity levels and promotes massive obesity.
a, A represent expression of pattern of NachBac vector in the Arc from rostral to caudal sections. b, Expression GFP (green column) and c-Fos (red column) and their colocalization (merged column) with magnified pictures showing the boxed area in the merged pictures from Vgat-Cre mice injected with Cre-dependent GFP (top two rows) or NachBac (bottom two rows) when fed ad libitum chow (the first and third rows) or fasted (the second and forth row). It is notable that the vast majority of NachBac-expressing neurons exhibited c-Fos regardless of fed or fasted. This is one of 3 animals/group shown in Fig. 1f. c-g, Associated data from animals presented in Figs. 1g–1k, n=6 animals/group. Comparison in lean mass between control and mice with NachBac expression in ArcGABA-NachBac mice 11 weeks after viral delivery (n=6 each/group, t=1.055, df=10, p=0.3163, 2-sided unpaired Student’s t test). d, Comparison in body weight when mice were placed CLAMS chambers for measurements during the 1st week after viral delivery (n=6/group, t=0.7030 df=10, p=0.4981, 2-sided unpaired Student’s t test). (e-g) Real time measurements of food intake (e), O2 consumption (f) and locomotion (g) over the 3 day measurement period. h, Comparison in leptin levels between groups 11 weeks after viral delivery (n=6/group, t=14.88 df=10, **p<0.0001, 2-sided unpaired Student’s t test). i-m, Female Vgat-Cre were injected with AAV-Flex-EGFP-P2A-mNachBac or control GFP vectors to bilateral Arc at 7-8 weeks of age. Body weight (i, n=6 each/group, df=11, F(11, 84)=41.03, **p<0.0001, two-way ANOVA tests) and body weight gain (j, n=6 each/group, df=11, F(11, 84)=38.60, **p<0.0001, two-way ANOVA tests) were followed weekly for 11 weeks. k-m, Comparison in food intake measured at the first 2 weeks after viral delivery (k, t=6.700 df=7, **p=0.0003, 2-sided unpaired Student’s t test), lean mass (l, t=0.9398 df=7, p=0.3786, 2-sided unpaired Student’s t test) and fat mass (m, t=19.46 df=7, **p<0.0001, 2-sided unpaired Student’s t tests) measured at the end of the 11th week after viral delivery. 3V: the third ventricle. All data presented as mean+/−sem.
Extended Data Fig. 3
Extended Data Fig. 3. NachBac expression in ArcAgRP neurons increases neuron activity levels and promotes massive obesity
a, Expression GFP (green column) and c-Fos (red column) and their colocalization (merged column) with magnified pictures showing the boxed area in the merged pictures from AgRP-Cre mice injected with Cre-dependent GFP (top two rows) or NachBac (bottom two rows) when treated fed ad libitum chow (the first and third rows) or fasted (the second and forth row). It is notable that the vast majority of NachBac-expressing neurons exhibited c-Fos regardless of fed or fasted, n=3 as presented in Fig. 2c. b, Comparison in lean mass between control and mice with NachBac expression in AgRPNaChBac mice 11 weeks after viral delivery (n=7 for control and 8 for NachBac, t=0.1576, df=13, p=0.8772, 2-sided unpaired Student’s t test). c, Comparison in body weight when mice were placed in CLAMS chambers for O2 consumption measurements during the 1st week after viral delivery (n=7 for control and 8 for NachBac, t=0.5734, df=9, p=0.5804, 2-sided unpaired Student’s t test). d-f, Real time measurements of food intake (d), locomotion (e) and O2 consumption (f) over 3 days. 3V: the third ventricle. Data presented as mean+/−sem.
Extended Data Fig. 4
Extended Data Fig. 4. AgRP neuron ablation causes no difference in obesity development by NachBac
a, Representative pictures showing immunostraining for AgRP in PVH (top panels) and Arc (bottom panels) in adult AgRPDTR/+ mice treated with either saline (left panels) or DTX (right panels) at day 3, repeated in 3 mice. b, NPY-GFP transgene was bred into AgRPDTR/+ mice, and DTX treatment led to almost complete ablation of NPY neurons in the Arc (arrows), repeated in one additional mouse. c-d, Expression of NachBac in the Arc of Vgat-Cre mice with AgRP neuron lesion caused reduced locomotion shown in representative traces (c) and comparison in locomotion between groups (d, n=5 each/groups, t=9.366, df=8, **p<0.0001, 2-sided Student’s t test). e, i.c.v. leptin infusion was confirmed by induction of p-STAT3 shown by immunostaining (bottom panels), compared to control PBS infusion (top panels), repeated in 3 mice. 3V: the third ventricle. Scale bar in b: 400 μM and arrows in panel b pointing to residual NPY neurons. Data presented as mean+/−sem.
Extended Data Fig. 5
Extended Data Fig. 5. Activation by NachBac overrides leptin-mediated inhibitory action
a-b, Vgat-Cre mice (9-10 weeks of age) with prior injections of AAV-Flex-GFP-p2A-mNachBac to the Arc received i.p. injections of saline (top panels) or leptin (bottom rows), and then immunostained for p-STAT3 (a) and quantification for p-STAT3 expression in ArcGABA+ neurons (b, n=3, t=14.82, df=4, **p=0.0001, 2-sided unpaired Student’s t test). c-d, Colocalizatoin of NaChBac expression in the Arc with c-Fos in mice treated with saline (top panels) or leptin (bottom panels) (c) and comparison in the colocalization between groups (d, n=3, t=0.09029, df=4, p=0.7934, 2-sided unpaired t test). e-g, Vgat-Cre::ob/ob mice (9-10 weeks of age) with injections of AAV-Flex-GFP-p2A-mNachBac or control GFP virus to the Arc and then received munipump infusion of leptin (50ng/hr). e, Diagram showing experimental design. b-d, Daily weight (f, n=3 each/group, df=6, F96,28)=4.269, **p=0.0036, two-way ANOVA tests), percentage of body weight change (g, n=3 each/group, df=6, F(6, 28)=38.67, **p<0.0001, two-way ANOVA tests) and feeding (h, n=3 each/group, F(6, 28)=12.24, **p<0.0001, two-way ANOVA tests) measured during the 18 day period on leptin minipump. i-j, Body composition changes before and after leptin infusion in fat mass (i, GFP: t=11.64 df=4, p=0.0122; NachBac: t=0.2211 df=4, p=0.3569, both 2-sided unpaired Student’s t tests) and lean mass (j, GFP: t=3.198, df=4, p=0.1309; and NachBac: t=0.2411, df=4, p=0.5970, both 2-sided unpaired Student’s t tests). k, Induction of p-STAT3 in the Arc of both groups, repeated in 2 other animals. l-m, Electrophysiological recording of neurons with control GFP (l, n=11 each/group,) or NachBac (g, n=11 each/group) expression treated with leptin (100nM) as presented in Fig. 5j. 3V: the third ventricle. Data presented as mean+/−sem.
Extended Data Fig. 6
Extended Data Fig. 6. Kir2.1 expression causes neuron inhibition
a-g, Brain slices from Vgat-Cre mice (9-10 weeks of age) with prior injections of AAV-DIO-Kir2.1-p2A-dTomato or control vectors to the Arc were used for electrophysiological recording. Recorded neurons from both groups were analyzed for comparison in resting membrane potential (REM, a, n= 21 (control) or 16 (Kir2.1), t=5.978, df=35, **p<0.0001, 2-sided unpaired Student’s t test), in percentage of neuron with spontaneous AP firing (b) and in input resistance (c, n= 21 (control) or 16 (Kir2.1), t=6.892, df=31, **p<0.0001). d-e, Representative traces showing action potential firing with step wise current injections at the 5pA increment in control (d) and Kir2.1 (e) mice. f-g, Comparison in Rheobase (minimal currents required for AP firing) (f, n= 21 (control) or 16 (Kir2.1), t=4.660 df=31, **p<0.0001, 2-sided unpaired Student’s t test) and AP firing threshold (g, n= 21 (control) or 16 (Kir2.1), t=7.071 df=4, *p=0.0265, 2-sided unpaired Student’s t test) between the 2 groups. All data presented as mean+/−sem.
Extended Data Fig. 7
Extended Data Fig. 7. Kir2.1 expression reduces neuron activity and related effects on energy balance.
a, Vgat-Cre mice received either control vector (top panels) or AAV-DIO-Kir2.1-p2A-dTomato (bottom panels) to the Arc, and immunostraining was performed 4 weeks after viral delivery for c-Fos (green column) in response to overnight fasting (magnified pictures showing details of the boxed areas in the merged pictures as indicated), n=3 as presented in panel b. b, Comparison in the number of Arc neurons with c-Fos expression between groups (n=3 each/group, t=3.648 df=4, **p=0.0021, 2-sided unpaired Student’s t test). c-e, CLAMS measurements of feeding (c), O2 consumption (d) and locomotion (e) in mice with control or Kir2.1 vector delivery to bilateral Arc of Vgat-Cre mice. The CLAMS measurement was performed during the first week after viral delivery when body weight difference is minimal, n=5 each/group as presented in Fig. 6g–6i. f, AgRP-Cre mice received either control vector (top panels) or kir2.1 vectors (bottom panels) to the Arc, and immunostraining was performed 4 weeks after viral delivery for c-Fos (green column) in response to overnight fasting (magnified pictures on the right showing details of the boxed areas in the merged pictures as indicated), n=3 as presented in panel g. g, Comparison in c-Fos neurons in response to fasting in the Arc between groups (n=3 each/group, t=3.648, df=4, **p=0.0218, 2-sided Student’s t test). h-j, Comparison in food intake (h, n=5 (control) or 7 (Kir2.1), t=0.6790, df=10, p=0.5125, 2-sided unpaired Student’s t test), fat mass (i, n=5 (control) or 7 (Kir2.1), t=1.507, df=10, p=0.1628, 2-sided unpaired Student’s t test) and lean mass (j, n=5 (control) or 7 (Kir2.1), t=0.9326, df=10, p=0.3730, 2-sided unpaired Student’s t test) during the 3rd week after viral delivery. 3V: the third ventricle. Data presented as mean+/−sem.
Extended Data Fig. 8
Extended Data Fig. 8. TeLC expression in AgRP neurons causes no obvious effects on body weight
a, Represent pictures showing expression of AAV-DIO-TeLC-GFP injected to the Arc and tdTomato expression in AgRP-Cre:Ai9 reporter mice in a rostral to caudal series of sections. b, Body weight of a group of mice (males) injected at 6-7 weeks of age and their controls with AAV-DIO-GFP injections (n=6 for control and =7 for TeLC, F(11, 84)=0.04721, p>0.9999, two-way ANOVA tests). Data presented as mean+/−sem.
Extended Data Fig. 9
Extended Data Fig. 9. Kir2.1 expression in Arc GABA+ neurons reduces neuron activity and normalizes body weight of ob/ob mice
a, Vgat-Cre::ob/ob mice received either control vector (top panels) or AAV-DIO-Kir2.1-p2A-dTomato (bottom panels) to the Arc, and immunostraining was performed 4 weeks after viral delivery for c-Fos (green column) in response to overnight fasting (the magnified pictures on the right showing details of the boxed areas in the merged pictures as indicated). b, Comparison in the number of Arc neurons with c-Fos expression between groups (n=3 each/group, t=8.990, df=4, **p=0.0008, 2-sided unpaired Student’s t test). c-e, CLAMS measurements of feeding (c), O2 consumption (d) and locomotion (e) in mice with control or Kir2.1 vector delivery to bilateral Arc of Vgat-Cre::ob/ob mice. The CLAMS measurement was performed during the first week after viral delivery when body weight difference between groups was minimal, n=5 each/group as presented in Fig. 7c–7h. f, AgRP-Cre::ob/ob mice received either control vector (top panels) or kir2.1 vectors (bottom panels) to the Arc, and immunostraining was performed 4 weeks after viral delivery for c-Fos (green column) in response to overnight fasting (the magnified pictures on the right showing details of the boxed areas in the merged pictures as indicated), n=3 as presented in Fig. 7j and panel g. g-i, Comparison in the number of Arc neurons expressing c-Fos between the groups (g, n=3 each/group, t=10.15, df=4, **p=0.0005, 2-sided unpaired Student’s t test), fat mass (h, n=7 (control) or 8 (Kir2.1), t=0.5465, df=13, p=0.5940, 2-sided unpaired Student’s t test) and lean mass (i, n=7 (control) or 8 (Kir2.1), t=0.3036, df=14, p(two-tailed)=0.7659, 2-sided unpaired Student’s t test) at the 11th week after viral delivery. 3V: the third ventricle. Data presented as mean+/−sem.
Extended Data Fig. 10
Extended Data Fig. 10. Expression pattern of Kir2.1 in Arc neurons and the related effects
a, Representative pictures showing expression patterns of Kir2.1-expressing vectors in AgRP neurons as observed in dTomato expression from serial rostral to caudal Arc sections. In order to confirm that all AgRP neurons express the Kir2.1 vector, AgRP-Cre mice were bred with GFP-reporter mice and almost all GFP-labelled neurons showed expression of Kir2.1 vector. b, Representative pictures showing expression patterns of Kir2.1-expressing vectors in Vgat neurons, as illustrated by dTomato expression from serial rostral to caudal Arc sections. c-f, Expression of Kir2.1-expressing vectors in one side of Arc and effects on fasting-induced c-Fos in the Arc of Vgat-Cre male mice (c) and the effect on body weight 11 weeks after viral expression (d, n=7 (control), 5 (one side) or 6 (both sides), F(2, 14)=17.77, p=0.0008: control vs two sides, and p=0.0014: one side vs two sides, one-way ANOVA tests). e-f, Expression of Kir2.1-expressing vectors in one side of Arc and effect of fasting-induced c-Fos in the Arc in Vgat-Cre::ob/ob male mice (e) and the effect on body weight 11 weeks after viral expression (f, n=8 for control, 7 for one side, or 8 for both sides, F(2, 19)=116, **p<0.0001: control vs two sides, and **p<0.0001: one side vs two sides, one-way ANOVA tests). g, GFAP expression in the Arc of AgRP-Cre mice injected with the Kir2.1 vectors (top panel) or with AgRP lesion (bottom panel), repeated in one additional mouse. 3V: the third ventricle. All data presented at mean+/− sem.
Figure 1.
Figure 1.. Chronic activation of Arc GABA+ neurons results in massive obesity.
a-b, Vgat-Cre and AgRP-Cre GFP reporter mice were used to assess c-Fos induction in response to fasting. a, Quantitative comparison of c-Fos expressing in GFP reporter neurons in brain sections at the indicated bregma levels, n=4 each, 2-sided unpaired Student’s t tests (Bregma −1.22mm, t=5, df=6, **p=0.0017; −1.46mm, t=9.27, df=6, p<0.0001; −1.7mm: t=3.85, df=6, **p=0.0084; −2.06mm, t=6.6, df=6, **p=0.0006; −2.3mm: t=5.3, df=6, **p=0.0018; −2.46mm: t=4.46, df=6, **p=0.0043; −2.7mm, t=4.96, df=6, **p=0.0026). b, Representative pictures showing GFP and c-Fos colocalization at the level of bregma −1.46mm of the two genotypes. c-f, NachBac expression resulted in neuron activation. c, A representative picture showing NachBac vector expression (GFP) injected to one side of the Arc of Vgat-Cre::Ai9 reporter mice (Green arrow pointing to the injected side with both GFP and RFP expression and red arrow pointing to the non-injected side with red expression alone). d, Representative traces showing typical AP firing in neurons recorded from control noninjected side (top) and NachBac-mediated AP in neurons recorded from the injected side (bottom). e, Representative pictures showing c-Fos immunostaining (red) in the Arc of ad libitum fed mice with control GFP injections (top panels) and NachBac injections (bottom panels). f, Comparison in percentage of c-Fos expression in Arc GABA+ neurons in response to fasting in both control and NachBac mice. N=3 each/group, 2-way ANOVA with Tukey’s multiple comparisons, F(1,8)=7566, **p<0.0001 (Fed vs Fasting) and p=0.7934 (Fed/NachBac vs Fasting/NachBac). g, Comparison in body weight between mice with injections of control GFP or NachBac vectors to bilateral Arc of Vgat-Cre mice during the first 11 weeks after injection. 2-way ANOVA tests. F(1, 204)=3030, **p<0.0001 (NachBac vs GFP). h-k, Comparison in fat mass between the 2 indicated mouse groups at 11th week after viral injection (h, t=25.19, df=10, **p<0.0001), comparison in O2 consumption (i, t=8.76, df=11, **p<0.0001), food intake (j, t=3.503, df=9, **p=0.0067) and locomotion (k, t=9.64, df=9, **p<0.0001) during the first week post viral injection when body weight difference was minimal, n=6 each/group, all with 2-sided unpaired Student’s t tests. 3V: the third ventricle. Scale bar= 400 μM. All datasets presented as mean +/− sem.
Figure 2.
Figure 2.. Chronic activation of AgRP neurons or random Arc GABA neurons results in massive obesity.
a, Diagram showing NachBac viral injections to bilateral Arc of AgRP-Cre mice. b, Representative expression pattern of AAV-Flex-NachBac in the Arc of AgRP-Cre mice. c, Comparison in percentage of c-Fos expression in Arc AgRP neurons in response to fasting in both control and NachBac mice; n=3 each, 2-way ANOVA withTurkey’s multiple comparisons, F(3,8)=770.2, **p<0.0001 (Fed vs Fasting) and p=0.6422 (Fed/NachBac vs Fasting/NachBac). d, Comparison in body weight between mice with injections of control GFP or NachBac vectors to bilateral Arc of AgRP-Cre mice during the first 11 weeks after injection. 2-way ANOVA tests. F(1, 204)=3301, **p<0.0001 (NachBac vs GFP). e-h, Comparison in fat mass between the 2 mouse groups at 11th week after viral injection (e, t=18, df=13, **p<0.0001), comparison in food intake (f, t=6.10, df=9, **p=0.0002), locomotion (g, t=6.14, df=9, **p<0.0001) and O2 consumption (h, t=0.518, df=9, **p=0.6169) during the first week post viral injection when body weight difference was minimal, n=6 each/group, all with 2-sided unpaired Students’ t tests. i-k, Representative pictures showing NachBac viral injections to one side (i), both sides (j) of Arc in Vgat-Cre mice, and comparison in body weight at the 11th week after NachBac viral injection (k, t=1.266, df=12, p=0.2296, n=7 (one side) or =8 (both sides), with 2-sided unpaired Student’s t test). l, Plot of body weight of individual animals at the 11th week after viral injection as a function of number of Arc GABA+ neurons with NachBac viral expression. 3V: the third ventricle. All data presented at mean +/− sem.
Figure 3.
Figure 3.. AgRP neurons are not required for obesity development by activation of Arc GABA+ neurons.
a, Diagram showing injections of NachBac vectors to bilateral Arc of Vgat-Cre:: AgRPDTR/+ mice with DTX (DT) treatment in neonates. b-h, Metabolic phenotypes of Vgat-Cre:: AgRPDTR/+ mice with AgRP lesion in neonates and NachBac injections to the Arc. Weekly body weight after viral injection (b, F(1, 156)=3301, **p<0.0001, NachBac vs GFP), fat (c, t=10.07, df=10, p<0.0001) and lean (d, t=0.5603, df=10, p=0.5876) mass at the 11th week after viral injection. (e-h) food intake pattern (e), comparsion in daily food intake (f, t=6.533, df=8, **p=0.0002), and comparison in O2 consumption pattern (g) and O2 consumption (h, t=4.289, df=8, p=0.0027) measured in CLAMS during the first week after viral injection with minimla body weight difference between groups, n=5 (control) or 7 (NachBac), with 2-sided unpaired student’s t tests in c, d, f and h, or 2-way ANOVA in b. i, Daily body weight of AgRPDTR/+ controls and obese Vgat-Cre:: AgRPDTR/+ mice presented in panels b-h after receiving another dose of DT treatment at the 11th week following NachBac or GFP viral delivery. All datasets presented as mean+/− sem.
Figure 4.
Figure 4.. AgRP neurons are not required ob/ob obesity or leptin action on reducing body weight.
a-f, Leptin treatment on body weight in ob/ob mice with neonatal AgRP neuron lesion. a, Diagram showing DTX (DT) and leptin treatments in AgRPDTR/+::ob/ob mice. b, Comparison in body weight of the indicated genotypes at the age of 7 weeks, 1-way ANOVA, F(2, 12)=131.9, **p<0.0001 (AgRP-DTR::ob/+vsAgRP-DTR::ob/ob); **p<0.0001 (AgRP-DTR::ob/+vs ob/ob); p=0.1112 (AgRP-DTR::ob/ob vs ob/ob), n=5 (AgRP-DTR::ob/+), 6 (AgRP-DTR::ob/ob); or 4 (ob/ob). c-d, Changes in daily body weight (c) and food intake (d) in AgRPDTR/+::ob/ob mice receiving either icv leptin (n=3) or control PBS (n=3), 2-way ANOVA tests: for body weight F(1, 21)=1510, **p<0.0001 (Leptin vs PBS); and for food intake F(1, 21)=880.3, **p<0.0001 (leptin vs PBS). e-f, Changes in fat mass (e, t=27.66 df=4, **p<0.0001, n=3 each) and lean mass (f, t=0.7783, df=4, p=0.4798, n=3 each) of AgRPDTR/+::ob/ob mice at the end of the 18th day of icv infusion, all with 2-sided unpaired Student’s t tests. All datasets presented as mean+/− sem.
Figure 5.
Figure 5.. Arc GABA+ neuron activation driven by NachBac overrides leptin action.
a, Diagram showing i.c.v. treatment of leptin or saline with 3-week duration minipumps in Vgat-Cre or Vgat-Cre::ob/ob mice that were injected with NachBac vectors to bilateral Arc. b-e, Body weight (b) and food intake (c) were measured once every 3 days with leptin or saline treatment in the indicated groups of mice and body composition was examined at the 18th day on leptin treatment for fat (d) and lean (e) mass, n=3 (NachBac+PBS), 3 (ob/ob+leptin) or 5 (NachBac+leptin), 2-way ANOVA in b (F(6, 35)=10.86, **p<0.0001, NachBac+PBS vs ob/ob+leptin; F(6, 42)=0.1529, p<0.9874, NachBac+PBS vs ob/ob+leptin; F(6, 49)=17.57, **p<0.0001, ob/ob+leptin vs NachBac+leptin) and in c (F(6, 35)=112.1, **p<0.0001, NachBac+PBS vs ob/ob+leptin; F(6,42)=6.368, p=0.081, NachBac+PBS vs ob/ob+leptin; F(6, 69)=290.2, **p<0.0001, ob/ob+leptin vs NachBac + leptin); and 2-sided unpaired Student’s t tests in d (t=10.40, df=4 **p=0.0005 in the ob/ob+leptin group (before vs after leptin)) and e (t=1.491, df=8, p=0.1778 in the group of NachBac+leptin (before vs after leptin)). f, Comparison in percentage of p-STAT3 expression in Arc GABA+ neurons in control and NachBac mice with saline or leptin infusion, n=3 each/group, 1-way ANOVA (F(3,8)=99.83, **p<0.0001, ob/ob+PBS vs ob/ob+leptin; p=0.9732, Control+leptin vs NachBac+leptin). g, Representative pictures for data presented in panel f showing GFP and p-STAT3 in Vgat-Cre::ob/ob mice with saline or leptin infusion (top 2 rows), and showing NachBac and p-STAT3 in NachBac injected Vgat-Cre mice with leptin infusion (bottom 2 rows). h-I, In a new cohort of Vgat-Cre male mice with NachBac viral delivery to the Arc, i.p. leptin (or saline) was administered, and the expression of p-STAT3 (h, t=11.71, df=4, **p=0.0003) and c-Fos (i, t=0.2800, df=4, p=0.754) was examined in the Arc and compared between leptin and contral saline treatments, n=3 each/group,with 2-sided unpaired Student’s t tests. j, Comparison in leptin effects on firing frequency of control and NachBac-expressing AgRP neurons using patch clamp recording on brain slices, n=11 (control) or 12 (NachBac), with 2-sided paired Student’s t tests, t=3.630, df=10, **p=0.0046 in controls, and t=0.8136, df=10, p=0.4348 in the NachBac group. 3V: the third ventricle. All data presented as mean +/− sem.
Figure 6.
Figure 6.. Arc GABA+ but not AgRP neurons are necessary for ageing-related body weight gain.
a, Diagram showing injections of Kir2.1 vectors to bilateral Arc of 7-8 week old Vgat-Cre mice. b, Representative traces showing spontaneous activity of control (top) and Kir2.1-expressing Arc GABA+ neurons (bottom). c, Comparison in percentage of Arc GABA+ neurons that express c-Fos in response to overnight fasting between control and Kir2.1 mice, n=3/group with 2-sided unpaired Student’s t tests, t=12.17, df=4, **p=0.0003. d-i, Weekly body weight (d, two-way ANOVA tests, F(1, 120)=226.8, **p<0.0001 Kir2.1 vs mCherry, body composition in fat (e, t=6.816, df=11, **p<0.0001) and lean mass (f, t=5.015, df=11, **p=0.0004) measured at the 11th week after viral injection; food intake (g, t=4.923, df=8, **p=0.0012), O2 consumption (h, t=2.428, df=8, *p=0.0413) and locomotion (i, t=6.649, df=8, **p=0.0002) measured during the first week after viral injection when the body weight difference between groups was minimal, n=5/groups, all with 2-sided unpaired Student’s t tests in e-i. j-l, Body weight effects of Kir2.1 expression in AgRP neurons. (j) Diagram showing injections of Kir2.1 vectors to bilateral Arc of 7-8 week old AgRP-Cre mice. k, Comparison in percentage of AgRP neurons expressing c-Fos in response to fasting, n=3/group, 2-sided unpaired Student’s t tests (t=9.289, df=4, **p=0.0007). l, Comparison in weekly body weight between groups after viral injection, 2-way ANOVA, F(1, 120)=1.926, p=0.1645 Kir2.1 vs mCherry. All data presented at mean +/− sem.
Figure 7.
Figure 7.. Chronic inhibition of Arc GABA+ but not AgRP neurons are sufficient to normalize ob/ob obesity.
a-i, Effects on body weight by Kir2.1 expression in Arc GABA+ neurons in obese ob/ob mice. a, Diagram showing injections of Kir2.1 vectors to bilateral Arc of 7-8 week old Vgat-Cre::ob/ob mice. b, Comparison in percentage of Arc GABA+ neurons expressing c-Fos in response to overnight fasting between control and Kir2.1 mice, n=3/group, 2-sided unparired Student’s t tests (t=20.97, df=4, **p<0.0001). c-h, Weekly body weight (c, n=8/group, F(11, 168)=16.28, **p<0.0001, Kir2.1 vs mCherry), body composition for fat (d, n=8/group, t=11.65, df=14, p<0.0001) and lean mass (e, n=8/group, t=5.090, df=14, **p=0.0002) measured at the 11th week after viral injection; comparison in food intake (f, n=5/group, t=4.785, df=8, **p=0.0014), O2 consumption (g, n=5/group,t=4.999, df=9, **p=0.0007) and locomotion (h, n=5/group,t-5.949, df=8, **p=0.0003) measured during the first week after viral injection when the body weight difference between groups was minimal, 2-way ANOVA tests in c and 2-sided unpaired Student’s t tests in d-h. i-l, Body weight effects of Kir2.1 expression in AgRP neurons in obese ob/ob mice. i, Diagram showing injections of Kir2.1 vectors to bilateral Arc of 7-8 week old AgRP-Cre::ob/ob mice. j, Comparison in percentage of AgRP neurons expressing c-Fos in response to fasting, n=3/group, 2-sided unpaired Student’s t tests (t=26.02, df=4, **p<0.0001). k-l, Comparison in weekly body weight (k, n=7 for Kir2.1 and =9 for mCherry, F(11, 168)=0.4810, p=0.9131, Kir2.1 vs mCherry, 2-way ANOVA) and food intake (l, n=7 for Kir2.1 and =9 for mCherry, t=1.109, df=14, p=0.2862, 2-sided unpaired Student’s t tests) between groups after viral injection. All data presented as mean +/− sem.

References

    1. Krashes MJ et al. An excitatory paraventricular nucleus to AgRP neuron circuit that drives hunger. Nature 507, 238–242, doi:10.1038/nature12956 (2014). - DOI - PMC - PubMed
    1. Atasoy D, Betley JN, Su HH & Sternson SM Deconstruction of a neural circuit for hunger. Nature 488, 172–177, doi:10.1038/nature11270 (2012). - DOI - PMC - PubMed
    1. Krashes MJ et al. Rapid, reversible activation of AgRP neurons drives feeding behavior in mice. J Clin Invest 121, 1424–1428, doi:10.1172/JCI46229 (2011). - DOI - PMC - PubMed
    1. Aponte Y, Atasoy D & Sternson SM AGRP neurons are sufficient to orchestrate feeding behavior rapidly and without training. Nature neuroscience 14, 351–355, doi:10.1038/nn.2739 (2011). - DOI - PMC - PubMed
    1. Chen Y, Lin YC, Kuo TW & Knight ZA Sensory detection of food rapidly modulates arcuate feeding circuits. Cell 160, 829–841, doi:10.1016/j.cell.2015.01.033 (2015). - DOI - PMC - PubMed

Publication types