. 2020 Sep;2(9):893-901.
doi: 10.1038/s42255-020-0250-5. Epub 2020 Jul 27.

Dihydroxyacetone phosphate signals glucose availability to mTORC1

Affiliations

Dihydroxyacetone phosphate signals glucose availability to mTORC1

Jose M Orozco et al. Nat Metab. 2020 Sep.

Abstract

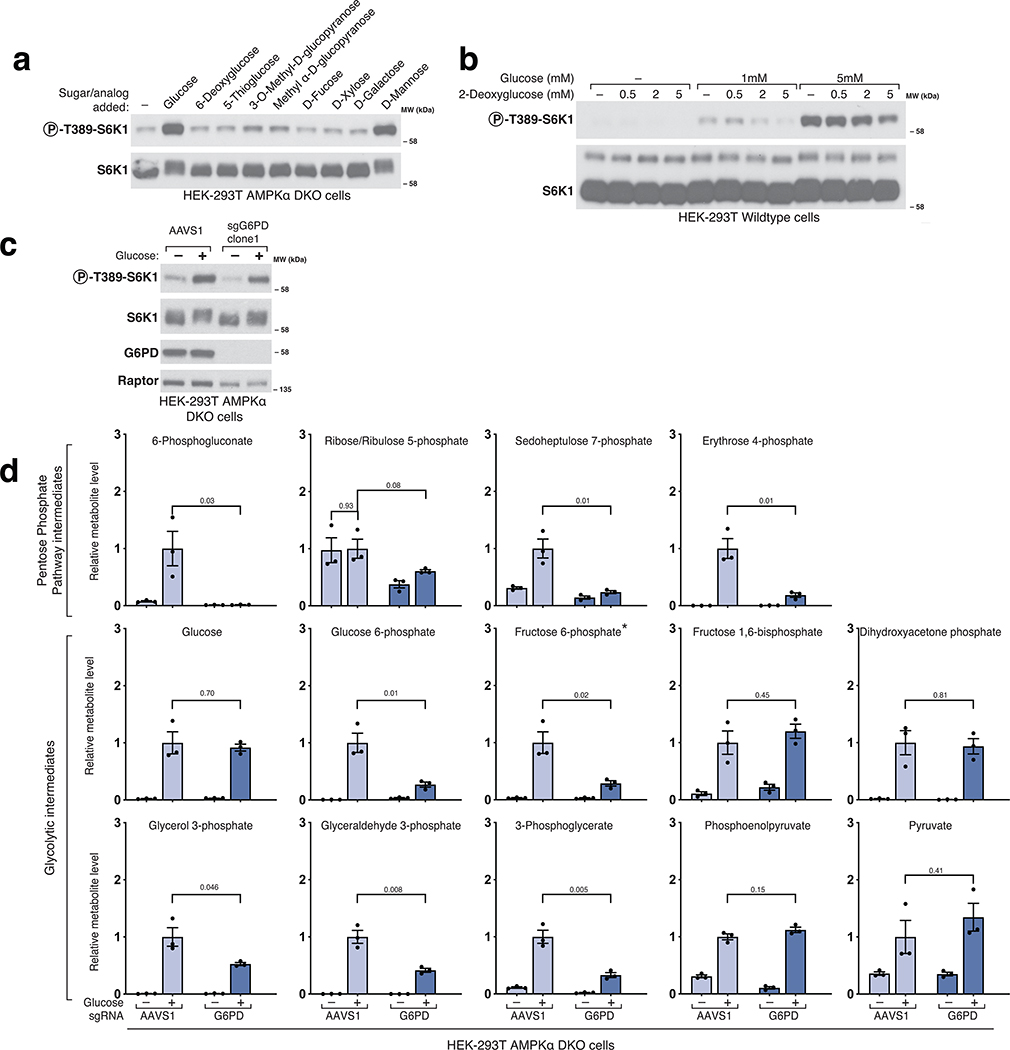
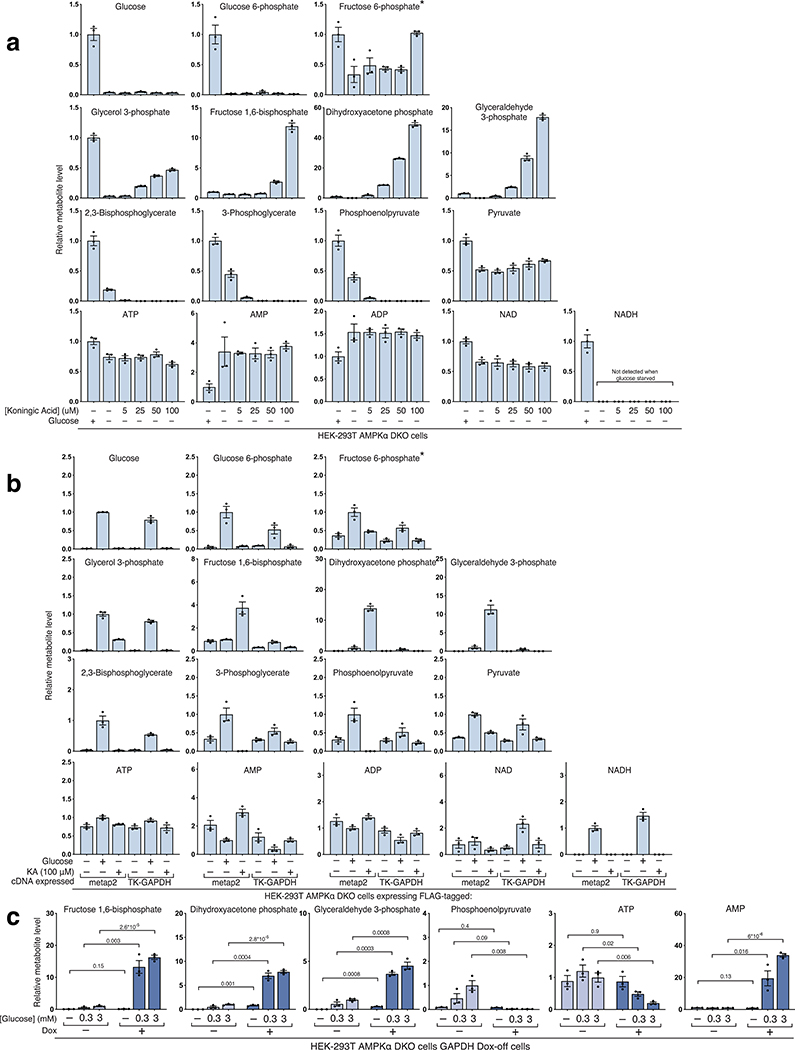
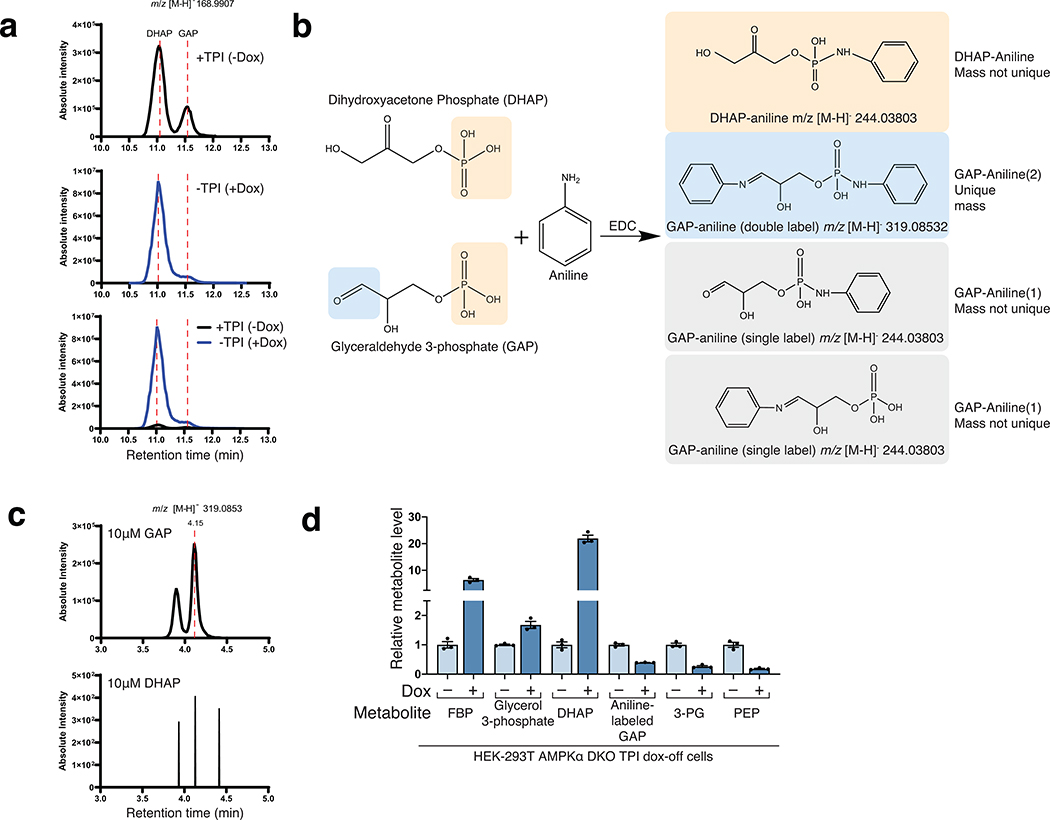
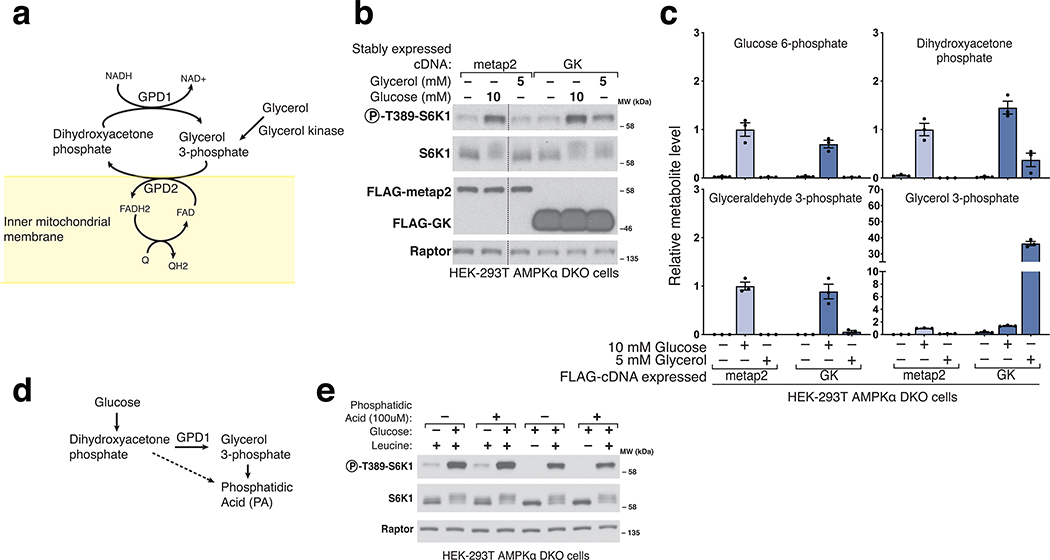
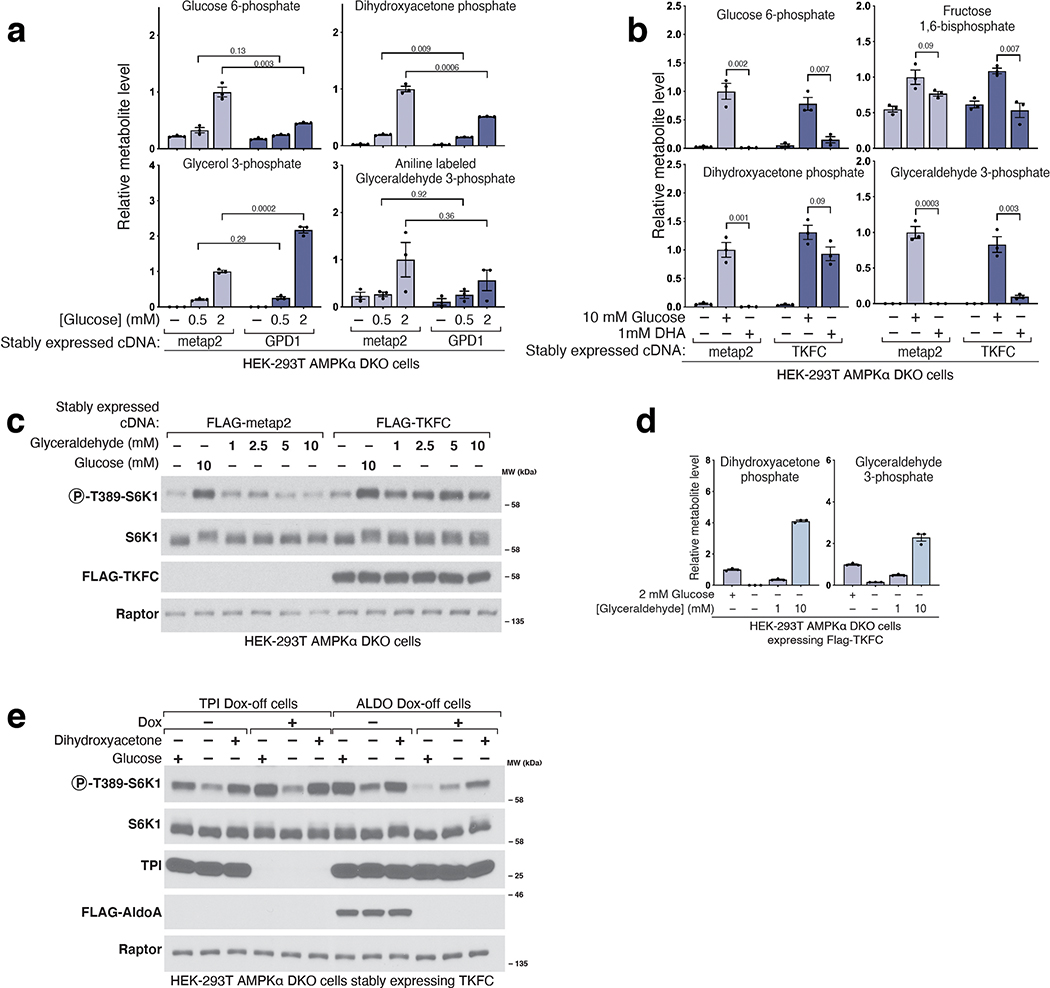
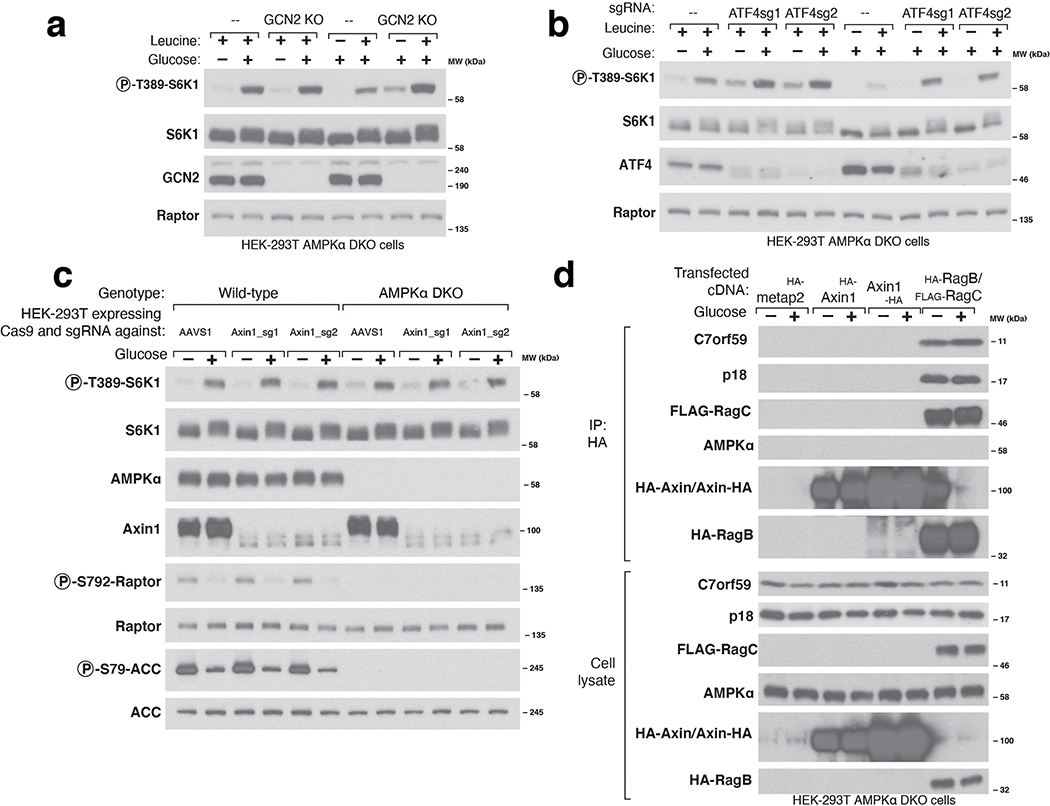
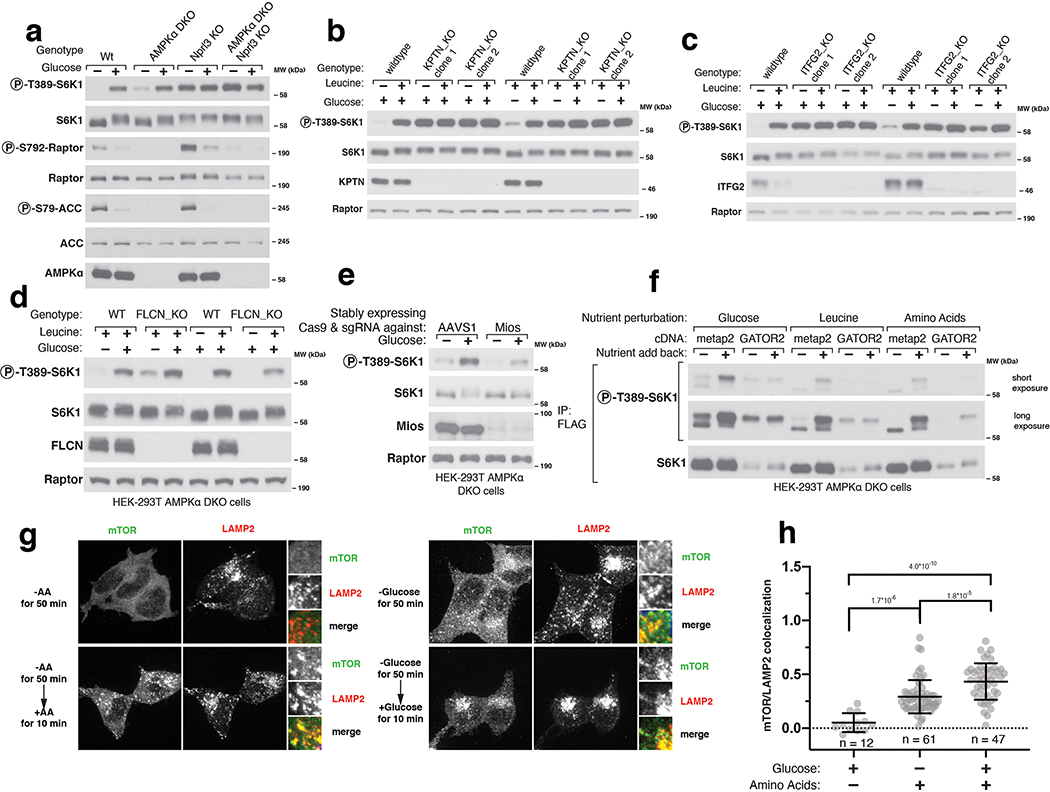
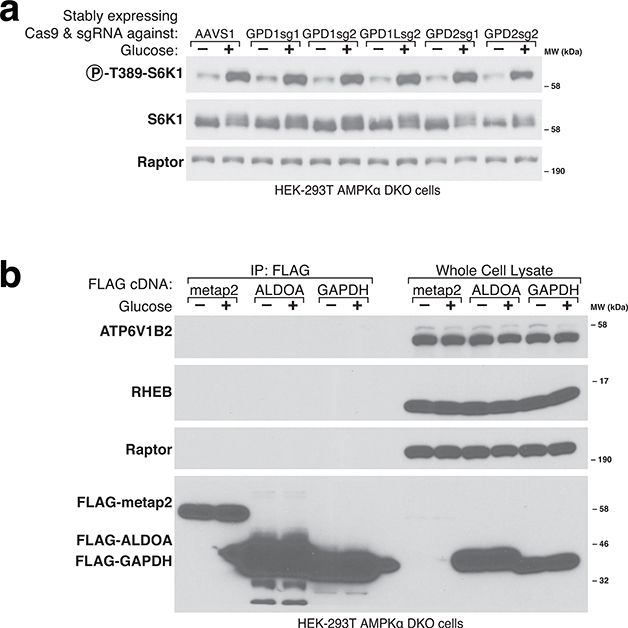
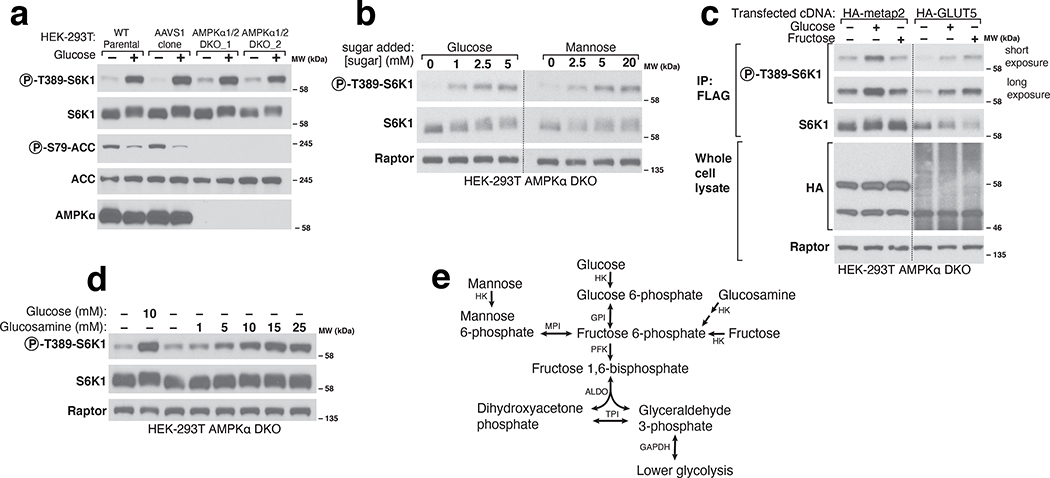
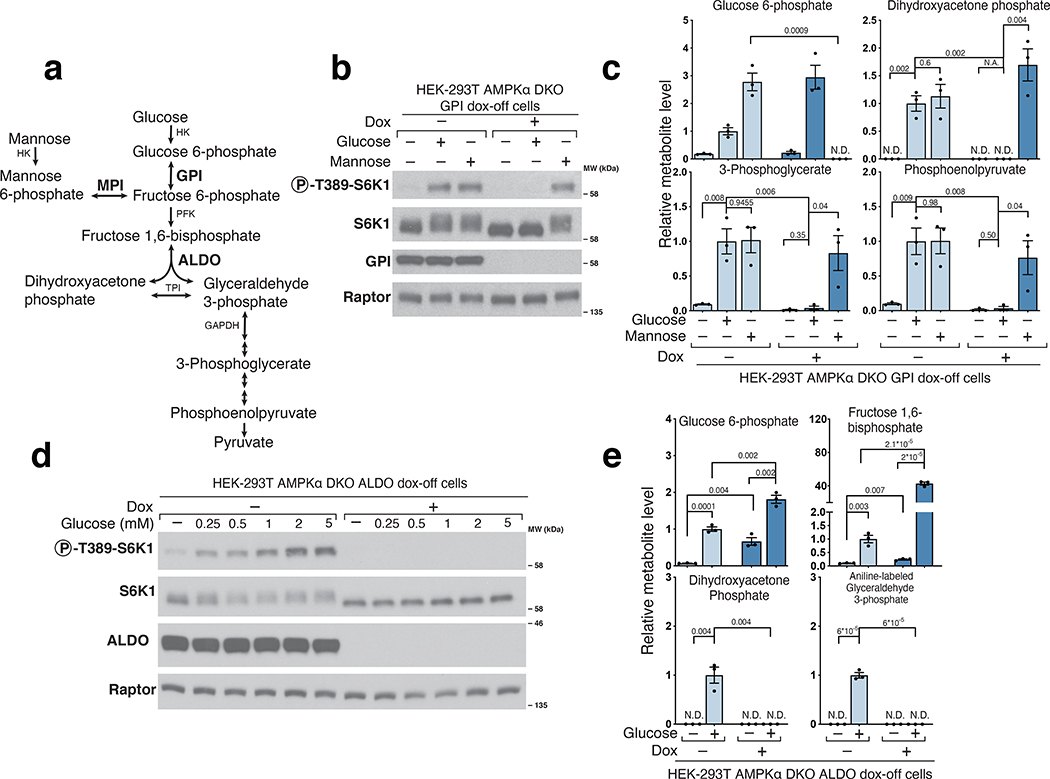
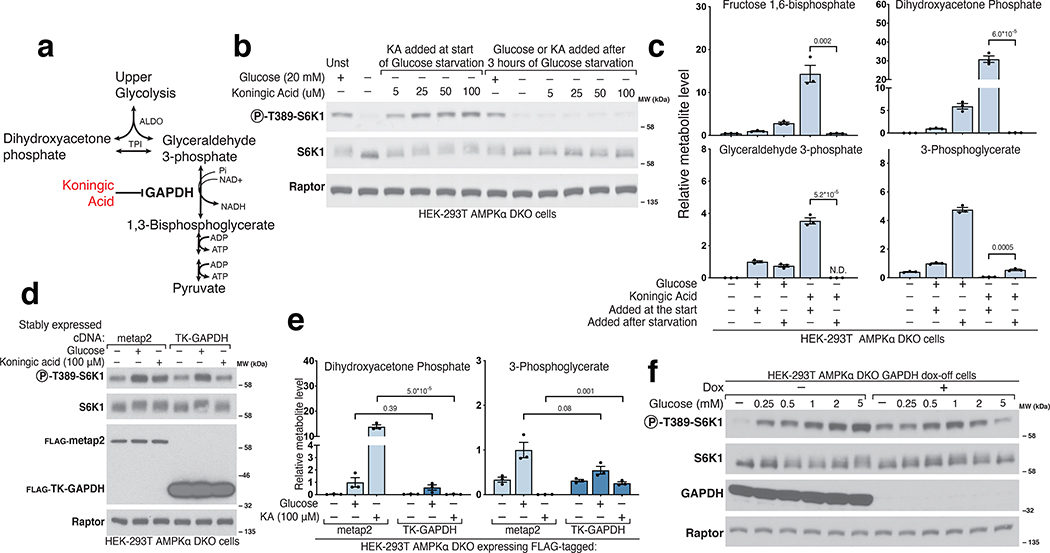
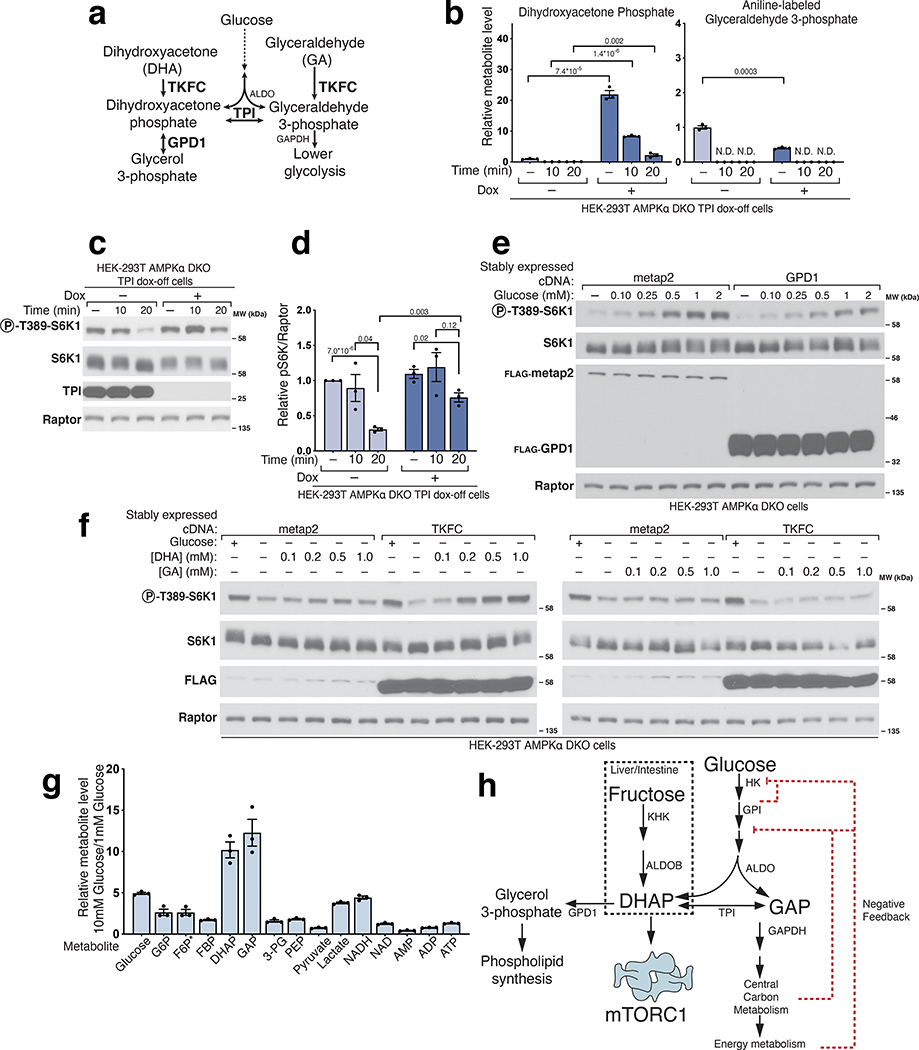
The mechanistic target of rapamycin complex 1 (mTORC1) kinase regulates cell growth by setting the balance between anabolic and catabolic processes. To be active, mTORC1 requires the environmental presence of amino acids and glucose. While a mechanistic understanding of amino acid sensing by mTORC1 is emerging, how glucose activates mTORC1 remains mysterious. Here, we used metabolically engineered human cells lacking the canonical energy sensor AMP-activated protein kinase to identify glucose-derived metabolites required to activate mTORC1 independent of energetic stress. We show that mTORC1 senses a metabolite downstream of the aldolase and upstream of the GAPDH-catalysed steps of glycolysis and pinpoint dihydroxyacetone phosphate (DHAP) as the key molecule. In cells expressing a triose kinase, the synthesis of DHAP from DHA is sufficient to activate mTORC1 even in the absence of glucose. DHAP is a precursor for lipid synthesis, a process under the control of mTORC1, which provides a potential rationale for the sensing of DHAP by mTORC1.


Conflict of interest statement

Competing Interests Statement

DMS is a founder, shareholder, and a member of the scientific advisory board for Navitor Pharmaceuticals, which is targeting the mTORC1 pathway for therapeutic benefit. J.M.O. is a shareholder of Navitor Pharmaceuticals. The other authors declare no competing intersts.

Figures

Extended Fig. 1
Extended Fig. 1
Extended Fig. 2
Extended Fig. 2
Extended Fig. 3
Extended Fig. 3
Extended Fig. 4
Extended Fig. 4
Extended Fig. 5
Extended Fig. 5
Extended Fig. 6
Extended Fig. 6
Extended Fig. 7
Extended Fig. 7
Extended Fig. 8
Extended Fig. 8
Figure 1.
Figure 1.. Various sugars can activate mTORC1 independently of AMPK.
a) AMPK is not necessary for glucose to regulate mTORC1. Wildtype parental HEK-293T cells, a control cell line generated by expressing Cas9 and an sgRNA targeting the AAVS1 locus (AAVS1 clone), or two AMPKα double knockout (DKO) cell lines generated with sgRNAs targeting both genes encoding the AMPKα subunit of AMPK (PRKAA1 and PRKAA2), were starved of glucose for 1 hour or starved and then re-stimulated with 10mM glucose for 10 minutes. Whole cell lysates were prepared and analyzed by immunoblotting using the indicated antibodies. b) In the absence of glucose, mannose activates mTORC1 in AMPKα DKO HEK-293T cells. Cells were incubated in media containing the indicated concentrations of glucose or mannose for 1 hour prior to the preparation and analysis of cell lysates. c) Fructose, in the absence of glucose, activates mTORC1 in cells expressing the fructose transporter GLUT5. Cells were incubated for an hour in either glucose or fructose for 1 hour. FLAG-immunoprecipitates were prepared from cells co-expressing FLAG-S6K1 and either a control protein (HA-metap2) or HA-GLUT5. Immunoprecipitates and cell lysates were analyzed by immunoblotting for the phosphorylation state or levels of the indicated proteins. d) Glucosamine, in the absence of glucose, activates mTORC1 in AMPKα DKO HEK-293T cells. Cells were incubated for 1 hour in the indicated concentrations of glucose or glucosamine. Whole cell lysates were analyzed by immunoblotting. E) Schematic demonstrating how hexoses feed into glycolysis according to the KEGG pathway (HK: hexokinase; GPI: glucose 6-phosphate isomerase; PFK: phosphofructokinase; ALDO: Aldolase; TPI: triosephosphate isomerase; GAPDH: glyceraldehyde 3-phosphate dehydrogenase; MPI: mannose 6-phosphate isomerase). Dashed lines separate lanes that were run on different gels (b) or where irrelevant intervening lanes were spliced out (c).
Figure 2.
Figure 2.. Glucose 6-phosphate isomerase and Aldolase are upstream of the metabolite that signals glucose availability to mTORC1.
a) Diagram depicting glucose and mannose metabolism emphasizing the roles of Glucose 6-phosphate isomerase (GPI), Mannose 6-phosphate isomerase (MPI), and Aldolase (ALDO) in glycolysis. b) GPI is required for glucose, but not mannose, to activate mTORC1. AMPKα DKO GPI dox-off cells were treated with doxycycline (dox) for 10 days and placed for 2 hours in media with either no sugar, glucose, or mannose. Cell lysates were analyzed by immunoblotting for the phosphorylation state or levels of the indicated proteins. c) GPI is required for the metabolism of glucose beyond glucose 6-phosphate but not for that of mannose. Cells were treated as in (b) and metabolite extracts analyzed by LC/MS. Data are shown as mean ± s.e.m. for n = 3 biologically independent replicates. P-values were determined for two-sided Student’s t-test. N.D., peak not detected; N.A. statistical test not applicable. d) ALDO is required for the activation of mTORC1 by glucose. HEK-293T AMPKα DKO ALDO dox-off cells were treated with doxycycline for 5 days. Cells were then incubated in media containing the indicated concentrations of glucose for 3 hours. Cell lysates were analyzed by immunoblotting for the phosphorylation state and levels of the indicated proteins. e) Loss of ALDO expression leads to supraphysiological levels of Fructose 1,6-bisphosphate and prevents glucose from generating metabolites downstream of aldolase, including dihydroxyacetone phosphate (DHAP) and glyceraldehyde 3-phosphate (GAP). HEK-293T AMPKα DKO ALDO dox-off cells were incubated for 3 hours without glucose (-Gluc) or with 2 mM glucose (+Gluc). Metabolite extracts were analyzed by LC/MS. Data are shown as mean ± s.e.m. for n = 3 biologically independent replicates. P-values were determined for two-sided Student’s t-test. N.D., peak not detected.
Figure 3.
Figure 3.. GAPDH is downstream of the metabolite that signals glucose availability to mTORC1.
a) Diagram of glycolysis with an emphasis on the role of GAPDH and its inhibitor Koningic Acid (KA). b) Inhibition of GAPDH by KA prevents the suppression of mTORC1 normally caused by glucose starvation, but only if KA is added at the beginning of the starvation period. AMPKα DKO HEK-293T cells were incubated with glucose (Unst) or starved of it for 3 hours. Koningic acid was added to cells either at the beginning of the 3-hour glucose starvation period or for 15 minutes after a 3-hour starvation. Cell lysates were analyzed by immunoblotting for the phosphorylation state or levels of the indicated proteins. c) GAPDH inhibition by 50 μM KA prevents depletion of metabolites upstream of GAPDH upon glucose starvation but only if added at the beginning of the starvation period. Cells were treated as in (B), metabolite extracts were analyzed by LC/MS. Data are shown as mean ± s.e.m. for n = 3 biologically independent replicates. P-values were determined for two-sided Student’s t-test. N.D., peak not detected. d) Overexpression of the KA-resistant version of GAPDH from the fungus T. koningii (TK-GAPDH) eliminated the effects of KA on mTORC1 signaling. Cells stably expressing FLAG-metap2 or FLAG-TK-GAPDH were incubated under the indicated conditions. KA was added at the beginning of the starvation. Cell lysates were analyzed by immunoblotting for the phosphorylation state or levels of the indicated proteins. e) Overexpression of TK-GAPDH prevents the accumulation of metabolites upstream of GAPDH normally caused by KA treatment in glucose-starved cells. Cells were treated as in (d). Metabolite extracts were analyzed by LC/MS. Data are shown as mean ± s.e.m. for n = 3 biologically independent replicates. P-values were determined for two-sided Student’s t-test. f) Loss of GAPDH expression has the same phenotype as inhibition of GAPDH by KA. GAPDH dox-off cells treated with doxycycline maintain mTORC1 activity even after a 3-hour starvation of glucose.
Figure 4.
Figure 4.. Triose phosphate isomerase (TPI) is downstream of the metabolite that signals glucose availability to mTORC1 and DHAP synthesis is sufficient to activate mTORC1.
a) Model depicting the metabolism of trioses and triose-phosphates. b-d) TPI loss causes supraphysiological levels of dihydroxyacetone phosphate (DHAP) and slower catabolism and slower inhibition of mTORC1 following glucose starvation. The levels of glyceraldehyde 3-phosphate (GAP) are decreased and consumed at a normal rate. AMPKα DKO TPI dox-off HEK-293T cells treated with doxycycline for ten days were starved of glucose for the indicated periods of time. Metabolite extracts were analyzed by LC/MS (b) and protein lysates by immunoblot (c). Data are shown in (b) as mean ± s.e.m. for n = 3 biologically independent replicates. P-values were determined for two-sided Student’s t-tests. N.D., peak not detected. Immunoblots for the phosphorylation state and levels of the indicated proteins (c) were quantified in (d). Data are shown as mean ± s.e.m. for n = 3 biologically independent replicates. P-values were determined for two-sided Student’s t-test. e) Overexpression of GPD1 decreases the activation of mTORC1 by glucose. AMPKα DKO HEK-293T cells expressing the indicated cDNAs were starved of glucose for 3 hours or starved of glucose and re-stimulated with the indicated concentration of glucose for 10 minutes. f) DHAP synthesis is sufficient to activate mTORC1 in the absence of glucose. AMPKα DKO HEK-293T cells stably expressing the control protein FLAG-metap2 or FLAG-TKFC were starved of glucose for 3 hours or starved and stimulated for 10 minutes with glucose or the indicated concentrations of dihydroxyacetone (DHA) or glyceraldehyde (GA). g) The fold-change in DHAP and GAP levels between cells in low (1 mM) and high (10 mM) glucose is greater than that for any other glycolytic metabolite. AMPKα DKO HEK-293T cells were starved of glucose for 3 hours and then restimulated for 15 minutes with either 1 mM glucose or 10 mM glucose. Metabolite extracts were analyzed by LC/MS. Data are shown as mean ± s.e.m. for n = 3 biologically independent replicates. P-values were determined for two-sided Student’s t-test. * The peak used to quantify fructose 6-phosphate (F6P) levels may also contain glucose 1-phosphate. h) Diagram depicting the metabolism of glucose in most cells and of fructose in the liver and intestine.

References

    1. Saxton RA & Sabatini DM mTOR Signaling in Growth, Metabolism, and Disease. Cell 168, 960–976 (2017). - PMC - PubMed
    1. Kubrusly MS et al. A role for mammalian target of rapamycin (mTOR) pathway in non alcoholic steatohepatitis related-cirrhosis. Histol. Histopathol 25, 1123–1131 (2010). - PubMed
    1. Guillén C & Benito M mTORC1 Overactivation as a Key Aging Factor in the Progression to Type 2 Diabetes Mellitus. Front. Endocrinol 9, (2018). - PMC - PubMed
    1. Ardestani A, Lupse B, Kido Y, Leibowitz G & Maedler K mTORC1 Signaling: A Double-Edged Sword in Diabetic β Cells. Cell Metab 27, 314–331 (2018). - PubMed
    1. Lee PL, Tang Y, Li H & Guertin DA Raptor/mTORC1 loss in adipocytes causes progressive lipodystrophy and fatty liver disease. Mol. Metab 5, 422–432 (2016). - PMC - PubMed

Publication types

MeSH terms