. 2020 Sep;23(9):1111-1124.
doi: 10.1038/s41593-020-0675-x. Epub 2020 Jul 27.

Posterior amygdala regulates sexual and aggressive behaviors in male mice

Affiliations

Posterior amygdala regulates sexual and aggressive behaviors in male mice

Takashi Yamaguchi et al. Nat Neurosci. 2020 Sep.

Abstract

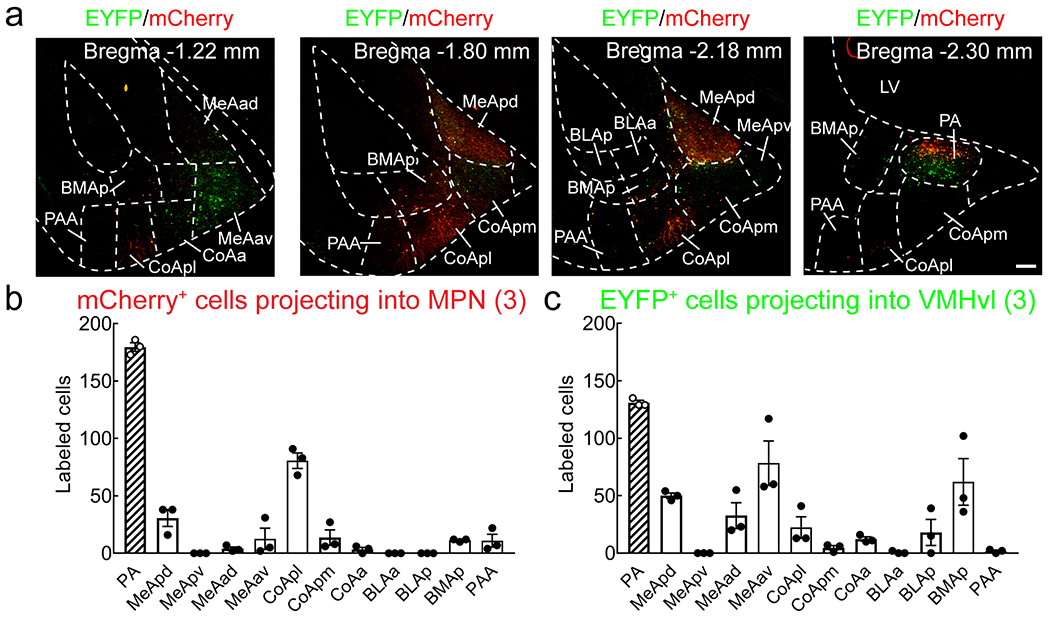
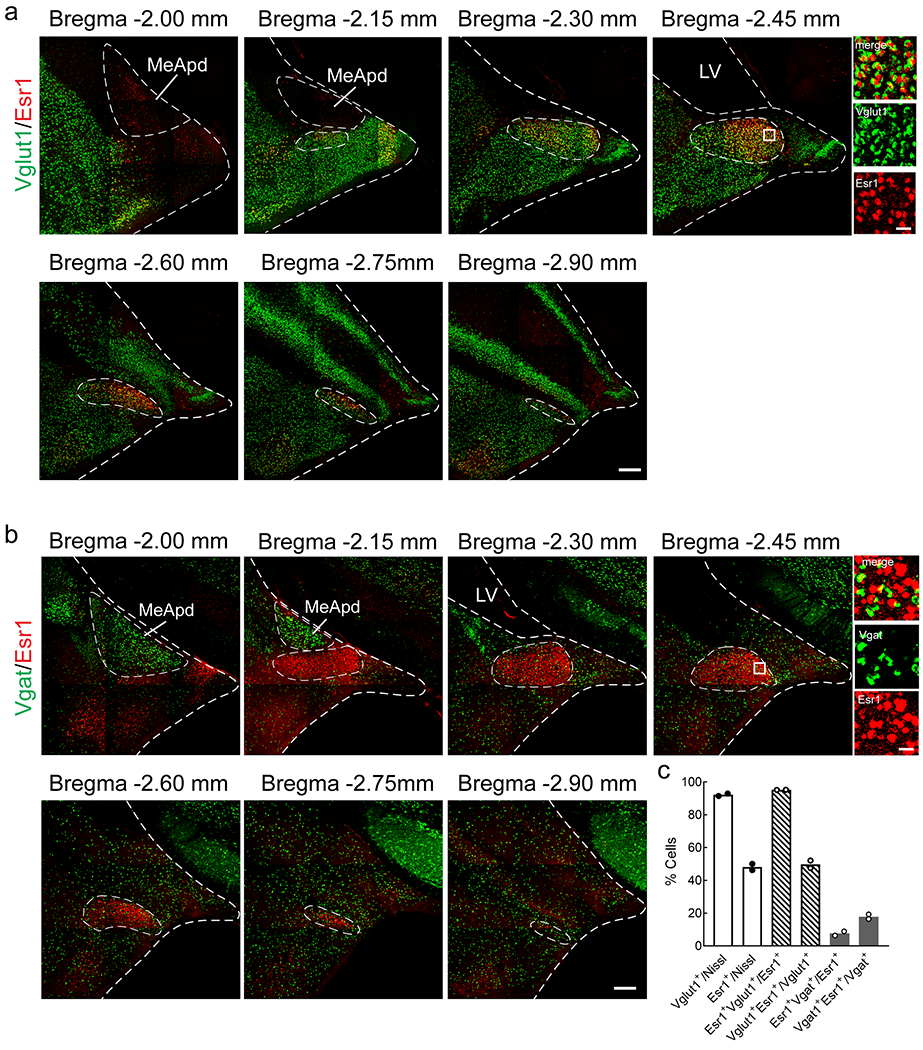
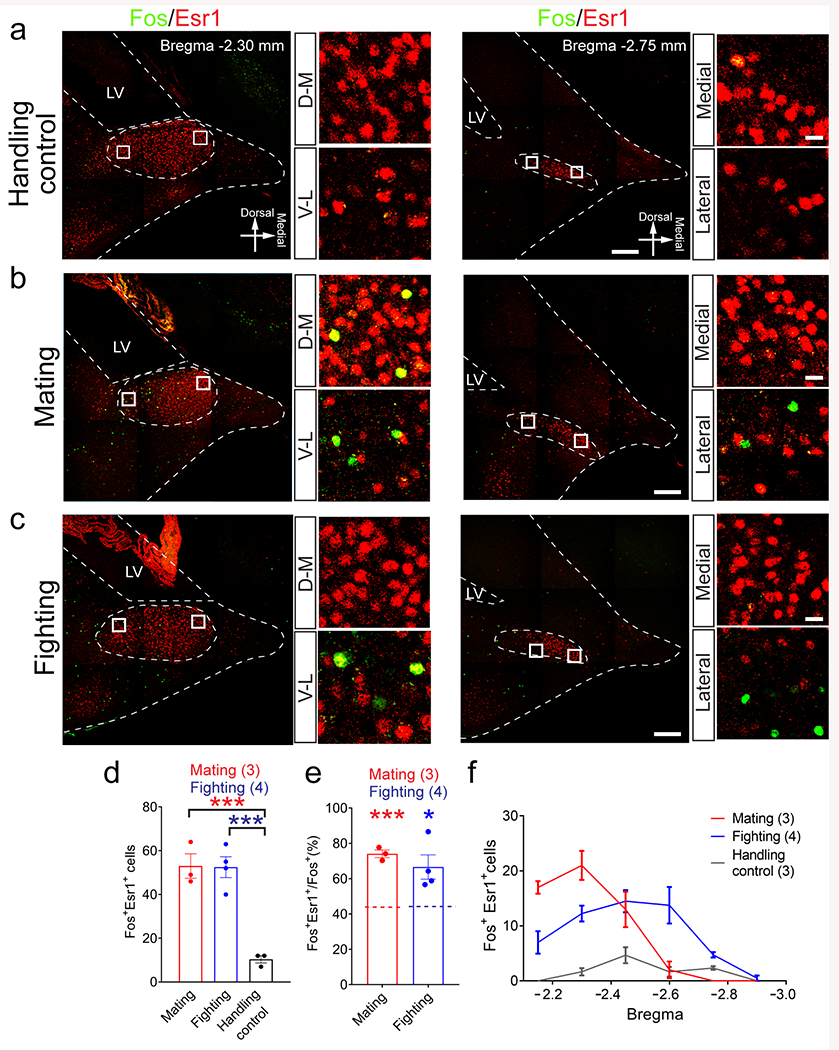
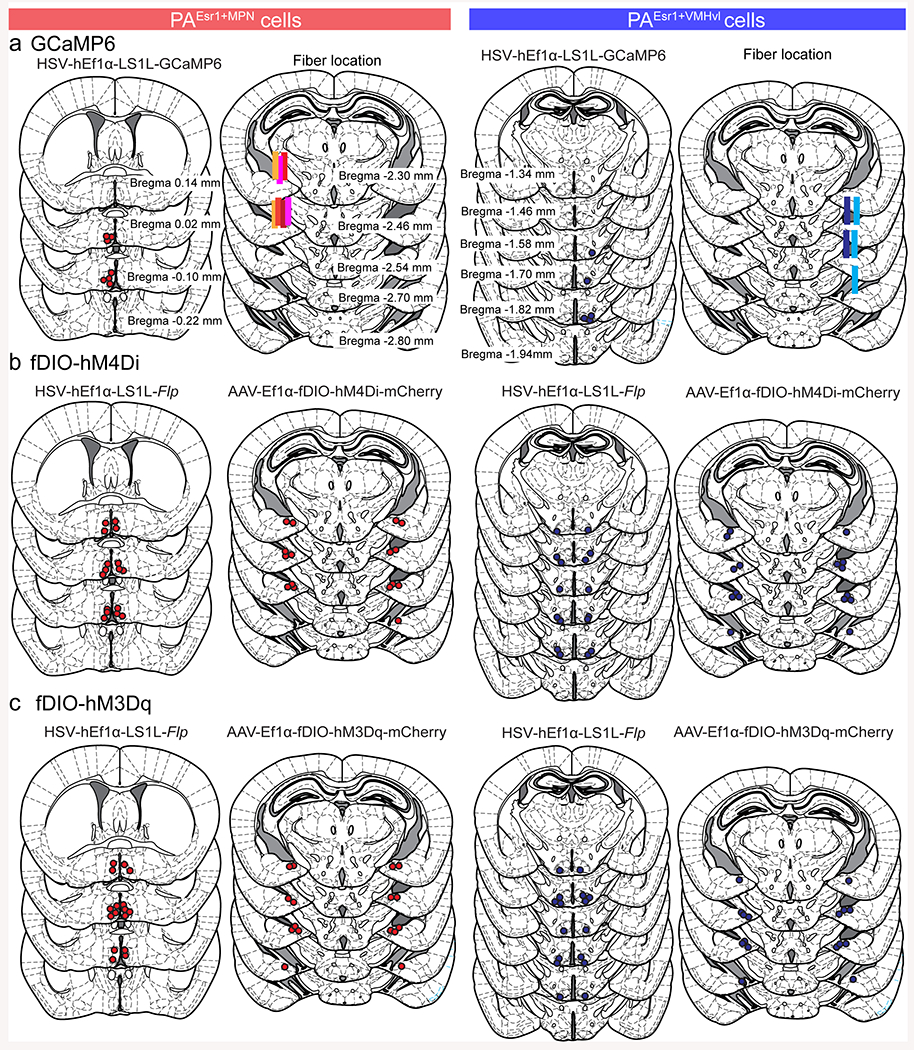
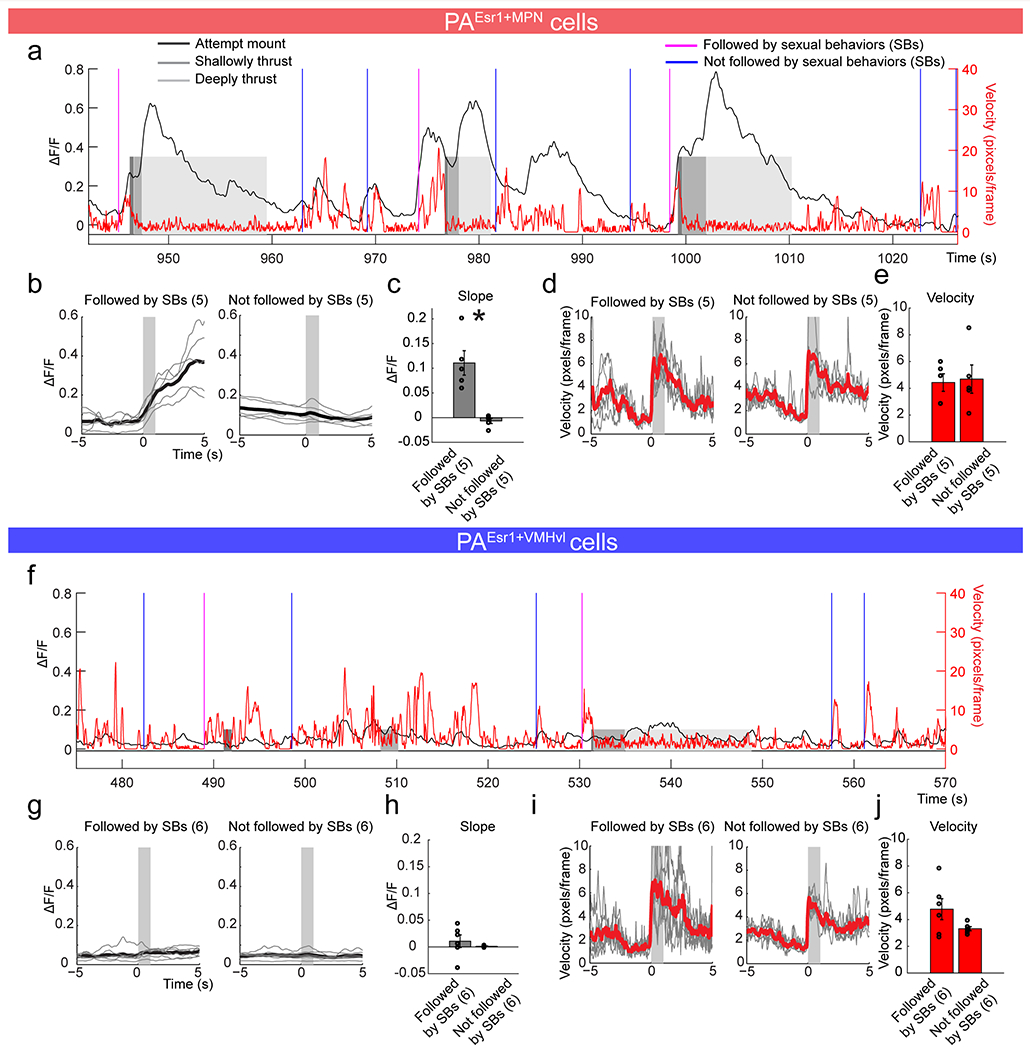
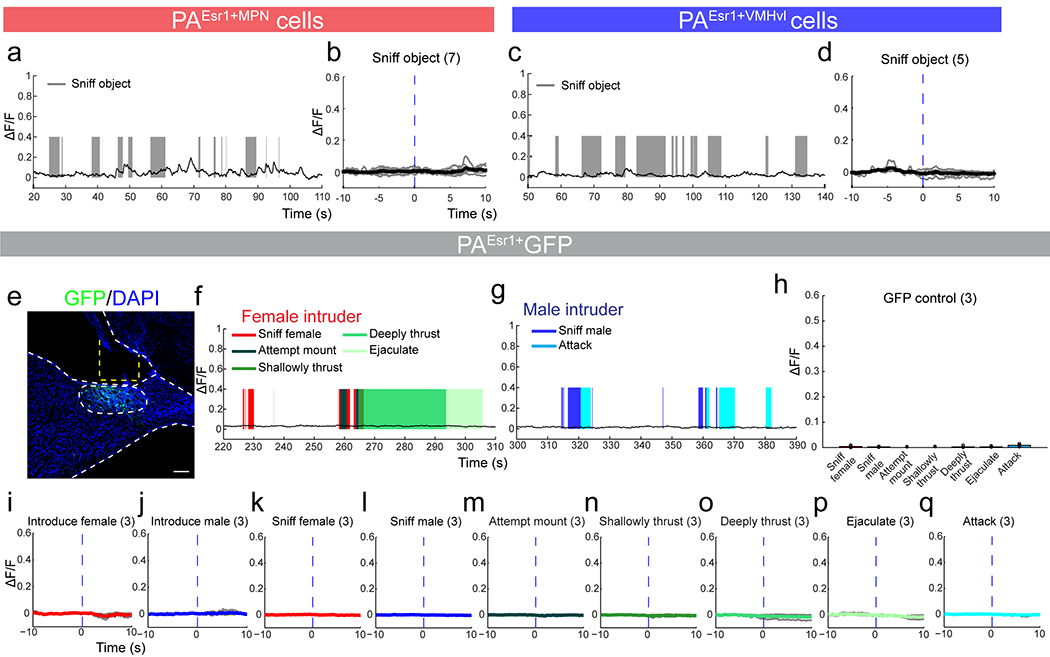
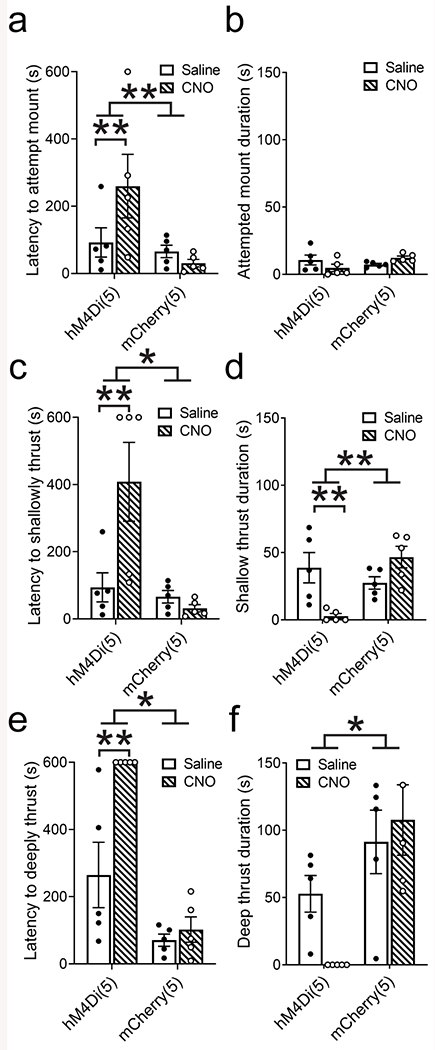
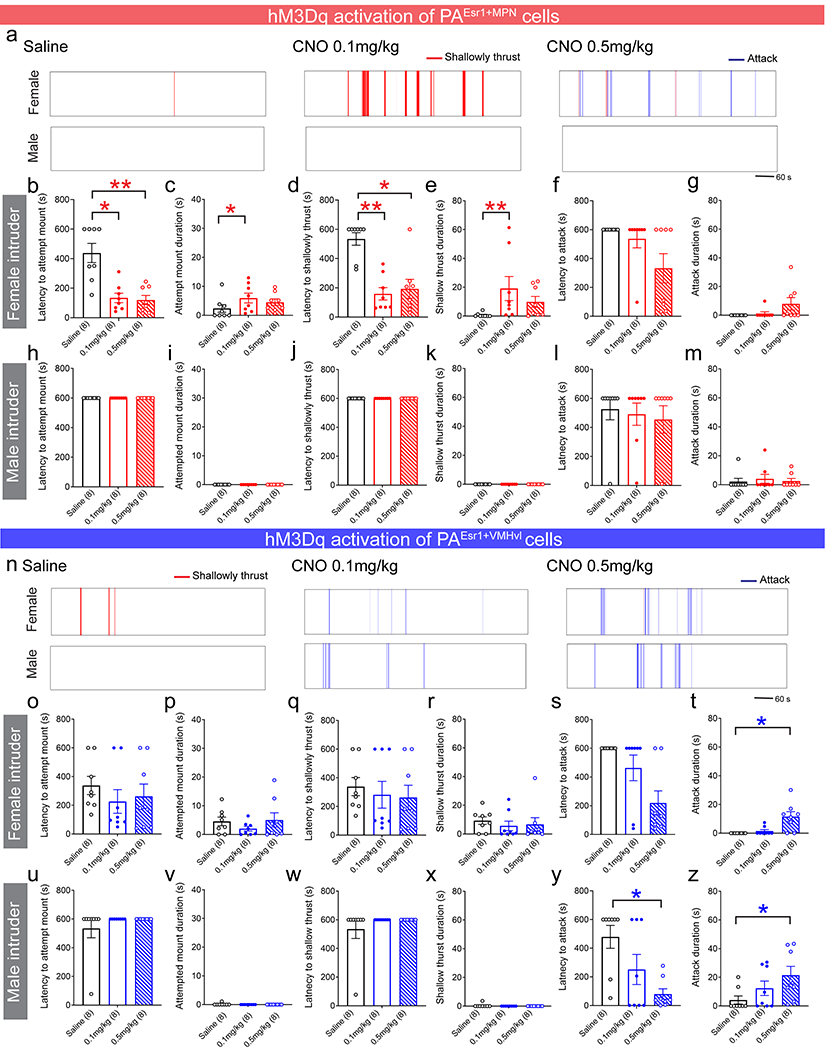
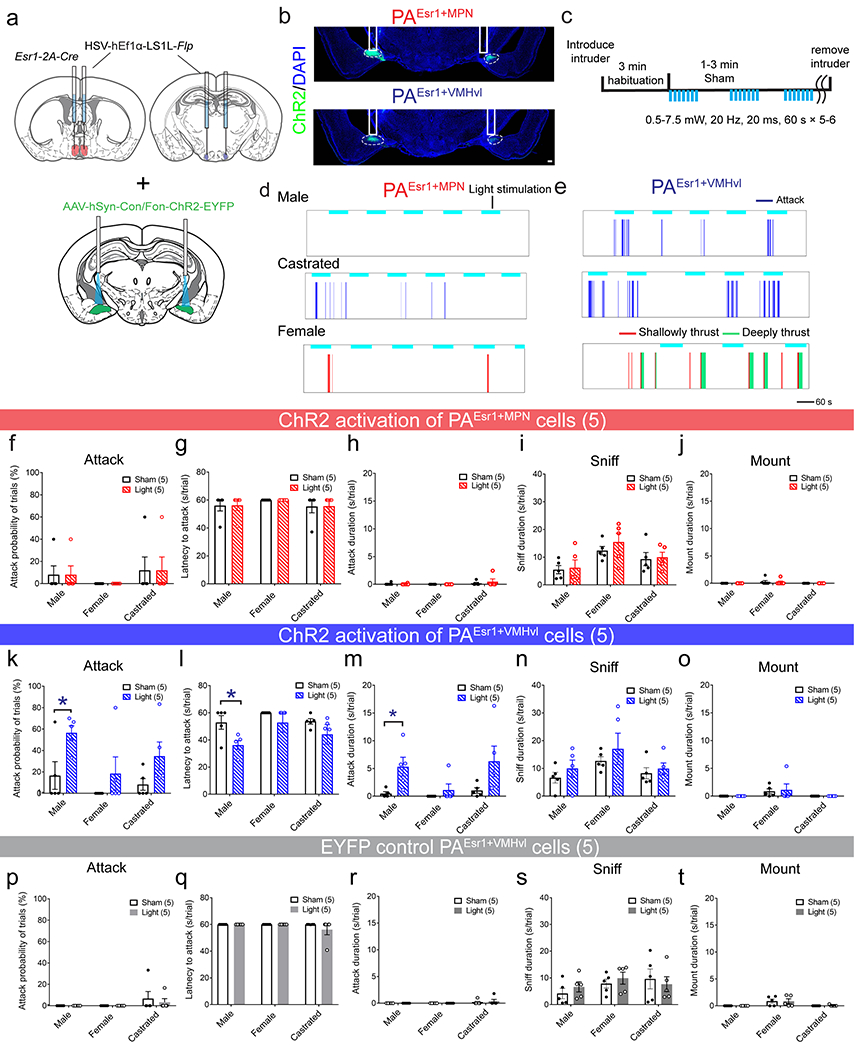
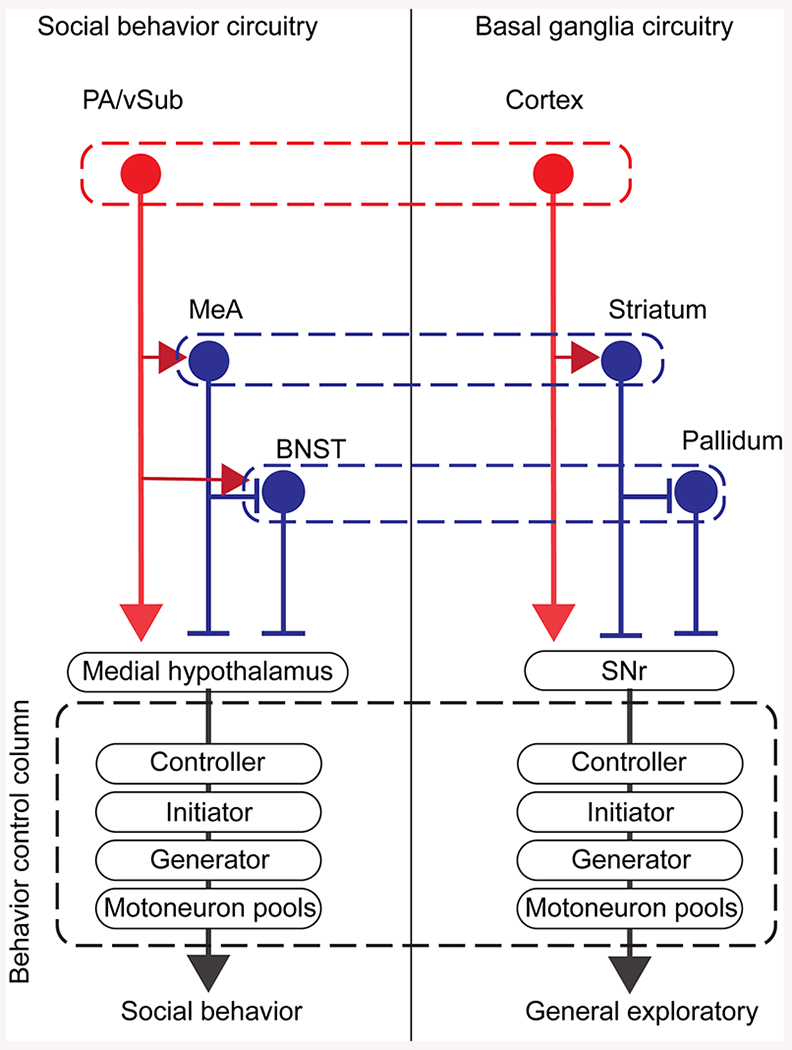
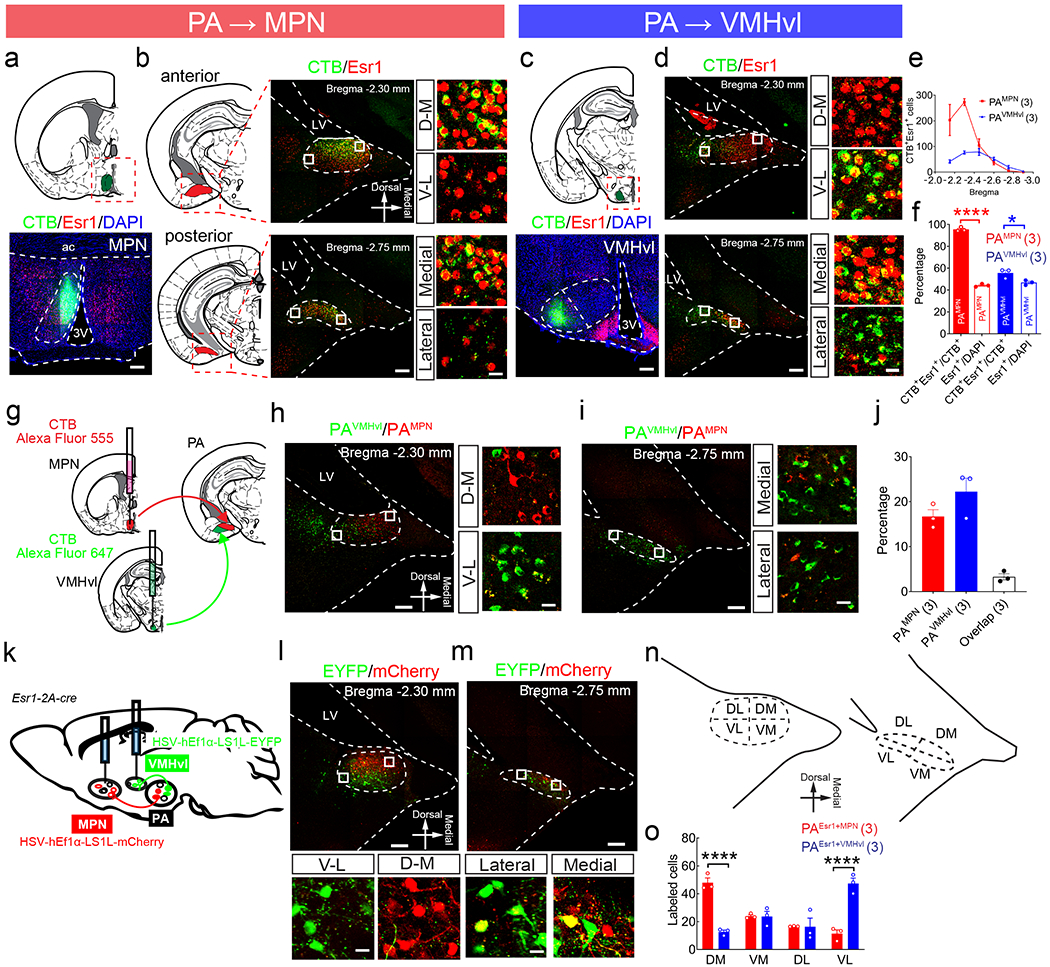
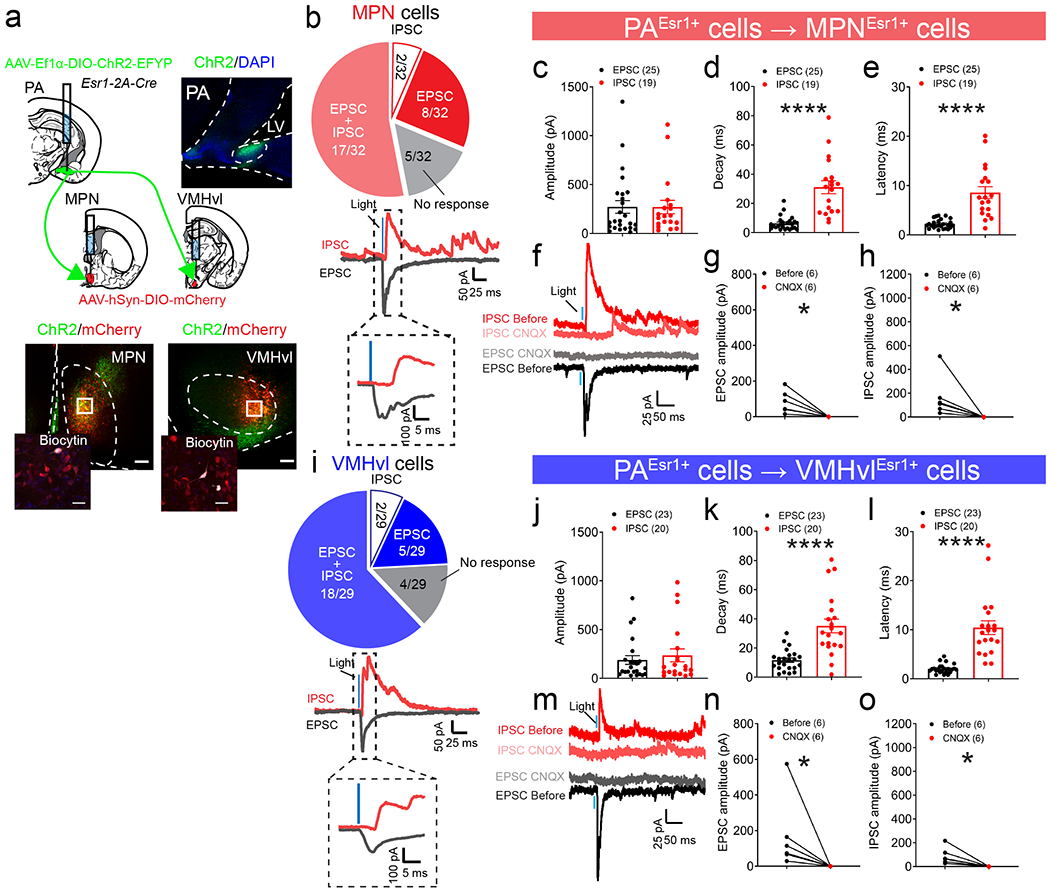
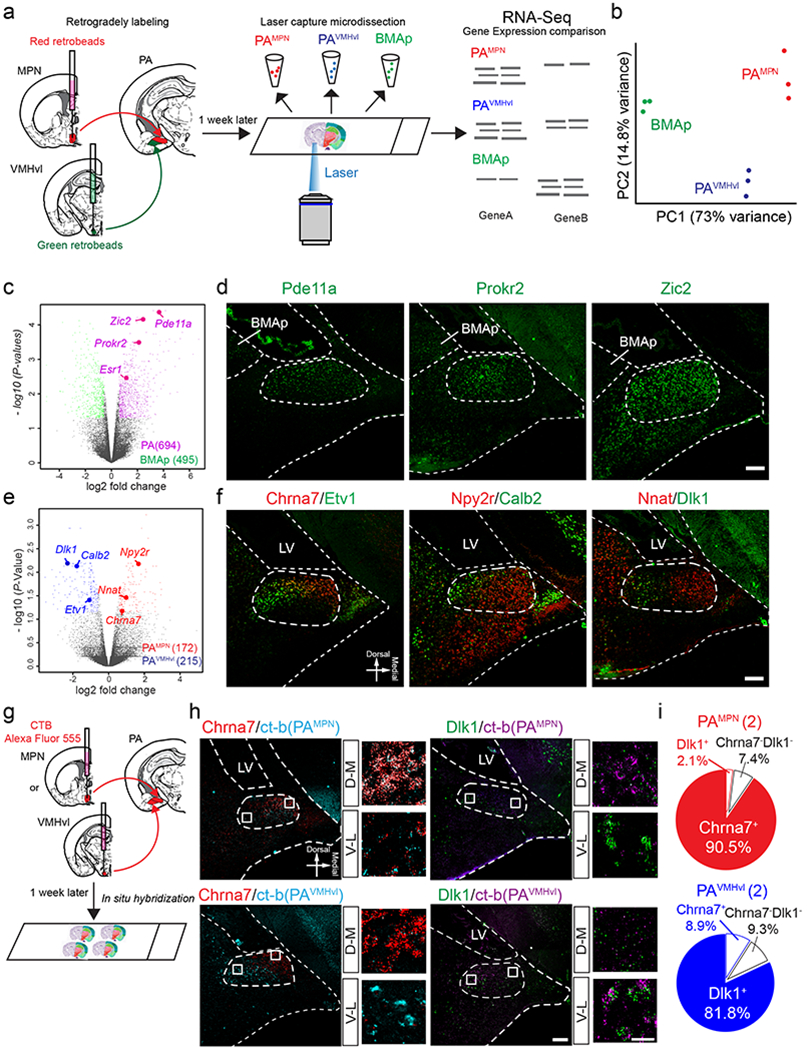
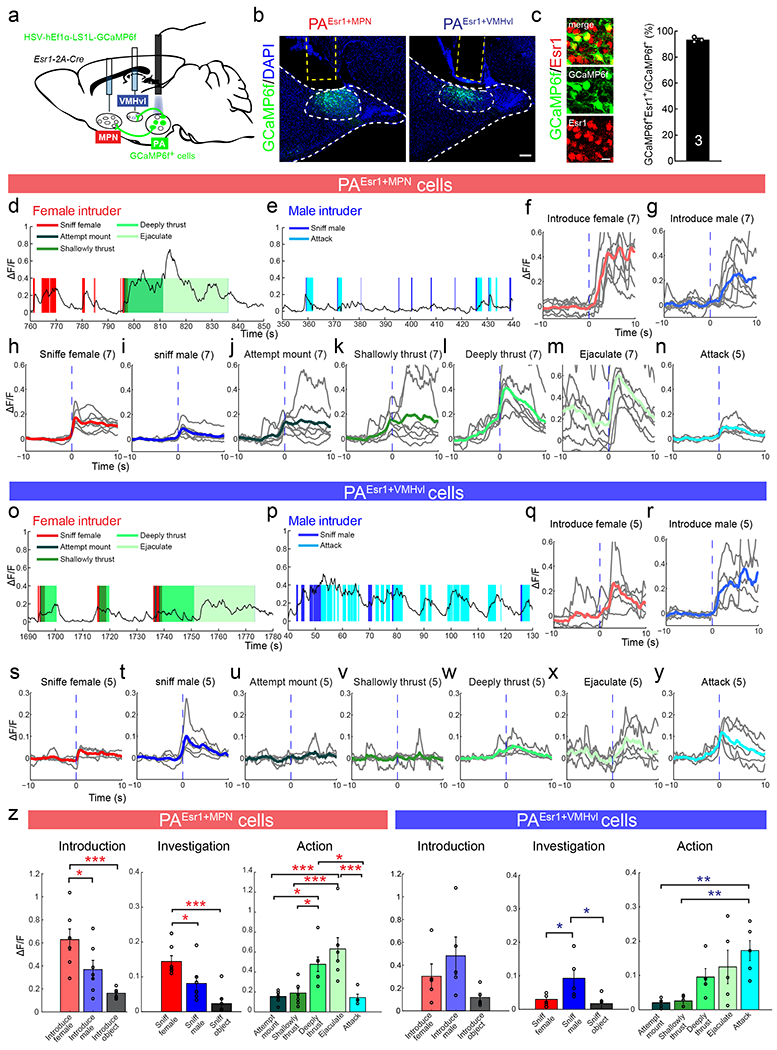
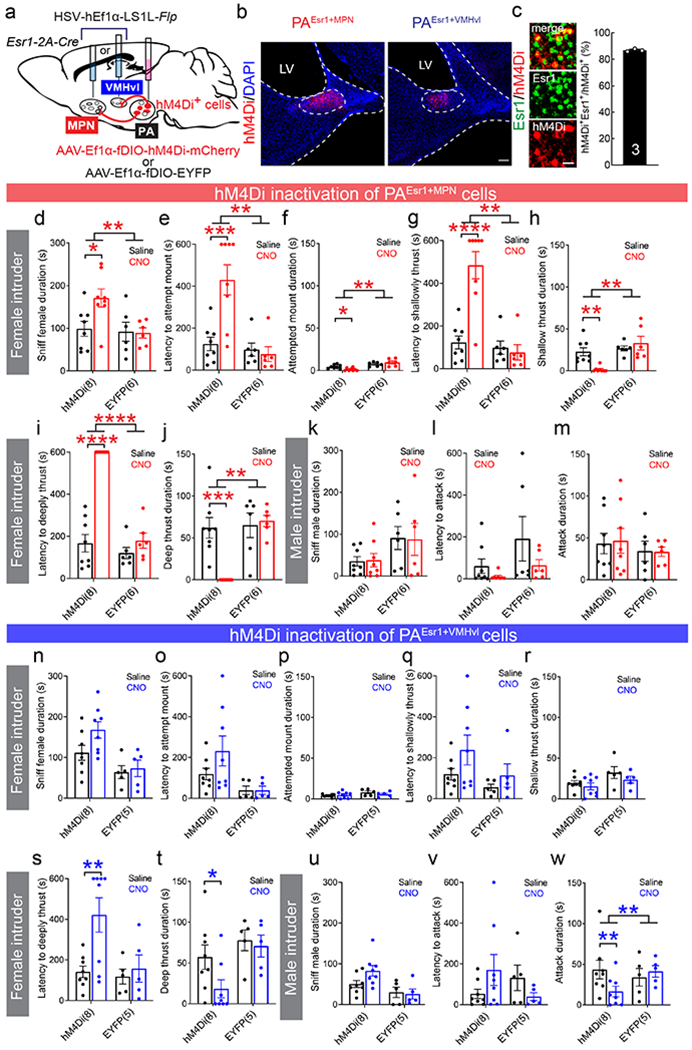
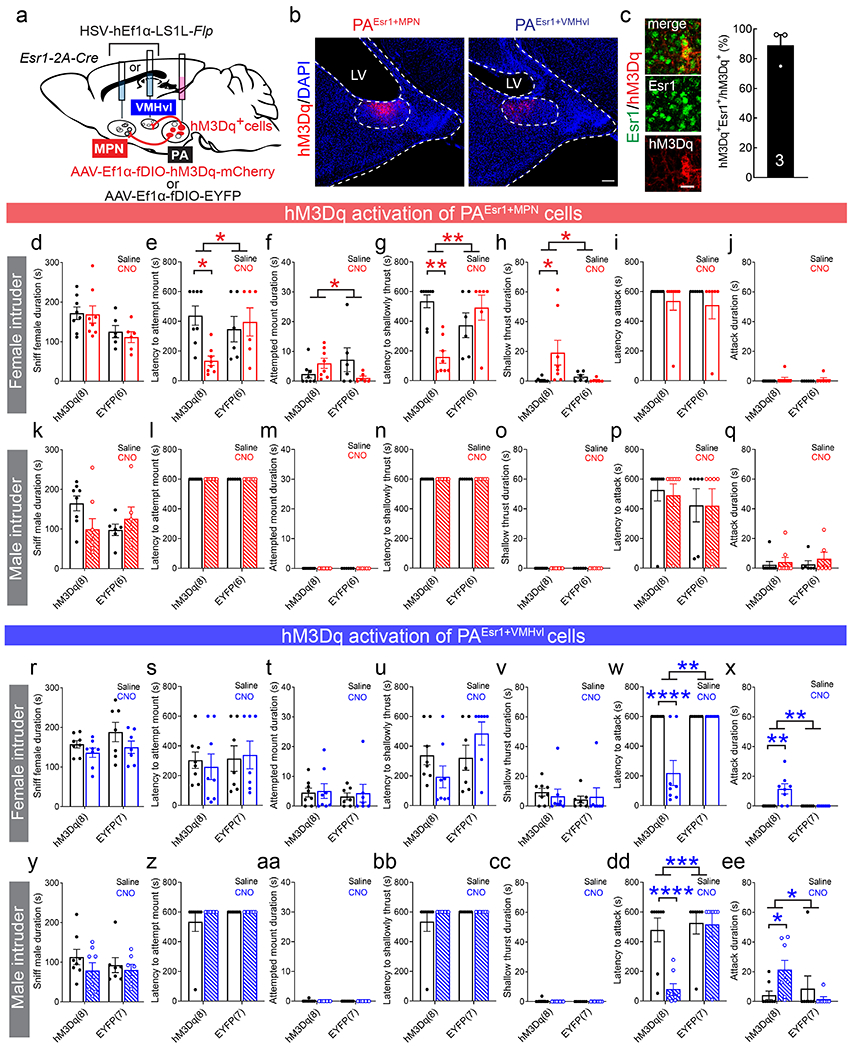
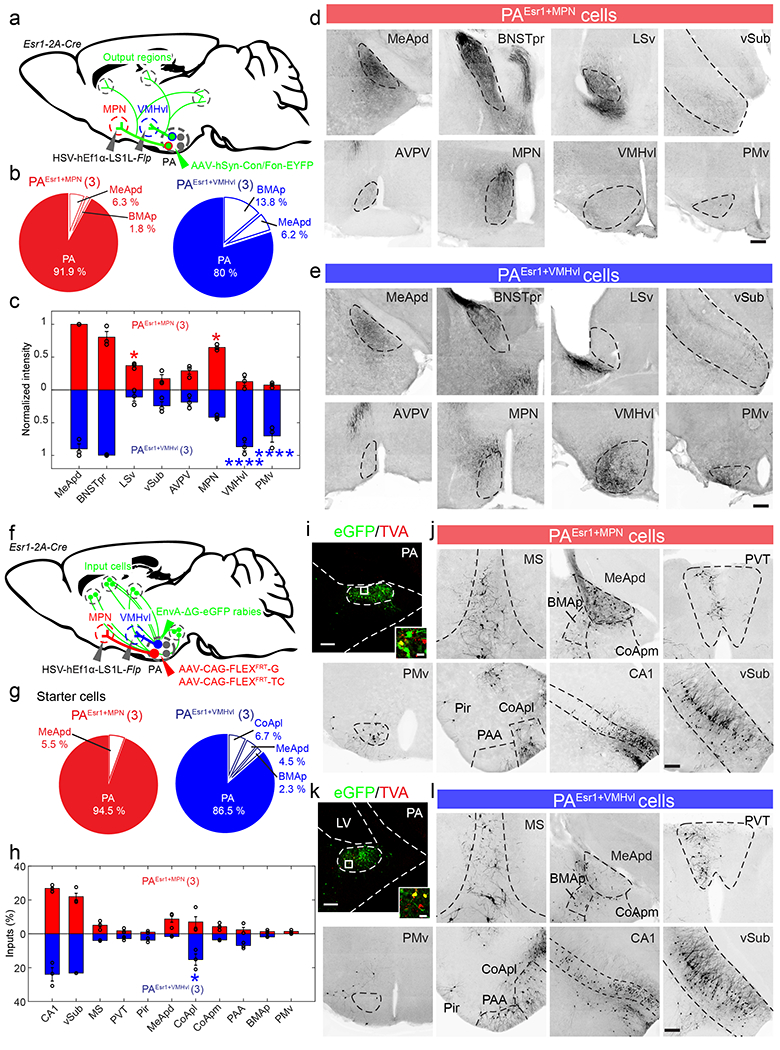
Sexual and aggressive behaviors are fundamental to animal survival and reproduction. The medial preoptic nucleus (MPN) and ventrolateral part of the ventromedial hypothalamus (VMHvl) are essential regions for male sexual and aggressive behaviors, respectively. While key inhibitory inputs to the VMHvl and MPN have been identified, the extrahypothalamic excitatory inputs essential for social behaviors remain elusive. Here we identify estrogen receptor alpha (Esr1)-expressing cells in the posterior amygdala (PA) as a main source of excitatory inputs to the hypothalamus and key mediators for mating and fighting in male mice. We find two largely distinct PA subpopulations that differ in connectivity, gene expression, in vivo responses and social behavior relevance. MPN-projecting PAEsr1+ cells are activated during mating and are necessary and sufficient for male sexual behaviors, while VMHvl-projecting PAEsr1+ cells are excited during intermale aggression and promote attacks. These findings place the PA as a key node in both male aggression and reproduction circuits.


Conflict of interest statement

Competing interests

The authors declare no competing interests.

Figures

Extended Data Fig. 1
Extended Data Fig. 1. PAEsr1+ cells provide the largest inputs to the medial hypothalamus among all the Esr1+ cells in the amygdala, related to Figure 1.
(a) The retrogradely labeled Esr1+ cells in the amygdala after HSV injection into VMHvl (green) and MPN (red). Scale bar: 200 μm. Images are representative of n = 3 mice. (b and c) The distributions of mCherry+ (MPN projecting, b) and EYFP+ cells (VMHvl projecting, c) after injecting HSV-hEf1α-LS1L-mCherry into the MPN and HSV-hEf1α-LS1L-EYFP into the VMHvl of Esr1–2A-Cre male mice. Data in b and c are presented as mean ± s.e.m. PA: posterior amygdala; MeApd: medial amygdala posterior dorsal subdivision; MeApv: medial amygdala posterior ventral subdivision; MeAad: medial amygdala anterior dorsal subdivision; MeAav: medial amygdala anterior ventral subdivision; CoApl: cortical amygdala posterolateral part; CoApm: cortical amygdala posteromedial part; CoAa: cortical amygdala anterior part; BLAa: basolateral amygdala anterior part; BLAp: basolateral amygdala posterior part; BMAp: basomedial amygdala posterior part; PAA: piriform-amygdalar area.
Extended Data Fig. 2
Extended Data Fig. 2. Characterization of the neurotransmitter type of PAEsr1+ neurons, related to Figure 2.
(a and b) Overlay between Vglut1 (a) or Vgat (b) (green) and Esr1 (red) in the PA from bregma level −2.00 to −2.90 mm. Vglut1 and Vgat are visualized using Vgat-ires-Cre × Ai6 and Vglut1-ires-Cre × Ai6 lines, respectively. Right showing the enlarged view of the boxed area. Scale bars: 200 μm (bottom) and 20 μm (upper right). (c) The percentage of Vglut1+ and Esr1+ cells in the total neuronal populations in PA, the percentage of PAEsr1+ cells that are glutamatergic or GABAergic, and the percentage of glutamatergic cells expressing Esr1 and the percentage of GABAergic cells expressing Esr1. n = 2 animals for each group. Data in c are presented as mean.
Extended Data Fig. 3
Extended Data Fig. 3. Topographical Fos expression patterns in the PA after mating and fighting, related to Figure 4.
(a-c) Representative images showing the expression of c-Fos (green) and Esr1 (red) in the PA at bregma level −2.30 mm (left) and −2.75 mm (right) after handling (a) (n = 3 animals), mating (b) (n = 3 animals) or fighting (c) (n = 4 animals). Right showing the enlarged views of the boxed areas. Scale bars: 200 μm (left) and 20 μm (right). (d) The number of Fos+ neurons in the PA increased significantly after mating and fighting. One-way ANOVA with Tukey’s multiple comparison test. (e) Majority of Fos+ cells induced by mating or fighting express Esr1 in the PA. Red and blue dashed lines mark the percentage of Esr1+ cells in the total PA population. Two-tailed unpaired t-test. (f) The number of Fos+ neurons expressing Esr1 in the PA along the anterior-posterior axis after handling control (gray), mating (red) or fighting (blue). All data in d, e, and f are presented as mean ± s.e.m. *p < 0.05, ***p < 0.001. For detailed statistics information, see Supplementary Table 1.
Extended Data Fig. 4
Extended Data Fig. 4. Virus injection and expression sites and optic fiber placements for recording and functional manipulation experiments, related to Figures 4, 5 and 6.
(a-c) Coronal brain sections at the bregma level of MPN, VMHvl and PA showing the virus injection or expression sites (dots) and optic fiber placements (lines) in fiber photometry and pharmacogenetics experiments. Each dot or line represents one animal. Injection and recording sites in each animal are unilateral in (a) and bilateral in (b and c). Brain atlas images are modified from.
Extended Data Fig. 5
Extended Data Fig. 5. PAEsr1+MPN cells but not PAEsr1+VMHvl cells increase activity during initiation of sexual behaviors, related to Figure 4.
(a) Representative Ca2+ trace (black) of PAEsr1+ cells and the test animal’s movement velocity (red) during interactions with a female mouse. Vertical lines mark the computer detected velocity changing points that are either followed by mounting attempts within 3 s (magenta) or not (blue). Gray shades mark the manually annotated attempted mount (dark gray), shallow-thrust (median gray) and deep-thrust (light gray). (b) Ca2+ signal aligned to the onset of movement initiation, either followed by sexual behaviors (left) or not (right). (c) Bar graphs showing that the slope of the Ca2+ signal is significantly positive between 0 and 1 s (shades in b) after movement initiation only if the animal later initiated mounting. The average latency from movement initiation to manually annotated mounting initiation is 1.3 s. (d) Velocity of the animal aligned to the automatically detected velocity changing points, either followed by sexual behaviors (left) or not (right). (e) Bar graphs showing the velocity change from −1–0 s to 0–1 s in (d) does not differ between trials followed by sexual behaviors and those not. n = 5 animals in b-e. (f-j) PAEsr1+VMHvl cells showed no increase in Ca2+ activity during the movement initiation regardless whether it is followed by attempted mounting or not. Plots are organized in parallel to those shown in a-e. n = 6 animals in g-j. All data in c, e, h and j are presented as mean ± s.e.m. One sample two-tailed t-test in c and h. Two-tailed paired t-test in e and j. *p < 0.05. For detailed statistics information, see Supplementary Table 1.
Extended Data Fig. 6
Extended Data Fig. 6. No change in PAEsr1+MPN and PAEsr1+VMHvl Ca2+ signal during non-social interaction and no change in fluorescence signal during social behaviors in GFP control animals, related to Figure 4.
(a and c) Representative traces showing the GCaMP6 signal of PAEsr1+MPN (a) and PAEsr1+VMHvl (c) cells during object interaction. Gray shades mark sniffing object episodes. (b and d) PETHs of Ca2+ signal (ΔF/F) of PAEsr1+MPN (b) and PAEsr1+VMHvl cells (d) aligned to sniffing object. n = 7 (PAEsr1+MPN) and 5 (PAEsr1+VMHvl) animals. (e) A representative image showing GFP (green) expression in the PAEsr1+ cells. Blue: DAPI. Scale bar: 200 µm. Yellow dashed lines indicate the optic fiber location. (f and g) Representative Ca2+ traces during interaction with a female (f) and a male intruder (g) introduced into the home cage of the recording mouse. Colored shades mark the behavioral episodes. (h) The peak ΔF/F during various social behaviors of all animals. n = 3 animals. All data in h are presented as mean ± s.e.m. One-way ANOVA with post-hoc Tukey’s test. p > 0.05. (i-q) PETHs of fluorescence signals aligned to intruder introduction (i and j), sniffing female (k), sniffing male (l), attempted mounting (m), shallow-thrust (n), deep-thrust (o), ejaculation (p), and attack (q). Gray and bold color lines indicate results from individual animals and the population average, respectively. Vertical dashed blue lines indicate time 0. For detailed statistics information, see Supplementary Table 1.
Extended Data Fig. 7
Extended Data Fig. 7. hM4Di mediated PAEsr1+ cell inactivation impaired male mouse sexual behaviors. Related to Figure 5.
(a, c, d) CNO injection prolonged the latencies to attempt mount (a), shallow thrust (c) and deep thrust (e) in PAEsr1+ hM4Di but not mCherry expressing animals. (b, d, f) The durations of shallow thrust (d) and deep thrust (f) significantly decreased after CNO injection in test but not control groups. Note that each test lasts 10 minutes. For animals that did not show the relevant behaviors within the testing period, the latency will be set at 600 s. n = 5 animals in a-f. All data in a-f are presented as mean ± s.e.m. Two-way ANOVA with repeated measures followed by Bonferroni multiple comparison test. *p < 0.05; **p< 0.01. For detailed statistics information, see Supplementary Table 1.
Extended Data Fig. 8
Extended Data Fig. 8. hM3Dq mediated activation of PAEsr1+MPN and PAEsr1+VMHvl promote sexual and aggressive behaviors in naïve male mice in a CNO dose dependent manner, related to Figure 6.
(a) Representative raster plots showing the behaviors towards male and female intruders after saline, 0.1 mg/kg CNO and 0.5 mg/kg CNO i.p. injection in PAEsr1+MPN hM3Dq expressing animals. Scale bar: 60 s. (b-g) Both 0.1 mg/kg and 0.5 mg/kg CNO shortened the latency to attempted mount, shallow thrust and increased the duration of attempted mount and shallow thrust while only 0.5 mg/kg promoted female-directed aggression. (h-m) CNO injection into PAEsr1+MPN hM3Dq expressing animals did not promote male-directed aggression regardless of the CNO concentration. (n) Representative raster plots showing the behaviors towards male and female intruders after saline, 0.1 mg/kg CNO and 0.5 mg/kg CNO i.p. injection in PAEsr1+VMHvl hM3Dq expressing animals. Scale bar: 60 s. (o-z) 0.5 mg/kg CNO i.p. injection in PAEsr1+VMHvl hM3Dq expressing animals caused a significant decrease in attack latency (s and y) and an increase in attack duration (t and z) towards both male and female intruders. Animals with 0.1 mg/kg CNO showed an increased trend of attack. Each test lasts 10 minutes. For animals that did not show the relevant behaviors within the testing period, the latency will be set at 600 s. n = 8 animals in b-m and o-z. All data in b-m and o-z are presented as mean ± s.e.m. Repeated measure One-way ANOVA with Geisser-Greenhouse’s correction followed by Tukey’s multiple comparison test in p; Friedman test followed by Dann’s multiple comparisons test in b-g, l-o and q-z. *p < 0.05; **p < 0.01. Brain atlas images in a are modified from. For detailed statistics information, see Supplementary Table 1.
Extended Data Fig. 9
Extended Data Fig. 9. Optogenetic activation of PAEsr1+VMHvl neurons promotes aggression while optogenetic activating PAEsr1+MPN cells fails to cause behavioral change in naïve male mice, related to Figure 6.
(a) Experimental schematics. (b) Representative images showing the expressions of ChR2-EYFP (green) and DAPI (blue) in PAEsr1+MPN (top) and PAEsr1+VMHvl (bottom) cells. Scale bar: 200 μm. Dashed lines outline the PA. Solid white lines indicate the placement of optic fibers. (c) Test schedule. (d and e) Representative raster plots illustrating behaviors against various intruders during and between light stimulation. Scale bar: 60 s. Top showing light-on period in cyan. Bottom showing behaviors. (f-j) Optogenetic activation of PAEsr1+MPN cells did not cause any measurable change in sexual and aggressive behaviors towards any intruder. (k-o) The percentage of trials that animals attacked (k), average latency to attack during each trial (l), and the average duration of attack per trial (m) towards male intruder, but not castrated male and female intruder, increased with light stimulation. (n and o) Light stimulation did not change duration of sniffing (n) or mounting (o) towards any intruders. (p-t) Animals expressing EYFP in PAEsr1+VMHvl neurons showed no behavioral changes during light stimulation. n = 5 animals for each group. All data in f-t shown as mean ± s.e.m. Two-tailed paired t-test (i, k, l, m, n, s and t) and Wilcoxon matched-pairs signed rank test (g, h, j, l, o-t). *p < 0.05. For detailed statistics information, see Supplementary Table 1.
Extended Data Fig. 10
Extended Data Fig. 10. A basic wiring diagram showing triple descending projections from the cerebral hemisphere to the behavior control column that drives social behaviors and general exploration, related to Figures 1, 7.
In parallel to the classical cortico-striato-nigral circuit that controls general exploration, PA/vSub (cortex equivalent), MeA (striatum equivalent) and BNST (pallidum equivalent) modulate the rostral part of the behavior control column (including MPN and VMHvl) through triple descending projections – a cortical excitatory projection, an striatal inhibitory projection and a pallidal disinhibitory projection. SNr: substantia nigra pars reticulate.
Figure 1.
Figure 1.. Largely distinct subpopulations of PAEsr1+ neurons project to the MPN and VMHvl
(a and c) Examples showing CTB injection sites (green) in the MPN and VMHvl. Scale bars: 200 µm. (b and d) Representative images showing Esr1 expression (red) and CTB labeling (green) in the anterior (top row, Bregma level: −2.30 mm) and posterior (bottom row, Bregma: −2.75 mm) parts of the PA after CTB injections into the MPN (a) and VMHvl (b). Right showing magnified views of the white boxed areas. Scale bars: 200 µm (left) and 20 µm (right). (e) The number of CTB+ cells along the anterior-posterior axis of PA after CTB injections into the MPN (red line) and VMHvl (blue line). (f) The percentage of CTB+ cells expressing Esr1 and the percentage of Esr1+ cells in the PA total population. In e and f, n = 3 VMHvl-injected animals and 3 MPN-injected animals. Two-tailed unpaired t-test. *p < 0.05, ****p < 0.0001. (g) Experimental Schematics for dual labeling of PAMPN and PAVMHvl cells with Alexa555-CTB and Alexa647-CTB. (h and i) Representative images showing MPN- (red) and VMHvl-projecting (green) cells in the anterior (h) and posterior parts of the PA (i). Right showing magnified views of the white boxed areas on the left. Scale bars: 200 µm (left) and 20 µm (right). (j) The percentage of CTB+ and overlapping cells in the PA total population. n = 3 animals. (k) Viral strategy for dual-retrograde labeling of PAEsr1+MPN and PAEsr1+VMHvl cells. (l and m) Representative images showing EYFP (green, from VMHvl) and mCherry (red, from MPN) labeled cells in the anterior (l) and posterior parts of PA (m). Bottom showing magnified views of the white boxed areas. Scale bars: 200 µm (top) and 20 µm (bottom). (n) Schematics showing the four subregions in the anterior (left) and posterior (right) PA where the cell counts are obtained. (o) The number of retrogradely labeled PAEsr1+MPN and PAEsr1+VMHvl cells in each of the four subregions across the anterior and posterior PA. n = 3 animals. Images in a–d, h, i, l and m are representative of n = 3 mice. Two-way ANOVA with Bonferroni’s multiple comparison test. ****p < 0.0001. All data in e, f, j, and o are expressed as mean ± s.e.m. Brain atlas images in a-c and g are modified from. See also Extended Data Fig. 1, 10. For detailed statistics information, see Supplementary Table 1.
Figure 2.
Figure 2.. PAEsr1+ cells provides monosynaptic excitatory inputs to MPNEsr1+ and VMHvlEsr1+ cells.
(a) Schematics for the channelrhodopsin assisted circuit mapping and example image showing ChR2-EYFP expression in PAEsr1+ cells (upper right), ChR2-EYFP fibers from PA and mCherry+ cells in MPN (bottom left) and VMHvl (bottom right). Insets show magnified views of the white boxes that contain mCherry expressing cells (red) and biocytin filled recorded cells (white). Scale bars: 200 µm (top) and 20 µm (insets). Brain atlas images are modified from. Histological images are representative of n = 10 animals. (b and i) Pie charts showing light-evoked synaptic responses in MPNEsr1+ (b) and VMHvlEsr1+ cells (i). Bottom showing example EPSC and IPSC traces evoked by 0.5-ms blue light pulses and the expanded views of the boxed areas. Blue vertical lines indicate light pulses. (c - e) The amplitude (c), decay time (d), and latency (e) of light-evoked EPSCs (left) and IPSCs (right) of MPNEsr1+ cells. n = 25 and 19 cells from 10 animals. (f) The example light evoked EPSC and IPSC traces before and after CNQX bath application. n = 6 cells from 6 animals. (g and h) The light-evoked EPSCs (g) and IPSCs (h) are abolished after bath application of CNQX. n = 6 cells from 6 animals. (j - o) Characterization of light-evoked EPSCs and IPSCs in the VMHvlEsr1+ cells. n = 23 and 20 cells from in 10 animals in j - l. n = 6 cells from 6 animals in n and o. All data in c-e and j-l are presented as mean ± s.e.m. Two-tailed unpaired t-test (e and k), Mann Whitney test (c, d, j and l) and Wilcoxon matched-pairs signed rank test (g, h, n and o). *p < 0.05, ****p < 0.0001. See also Extended Data Fig. 2. For detailed statistics information, see Supplementary Table 1.
Figure 3.
Figure 3.. Largely distinct transcriptional profiles for PA subregions projecting to MPN and VMHvl.
(a) Experimental schematics. (b) Map the RNA-seq results of all samples onto the principal component (PC) space. Note that samples from the same PA subregion are clustered and separated from the other neighboring areas. (c) A volcano plot illustrating genes enriched in the BMAp (green dots BMAp/PA > 1.5, p < 0.05) and PA (magenta dots, PA/BMAp > 1.5, p < 0.05). Gray dots denote genes with p >= 0.05 or fold enrichment <= 1.5 based on the limma method. n = 3 animals. (d) RNA expression patterns of three PA enriched genes: Pde11a, Prokr2 and Zic2. Scale bar: 200 µm. (e) A volcano plot illustrating genes enriched in PAVMHvl (blue dots, PAVMHvl/PAMPN > 1.5, p < 0.07) and PAMPN (red dots, PAMPN/PAVMHvl > 1.5, p< 0.07). Gray dots denote genes that commonly express in PAMPN and PAVMHvl based on the limma method. n = 3 animals. (f) RNA expression patterns of PAMPN and PAVMHvl enriched genes as indicated in (e). Scale bar: 200 µm. (g) Experimental Schematics for labeling PAMPN or PAVMHvl cells and examining their overlap with specific genes. (h) Example images of PAMPN and PAVMHvl cells labeled with Alexa555-CTB and the RNA expression pattern of Chrna7 and Dlk1. Chrna7 overlaps with PAMPN but not PAVMHvl cells while Dlk1 overlaps with PAVMHvl but not PAMPN cells. Right showing the enlarged views of the boxed areas. Scale bars: 200 μm (left) and 20 μm (right). (i) Pie charts showing the percentage of PAMPN cells (top) and PAVMHvl cells (bottom) that express Chrna7, Dlk1 or neither. n = 2 animals. Empirical Bayes moderated two-tailed t-test with Benjamini-Hochberg procedure based on the limma method (c and e). Brain atlas images in a and g are modified from. For detailed statistics information, see Supplementary Table 1.
Figure 4.
Figure 4.. Different response patterns of PAEsr1+MPN and PAEsr1+VMHvl cells during social behaviors
(a) Experimental schematics. (b) Representative images showing fiber tracks (yellow lines) and GCaMP6f (green) expression in PAEsr1+MPN (left) and PAEsr1+VMHvl cells (right). Blue: DAPI. Scale bar: 200 μm. (c) Representative images showing the overlap of GCaMP6f (green) and Esr1 (red) in the PA. Blue: DAPI. Scale bar: 20 μm. Right shows the percentage of GCaMP6f+ neurons expressing Esr1. Data are presented mean ± s.e.m; n = 3 animals. (d and e) Representative Ca2+ traces of PAEsr1+MPN cells during interaction with a female (d) and a male (e) intruder. Colored shading marks behavioral episodes. (f-n) Peri-event histograms (PETHs) of Ca2+ signal of PAEsr1+MPN cells aligned to intruder introduction and onsets of various social behaviors. Gray and color lines represent data from individual animals and the population average. n = 7 animals but only 5 animals showed attack. (o and p) Representative Ca2+ traces of PAEsr1+VMHvl neurons during interaction with a female (o) and a male (p) intruder. (q-y) PETHs of Ca2+ signal of PAEsr1+VMHvl cells aligned to intruder introduction and onsets of various social behaviors. (z) Peak Ca2+ signal of PAEsr1+MPN and PAEsr1+VMHvl cells during introduction and investigation of social and non-social stimuli, and during various stages of sexual behaviors and attack. n = 7 animals except attack (n = 5 animals) in PAEsr1+MPN group. n = 5 animals in PAEsr1+VMHvl group. All data in z are presented as mean ± s.e.m. One-way ANOVA with Tukey multiple comparison test. *p < 0.05, **p < 0.01, ***p < 0.001. See also Extended Data Fig. 3, 4, 5, 6. For detailed statistics information, see Supplementary Table 1.
Figure 5.
Figure 5.. Pharmacogenetic inhibition of PAEsr1+MPN and PAEsr1+VMHvl cells impairs sexual and aggressive behaviors
(a) Experimental schematics. (b) Representative images showing hM4Di (red) expression in PAEsr1+MPN (left) and PAEsr1+VMHvl cells (right). Blue: DAPI. Scale bar: 200 μm. (c) Representative images showing overlap between hM4Di (red) and Esr1 (green) in the PA. Scale bar: 20 μm. Right shows the percentage of hM4Di positive neurons expressing Esr1. n = 3 animals. (d-j) Sexual behaviors are significantly impaired after PAEsr1+MPN inactivation. Duration of female investigation (d) significantly increased after CNO injection in test group but not control group. Latencies to attempted mounting (e), shallow thrust (g) and deep thrust (i) increase while durations of attempted mounting (f), shallow thrust (h) and deep thrust (j) decrease after CNO injection in test group but not control group. (k-m) PAEsr1+MPN inactivation does not impair aggressive behaviors towards males. n = 8 (hM4Di) and 6 (EYFP) animals in d-m. (n-w) Comparison of social investigation, sexual and aggressive behaviors after CNO and saline injections in animals expressing hM4Di in PAEsr1+VMHvl cells. Latency to deep thrust (s) significantly increases in test group after CNO. Duration of deep thrust (t) and duration of attack (w) significantly decrease after CNO injection in test but not control groups. n = 8 (hM4Di) and 5 (EYFP) animals in n-w. Each test lasts 10 minutes. For animals that did not show the relevant behavior within the testing period, the latency will be set at 600s. All data in d-w are presented as mean ± s.e.m. Two-way ANOVA with repeated measures followed by Bonferroni’s multiple comparison test. *p < 0.05, **p < 0.01, ***p<0.001, ****p< 0.0001. See also Extended Data Fig. 7. For detailed statistics information, see Supplementary Table 1.
Figure 6.
Figure 6.. Pharmacogenetic activation of PAEsr1+MPN and PAEsr1+VMHvl cells differentially promote sexual and aggressive behaviors in naïve males.
(a) Experimental schematics. (b) Representative images showing hM3Dq (red) expression in PAEsr1+MPN (left) and PAEsr1+VMHvl cells (right). Blue: DAPI. Scale bar: 200 μm. (c) Representative images showing overlap between hM3Dq (red) and Esr1 (green) in the PA. Scale bar: 20 μm. Right shows the percentage of hM3Dq positive neurons expressing Esr1. n = 3 animals. (d-j) Sexual behaviors in naïve males towards non-receptive females are significantly enhanced after PAEsr1+MPN activation. Duration of female investigation (d) shows no change after CNO injection in both test group and control group. Latencies to attempted mounting (e) and shallow thrust (g) decreased while durations of attempted mounting (f) and shallow thrust (h) increased after 0.1 mg/kg CNO injection in test group but not control group. (k-q) 0.1 mg/kg CNO injection does not change social investigation towards male and aggressive behaviors towards males or females in PAEsr1+MPN hM3Dq expressing or control animals. n = 8 (hM3Dq) and 5 (EYFP) animals in d-q. (r-ee) Aggressive but not sexual behaviors in naïve males towards both males and females increased after PAEsr1+VMHvl activation. 0.5mg/kg CNO injection did not change investigatory or sexual behaviors (r-v, y-cc) while significantly shortened attack latency (w and dd) and increased attack duration (x and ee) towards both male and female intruders. n = 8 (hM3Dq) and 5 (EYFP) animals in r-ee. Note that after saline injection, no male attacked female and only 2/8 attacked male while 6/8 attacked female and all attacked male intruders after CNO injection. Each test lasts 10 minutes. For animals that did not show the relevant behavior within the testing period, the latency will be set at 600s. All data in d - ee are presented as mean ± s.e.m. Two-way ANOVA with repeated measures followed by Bonferroni’s multiple comparison test. *p < 0.05, **p < 0.01, ***p<0.001, ****p< 0.0001. See also Extended Data Figs. 8, 9. For detailed statistics information, see Supplementary Table 1.
Figure 7.
Figure 7.. Inputs and outputs of PAEsr1+MPN and PAEsr1+VMHvl cells
(a) The viral strategy to trace the outputs of PAEsr1+MPN and PAEsr1+VMHvl cells. (b) Pie charts show the distributions of all EYFP expressing cells. n = 3 animals for each group. (c) The density of the terminal fields measured as the normalized average pixel intensity in major downstream regions of PAEsr1+MPN and PAEsr1+VMHvl cells. n = 3 animals for each group. (d and e) Representative images showing the fibers coming from PAEsr1+MPN (d) and PAEsr1+VMHvl cells (e). PAEsr1+MPN cells project densely to MPN and moderately to AVPV while PAEsr1+VMHvl cells project strongly to VHMvl and PMv. Scale bars: 200 µm. (f) The viral strategy for labeling the direct upstream cells of PAEsr1+MPN or PAEsr1+VMHvl populations. FLEXFRT, Flp-dependent expression; G, rabies glycoprotein; TC, TVA-mCherry fusion. (g) Pie charts show the distributions of all starter cells. n =3 animals for each group. (h) Distributions of the cells upstream of PAEsr1+MPN and PAEsr1+VMHvl cells. n =3 animals for each group. (i and k) Images showing the starter cells in the PA (yellow) and neighboring PA neurons that project to the starter cells (green). Insets showing the enlarged view of the box areas. Scale bars: 200 µm and 20 µm (insets). (j and l) Representative images showing the rabies labeled cells in various brain regions, presumably upstream of PAEsr1+MPN (j) and PAEsr1+VMHvl (l) populations. Scale bars = 200 µm. Images in d, e, and i-l are representative of n = 3 mice. All data in c and h are presented as mean ± s.e.m; Two-way ANOVA followed by with Bonferroni’s multiple comparison test. *p < 0.05, **p < 0.01. See also Extended Data Fig. 10. For detailed statistics information, see Supplementary Table 1.

References

    1. Coolen LM & Wood RI Testosterone stimulation of the medial preoptic area and medial amygdala in the control of male hamster sexual behavior: redundancy without amplification. Behav Brain Res 98, 143–153, doi:10.1016/s0166-4328(98)00063-1 (1999). - DOI - PubMed
    1. Arendash GW & Gorski RA Effects of discrete lesions of the sexually dimorphic nucleus of the preoptic area or other medial preoptic regions on the sexual behavior of male rats. Brain Res Bull 10, 147–154, doi:10.1016/0361-9230(83)90086-2 (1983). - DOI - PubMed
    1. Klaric JS & Hendricks SE Effects of two-stage lesions of the medial preoptic area on sexual behavior of male rats. Physiol Behav 37, 539–542, doi:10.1016/0031-9384(86)90281-7 (1986). - DOI - PubMed
    1. Malsbury CW Facilitation of male rat copulatory behavior by electrical stimulation of the medial preoptic area. Physiol Behav 7, 797–805, doi:10.1016/0031-9384(71)90042-4 (1971). - DOI - PubMed
    1. Wei YC et al. Medial preoptic area in mice is capable of mediating sexually dimorphic behaviors regardless of gender. Nat Commun 9, 279, doi:10.1038/s41467-017-02648-0 (2018). - DOI - PMC - PubMed

Publication types