. 2020 Jul 3:14:206.
doi: 10.3389/fncel.2020.00206. eCollection 2020.

Antigen-Dependent T Cell Response to Neural Peptides After Human Ischemic Stroke

Affiliations

Antigen-Dependent T Cell Response to Neural Peptides After Human Ischemic Stroke

Francesc Miró-Mur et al. Front Cell Neurosci. .

Abstract

Ischemic stroke causes brain tissue damage and may release central nervous system (CNS)-specific peptides to the periphery. Neural antigen presentation in the lymphoid tissue could prime immune cells and result in adaptive immune response. However, autoimmune responses against neural antigens are not commonly uncovered after stroke. We studied the brain tissue of nine fatal stroke cases and the blood of a cohort of 13 patients and 11 controls. Flow cytometry carried out in three of the brain samples showed CD8 and CD4 T cells in the cerebrospinal fluid (CSF) of the ventricles in the patient deceased 1 day poststroke, T cells with an activated phenotype in the CSF of the patient that died at day 6, and T cells in the ischemic brain tissue in the patient deceased 140 days after stroke onset. Immunohistochemistry showed higher T cell numbers in the core of the lesion of the patient deceased 18 days post-stroke than in the patients deceased from 1 to 5 days post-stroke. In blood samples, we studied whether lymphocytes were primed in the periphery against neural antigens at sequential times (on admission, day 5, and day 90) after stroke. T lymphocytes of stroke patients produced IFN-γ and TNF-α and responded to MBP peptides by increasing their production of TNF-α and IL-10 at admission, but not at later time points. In contrast, IL-4 producing T cells showed progressive increases. Higher percentages of TNF-α producing T lymphocytes at admission were independently associated with poorer outcomes at 90 days. However, we did not detect T cell responses to neural-antigen stimulation 90 days post-stroke. Altogether the results suggest acute T cell priming in the periphery in acute stroke, T cell trafficking from the CSF to the ischemic brain tissue, and the existence of active mechanisms preventing autoreactivity.

Keywords: T-cell response; antigen-specificity; brain autopsy; brain infiltration; cytokine production; stroke.


Figures

Figure 1
Figure 1
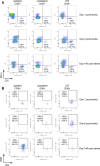
Activated T cells in human stroke brain tissue at the chronic phase. Post-mortem brain tissue was obtained from three stroke patients FC3, FC1, and FC2 deceased 1, 6, and 140 days post-stroke, respectively (Table 2). (A) Dot-plots of flow-cytometry data of the brain ipsilesional and contralateral area and the cerebrospinal fluid (CSF) 3rd ventricle. CD3+ SSClow lymphocytes are identified. CD3+ lymphocytes were gated from previous live single CD45+ cells showed in Supplementary Figure S1B. (B) Analysis of CD3+ SSClow cells for the expression of the lymphocyte activation marker CD69 showed initial activation in the CSF followed by later T cell activation in the ischemic brain hemisphere.
Figure 2
Figure 2
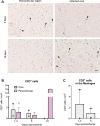
T cell counts after immunohistochemistry in brain samples of six ischemic stroke cases deceased between day 1 and day 18 post-stroke. Features of the patients (IHC1 to IHC6) are shown in Table 2. (A) CD3+ T cells (dark brown) in paraffin brain sections counterstained with hematoxylin in the core of the lesion and at the periventricular region for patients deceased at day 5 and day 18 post-stroke. Arrowheads indicate CD3+ cells. Scale bar: 25 μm. (B) For illustration of quantification, patients were grouped according to death 1–3 days post-stroke (n = 3), 5 days post-stroke (n = 2), and 18 days post-stroke (n = 1). (C) CD3+ cell counts in the meninges of patients where this tissue was available.
Figure 3
Figure 3
T cell cytokine production after stroke in basal (A) or polyclonal challenge (B). PBMC from healthy donors (H) or stroke patients at different days post-ictus (0, on admission; 5, day 5 post-stroke; 90, day 90 post-stroke) were in vitro cultured for 24 h in basal conditions (A) or stimulated in presence of 50 ng/ml PMA and 1 μM ionomycin (B). Percentages of live CD3+ lymphocytes producing pro-inflammatory cytokines (IFN-γ, TNF-α, or IL-17A) or anti-inflammatory cytokines (IL-10 or IL-4) were quantified based on the strategy of gating shown in Supplementary Figure S3 (one-way analysis of variance, *p < 0.05).
Figure 4
Figure 4
Neural and myelin peptide stimulation of T cells from stroke patients. Cytokine production by T cells co-stimulated with myelin related proteins [MBP peptides (A) or MOG peptides (B)] or neural derived peptides [NR2A (C), or MAP2 (D)]. PBMC from healthy donors (H) or stroke patients at different days post-ictus (0, on admission; 5, day 5 post-stroke; 90, day 90 post-stroke) were in vitro cultured for 24 h in presence of myelin or neural peptides and percentages of live CD3+ lymphocytes producing pro-inflammatory cytokines (IFN-γ, TNF-α, or IL-17A) or anti-inflammatory cytokines (IL-10 or IL-4) was quantified after following the strategy of gating shown in Supplementary Figure S3 (one-way analysis of variance, *p < 0.05).
Figure 5
Figure 5
The net percentage of CD3+ lymphocytes producing TNF-α with MBP peptides stimulation over basal production. (A) Experimental design showing that PBMCs were untreated or exposed to neural peptides for measures of cytokine production at 24 h. (B) The numbers of T cells with basal production of TNF-α were subtracted from the numbers of MPB peptide-stimulated TNF-α producing T cells (Δ%). On admission, stroke patients presented a higher percentage of T cells responding to MBP peptides by producing TNF-α. One-way analysis of variance, *p < 0.05.
Figure 6
Figure 6
Patients with good functional outcomes presented fewer TNF-α producing CD3+ lymphocytes. Stroke patients with a good functional outcome (open circles) at 90 days measured with modified Rankin scale (mRS 0–2) showed a lower percentage of polyclonal activated CD3+ lymphocytes that produced pro-inflammatory cytokine TNF-α compared to stroke patients with poor outcome (filled circles). Filled square, healthy control donors. One-way analysis of variance, *p < 0.05.

References

    1. Albargothy N. J., Johnston D. A., MacGregor-Sharp M., Weller R. O., Verma A., Hawkes C. A., et al. . (2018). Convective influx/glymphatic system: tracers injected into the CSF enter and leave the brain along separate periarterial basement membrane pathways. Acta Neuropathol. 136, 139–152. 10.1007/s00401-018-1862-7 - DOI - PMC - PubMed
    1. Allan R. S., Waithman J., Bedoui S., Jones C. M., Villadangos J. A., Zhan Y., et al. . (2006). Migratory dendritic cells transfer antigen to a lymph node-resident dendritic cell population for efficient ctl priming. Immunity 25, 153–162. 10.1016/j.immuni.2006.04.017 - DOI - PubMed
    1. Anandasabapathy N., Victora G. D., Meredith M., Feder R., Dong B., Kluger C., et al. . (2011). Flt3L controls the development of radiosensitive dendritic cells in the meninges and choroid plexus of the steady-state mouse brain. J. Exp. Med. 208, 1695–1705. 10.1084/jem.20102657 - DOI - PMC - PubMed
    1. Aspelund A., Antila S., Proulx S. T., Karlsen T. V., Karaman S., Detmar M., et al. . (2015). A dural lymphatic vascular system that drains brain interstitial fluid and macromolecules. J. Exp. Med. 212, 991–999. 10.1084/jem.20142290 - DOI - PMC - PubMed
    1. Baruch K., Ron-Harel N., Gal H., Deczkowska A., Shifrut E., Ndifon W., et al. . (2013). CNS-specific immunity at the choroid plexus shifts toward destructive th2 inflammation in brain aging. Proc. Natl. Acad. Sci. U S A 110, 2264–2269. 10.1073/pnas.1211270110 - DOI - PMC - PubMed