. 2020 Jul 3:8:498.
doi: 10.3389/fcell.2020.00498. eCollection 2020.

The Transcriptional Network That Controls Growth Arrest and Macrophage Differentiation in the Human Myeloid Leukemia Cell Line THP-1

Affiliations

The Transcriptional Network That Controls Growth Arrest and Macrophage Differentiation in the Human Myeloid Leukemia Cell Line THP-1

Iveta Gažová et al. Front Cell Dev Biol. .

Abstract

The response of the human acute myeloid leukemia cell line THP-1 to phorbol esters has been widely studied to test candidate leukemia therapies and as a model of cell cycle arrest and monocyte-macrophage differentiation. Here we have employed Cap Analysis of Gene Expression (CAGE) to analyze a dense time course of transcriptional regulation in THP-1 cells treated with phorbol myristate acetate (PMA) over 96 h. PMA treatment greatly reduced the numbers of cells entering S phase and also blocked cells exiting G2/M. The PMA-treated cells became adherent and expression of mature macrophage-specific genes increased progressively over the duration of the time course. Within 1-2 h PMA induced known targets of tumor protein p53 (TP53), notably CDKN1A, followed by gradual down-regulation of cell-cycle associated genes. Also within the first 2 h, PMA induced immediate early genes including transcription factor genes encoding proteins implicated in macrophage differentiation (EGR2, JUN, MAFB) and down-regulated genes for transcription factors involved in immature myeloid cell proliferation (MYB, IRF8, GFI1). The dense time course revealed that the response to PMA was not linear and progressive. Rather, network-based clustering of the time course data highlighted a sequential cascade of transient up- and down-regulated expression of genes encoding feedback regulators, as well as transcription factors associated with macrophage differentiation and their inferred target genes. CAGE also identified known and candidate novel enhancers expressed in THP-1 cells and many novel inducible genes that currently lack functional annotation and/or had no previously known function in macrophages. The time course is available on the ZENBU platform allowing comparison to FANTOM4 and FANTOM5 data.

Keywords: THP-1 cells; cell cycle; differentiation; macrophage; monocyte; p53; transcriptome.


Figures

FIGURE 1
FIGURE 1
Analysis of the cell cycle in THP-1 cells. (A) Prior to PMA stimulation; (B) 10 h post PMA stimulation; (C) 24 h post PMA stimulation; (D) 30 h post PMA stimulation; (E) 48 h post PMA stimulation. Data were analyzed using FlowJo with the Watson (pragmatic) model. Line graph shows the number of cells in each phase, taken from FlowJo software; X axis shows the propidium iodide fluorescence and Y axis shows cell count. Arrow in (B) highlights the immediate rapid decline in S phase entry in response to PMA. Pie chart shows the proportion of cells in each phase. Purple – G1 phase; orange – S phase; green – G2 phase.
FIGURE 2
FIGURE 2
Gene expression during differentiation of THP-1 cells. X axis shows time points from 0 to 96 h after administration of PMA; Y axis shows average expression by CAGE analysis in tags per million (TPM). (A) Macrophage differentiation marker genes CD14, ICAM1, ITGAM, APOE, CSF1R, CD36, SPP1, CSF1. (B) Transcription factor genes MYB (two CTSS), MYBL2, E2F1, GFI1 (four CTSS), SPI1. Multiple CTSS associated with the same gene are shown by lighter colored sections of the bars. (C) Inducible cell cycle repressor genes CCNE2, PCNA, BUB1, AURKA, CDK4, CCNB1, CDKN1A. (D) Color code for time points on the X axis.
FIGURE 3
FIGURE 3
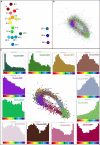
Network analysis of patterns of gene expression throughout differentiation of THP-1 cells. (A) Sample-to-sample analysis. Each node (sphere) represents the average of replicates at a time point, colored as shown in Figure 2D, indicating hours after addition of PMA. Edges between nodes show correlations of ≥0.95. (B) Gene-to-gene analysis showing the main element of the full network. Nodes represent genes (TSS) and the edges between them represent correlations of ≥0.85. MCL clustering was performed at an inflation value of 1.7 and nodes are colored according to their membership in a cluster. (C) Clusters of nodes that are differentially expressed across the time course. Orientation is the same as (B) but edges and other clusters have been removed for ease of visualization. Color of nodes shows the cluster to which nodes were allocated; histograms (colored the same as the nodes in the cluster) show the average expression patterns of the genes within the clusters. Color code for the X axis is as for Figure 2.
FIGURE 4
FIGURE 4
Network analysis of cell cycle genes. (A) Sample-to-sample analysis of Cluster002, containing genes associated with the cell cycle and proliferation. Nodes show averaged values for each time point and edges show correlations of ≥0.90 between nodes. Hours after addition of PMA are indicated. (B) Expression profiles of subclusters generated by gene-to-gene analysis of Cluster002. Averaged values for each time point. Correlation coefficient was ≥0.95 and MCL inflation value was 1.7. (C) Gene-to-gene analysis of 561 curated cell cycle genes (617 TSS) (Giotti et al., 2018) expressed during THP-1 differentiation. Nodes show averaged values for each gene and edges show correlations of ≥0.75 between them. MCL inflation value was 1.7. Histograms show the averaged expression profile for each cluster. Color code for the X axis is as for Figure 2.
FIGURE 5
FIGURE 5
Expression of transcription factors during THP-1 differentiation. (A) Sample-to-sample analysis of 647 curated transcription factors (796 TSS) (Lambert et al., 2018) expressed during THP-1 differentiation. Edges show correlations of ≥0.61. Hours after addition of PMA are indicated. (B) Expression profiles of clusters generated by gene-to-gene analysis of curated transcription factors. Averaged values for each time point. Correlation coefficient was of ≥0.85 and MCL inflation value was 1.7. (C) Network analysis of transcription factor motif activity. Histograms showing average activity (as detected by MARA) of transcription factor motifs, clustered at a correlation coefficient of ≥0.60 and MCL inflation value of 1.7. Color code for the X axis is as for Figure 2.
FIGURE 6
FIGURE 6
Promoter and enhancer activity of BCL6 and TPRG1. Y axis shows expression levels in TPM; negative value (gray bars) indicates expression from the reverse strand. X axis shows the time points (hours after administration of PMA; color code as shown in Figure 2).
FIGURE 7
FIGURE 7
Expression of MYB intron 9 putative enhancer during THP-1 differentiation. (A) Screenshot of Zenbu browser showing MYB intron 9 putative enhancer (circled in red). (B) Expression of two MYB promoters and the putative intron 9 enhancer. Y axis shows expression levels in TPM; negative value (gray bars in panel on right) indicates expression from the reverse strand. X axis shows the time points (hours after administration of PMA; color code as shown in Figure 2).

Similar articles

Cited by

References

    1. Akashi M., Osawa Y., Koeffler H. P., Hachiya M. (1999). p21WAF1 expression by an activator of protein kinase C is regulated mainly at the post-transcriptional level in cells lacking p53: important role of RNA stabilization. Biochem. J. 337 607–616. 10.1042/bj3370607 - DOI - PMC - PubMed
    1. Andersson R., Gebhard C., Miguel-Escalada I., Hoof I., Bornholdt J., Boyd M., et al. (2014). An atlas of active enhancers across human cell types and tissues. Nature 507 455–461. 10.1038/nature12787 - DOI - PMC - PubMed
    1. Antonini D., Dentice M., Mahtani P., De Rosa L., Della Gatta G., Mandinova A., et al. (2008). Tprg, a gene predominantly expressed in skin, is a direct target of the transcription factor p63. J. Invest. Dermatol. 128 1676–1685. 10.1038/jid.2008.12 - DOI - PubMed
    1. Arner E., Daub C. O., Vitting-Seerup K., Andersson R., Lilje B., Drablos F., et al. (2015). Transcribed enhancers lead waves of coordinated transcription in transitioning mammalian cells. Science 347 1010–1014. 10.1126/science.1259418 - DOI - PMC - PubMed
    1. Baillie J. K., Arner E., Daub C., De Hoon M., Itoh M., Kawaji H., et al. (2017). Analysis of the human monocyte-derived macrophage transcriptome and response to lipopolysaccharide provides new insights into genetic aetiology of inflammatory bowel disease. PLoS Genet. 13:e1006641. 10.1371/journal.pgen.1006641 - DOI - PMC - PubMed