

OPTIK: a database for understanding catchment areas to guide mobilization of cancer center assets
- PMID: 32719846
- PMCID: PMC7491207
- DOI: 10.1093/database/baaa054
OPTIK: a database for understanding catchment areas to guide mobilization of cancer center assets
Abstract
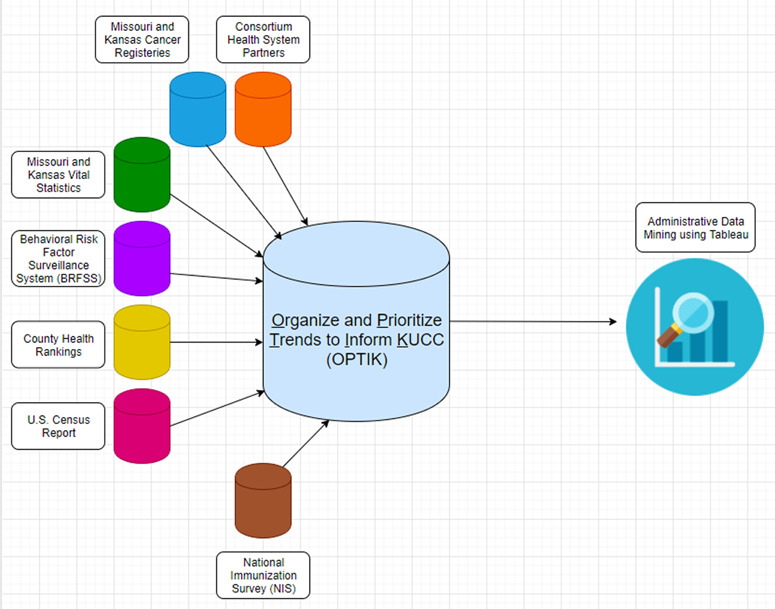
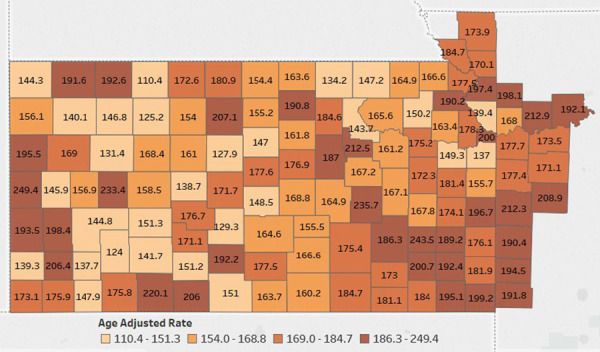
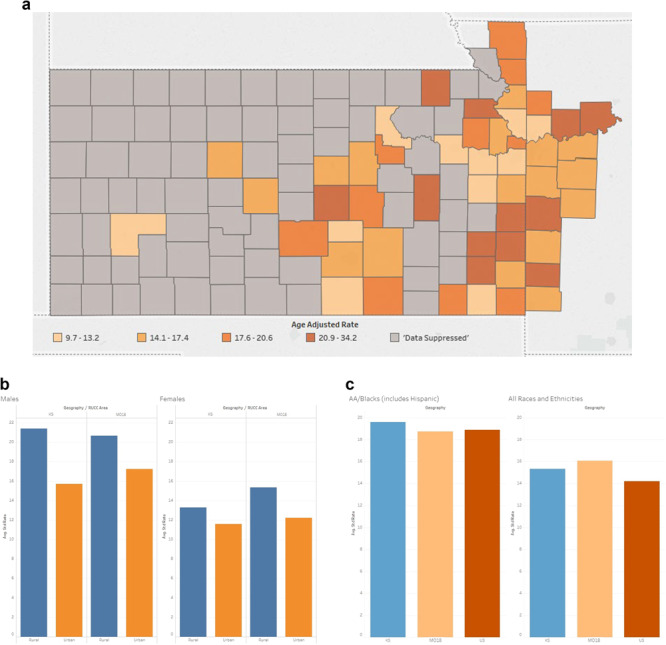
An increasingly diversified demographic landscape in rural and urban America warrants the attention of The University of Kansas Cancer Center (KU Cancer Center) researchers, clinicians, outreach staff and administrators as the institution assesses ways to reach its expansive, bi-state catchment area. Within the counties of the KU Cancer Center catchment area, patient level and public health data are available and categorized by varying geographic regional boundaries. Multiple data sources and different data collection processes complicate summarizing catchment area data. A curated data warehouse that retrieves and structures the data, with a common denominator, can support meaningful use of the data in a standard and consistent format. The KU Cancer Center built a data warehouse to Organize and Prioritize Trends to Inform KU Cancer Center (OPTIK), which functions to streamline the process of synthesizing data regarding Kansas and Missouri demographics, cancer risk factors and incidence and mortality rates. OPTIK standardizes these diverse data sources to enable analyses of the cancer burden at local, regional and national levels while upholding a strict standard of patient privacy. The OPTIK database enables researchers to use available data and create heat maps and other visualizations to aid in funding proposals, presentations and research activities. Furthermore, using knowledge provided by OPTIK, the KU Cancer Center is able to prioritize action items for research and outreach and more effectively communicate the impact of those efforts.
© The Author(s) 2020. Published by Oxford University Press.
Figures
References
-
- Stoto M.A., Davis M.V. and Atkins A. (2019) Making better use of population health data for community health needs assessments. EGEMS (Wash DC), 7, 44 [accessed]. https://egems.academyhealth.org/articles/10.5334/egems.305/ - DOI - PMC - PubMed
-
- Velentgas P., Dreyer N.A., Nourjah P. et al. ((2013)) Developing a protocol for observational comparative effectiveness research: a user's guide In: Rockville (md): Agency for healthcare research and quality (us); 2013 jan. Agency for Healthcare Research and Quality (US), Rockville (MD) [accessed]. https://effectivehealthcare.ahrq.gov/products/observational-cer-protocol... - PubMed
-
- Tai C.G. and Hiatt R.A. (2017) The population burden of cancer: research driven by the catchment area of a cancer center. Epidemiol. Rev., 39, 108–122. - PubMed
Publication types
MeSH terms
Grants and funding
LinkOut - more resources
Full Text Sources
Medical
