

Comparative Study
doi: 10.1001/jamanetworkopen.2020.16933.
Comparison of Weighted and Unweighted Population Data to Assess Inequities in Coronavirus Disease 2019 Deaths by Race/Ethnicity Reported by the US Centers for Disease Control and Prevention
Affiliations
- PMID: 32721026
- PMCID: PMC7388022
- DOI: 10.1001/jamanetworkopen.2020.16933
Item in Clipboard
Comparative Study
Comparison of Weighted and Unweighted Population Data to Assess Inequities in Coronavirus Disease 2019 Deaths by Race/Ethnicity Reported by the US Centers for Disease Control and Prevention
JAMA Netw Open.
.
Erratum in
-
Error in Figure.JAMA Netw Open. 2020 Aug 3;3(8):e2019768. doi: 10.1001/jamanetworkopen.2020.19768. JAMA Netw Open. 2020. PMID: 32833012 Free PMC article. No abstract available.
Abstract
This cross-sectional study compares the use of weighted and unweighted population data to assess inequities in coronavirus disease 2019 (COVID-19) deaths by race/ethnicity as reported by the US Centers for Disease Control and Prevention (CDC).
Conflict of interest statement
Figures
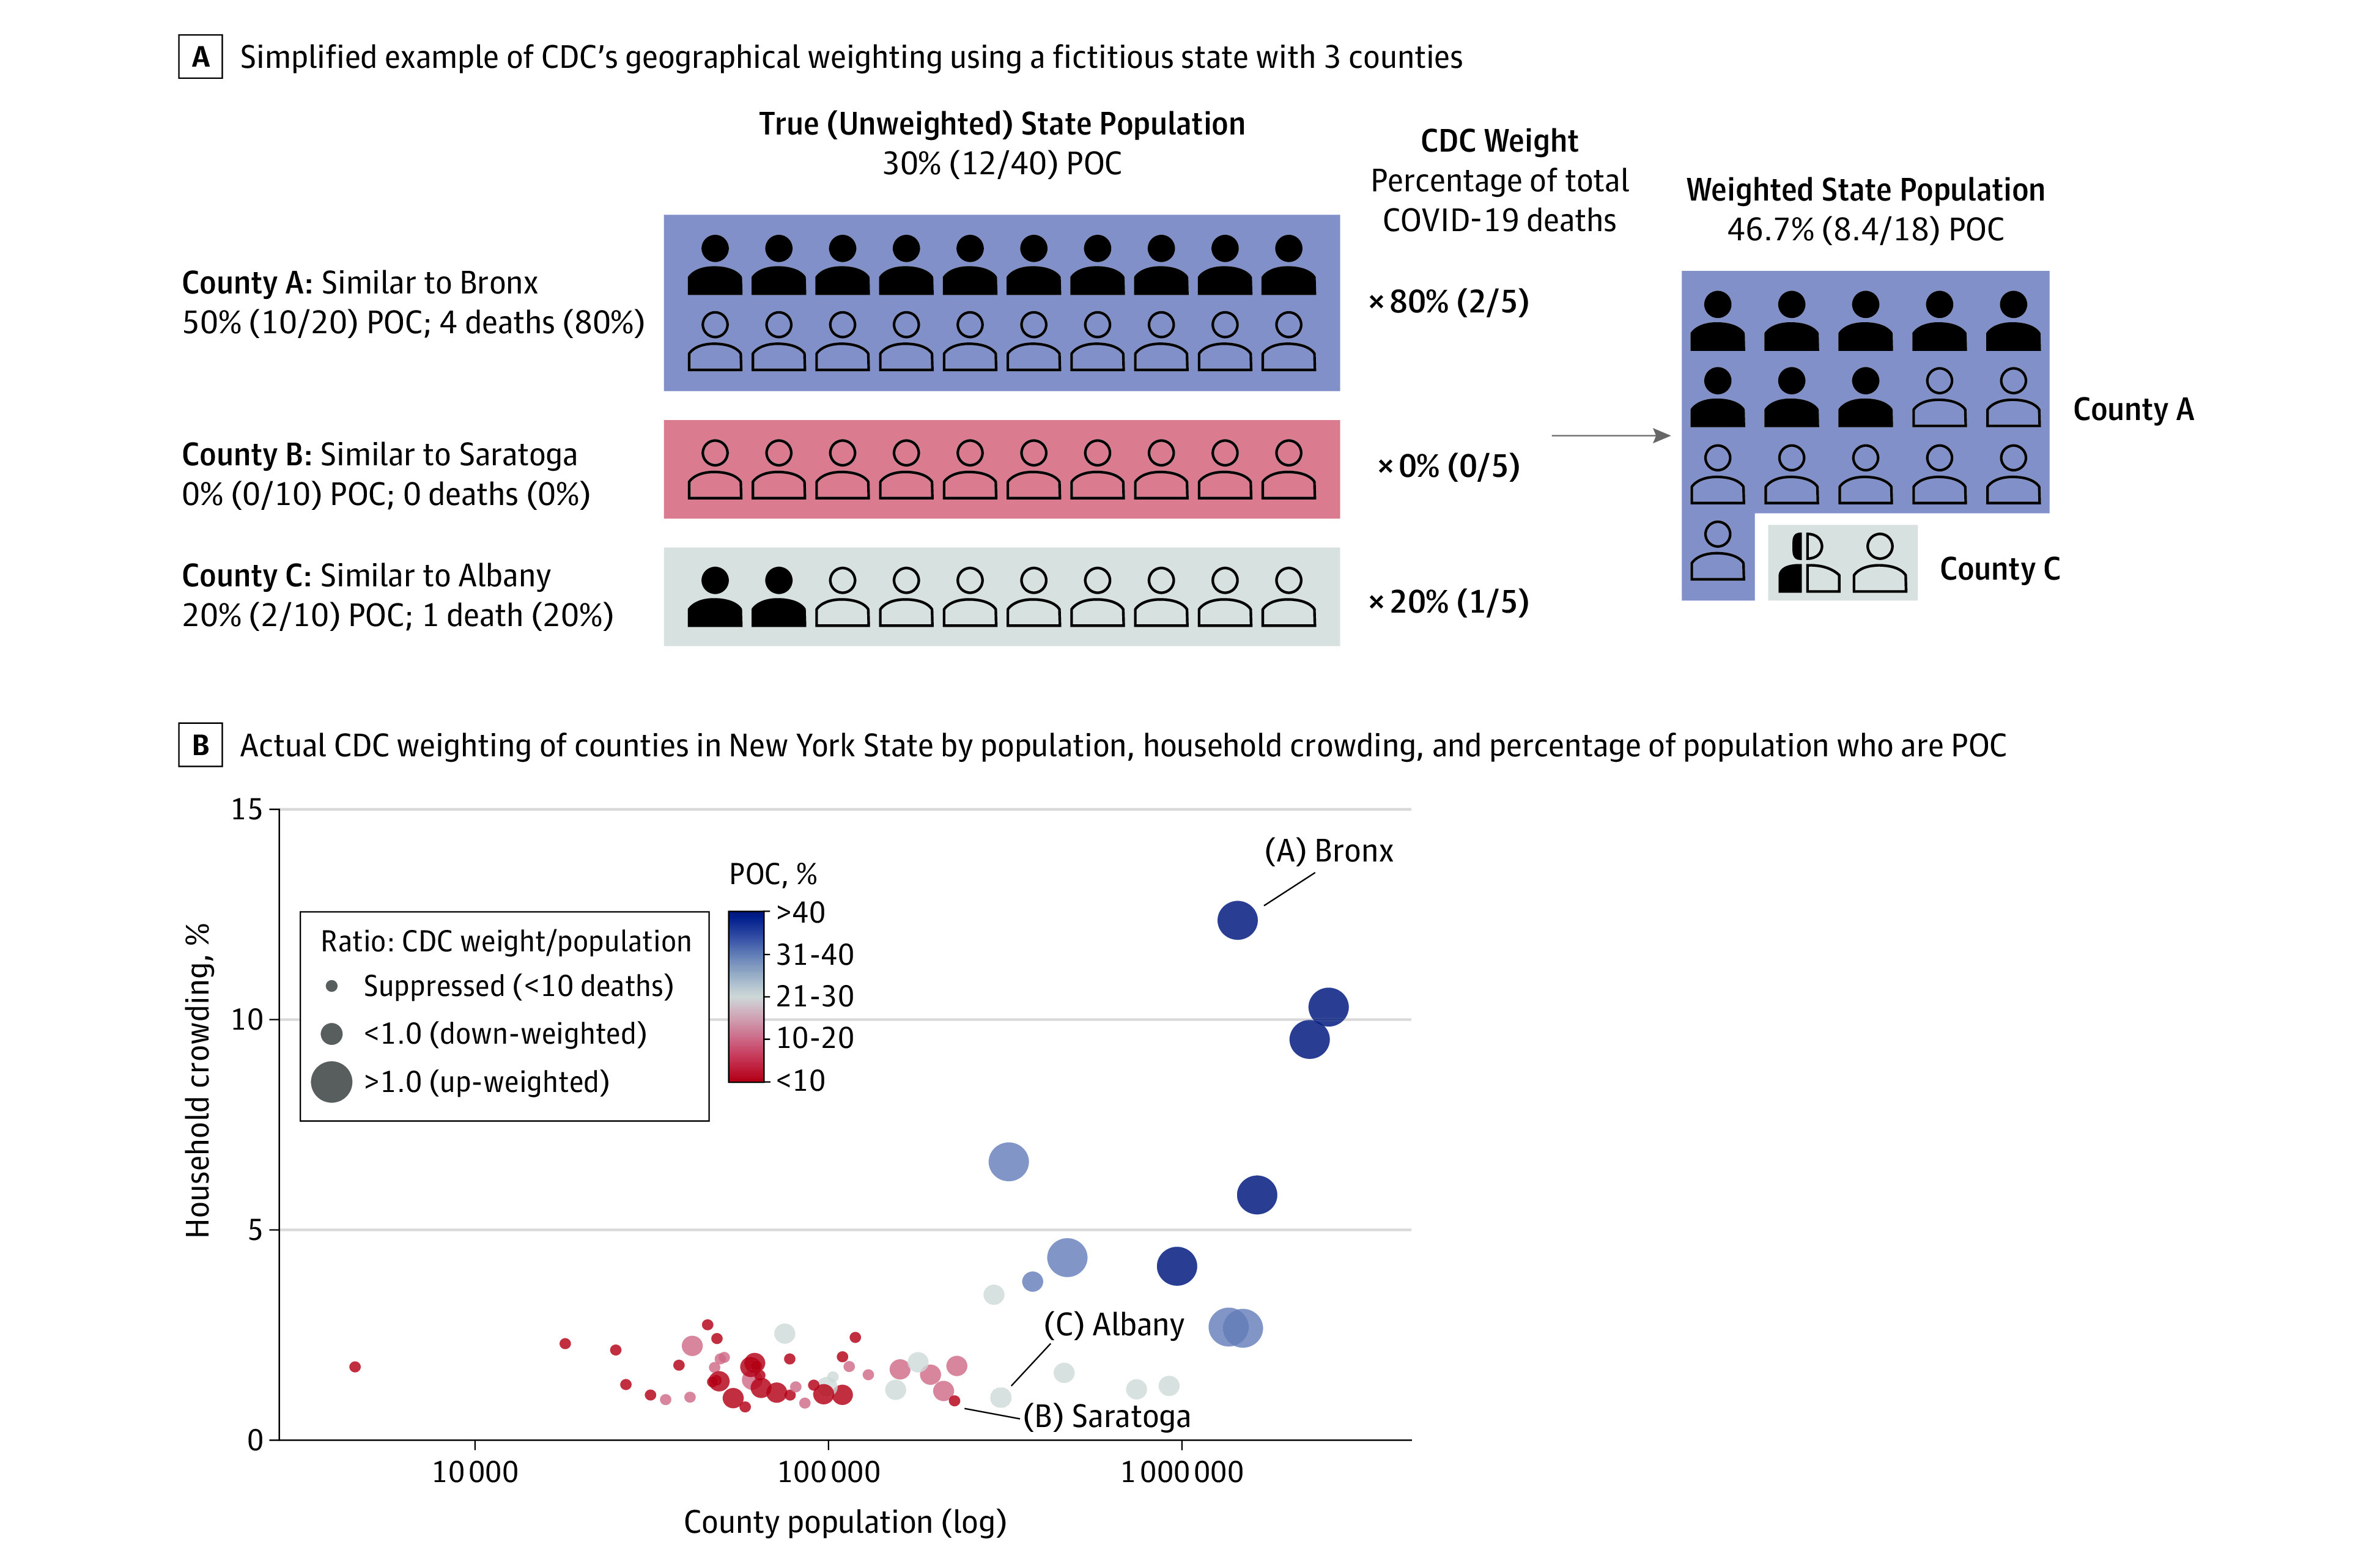
The figure shows examples of CDC geographical population weighting using a fictitious state with 3 counties (A) and actual CDC weighting of counties in New York State (B) by population, household crowding, and percentage of county population who are people of color (POC). The impact of the CDC’s method of geographical reweighting is demonstrated by juxtaposing the hypothetical example in panel A with actual county population data in panel B. By up-weighting counties such as county A (eg, Bronx), down-weighting counties such as county C (eg, Albany), and excluding counties such as county B (eg, Saratoga), the CDC inflates the proportion of residents of color in the weighted population, making their risk of death appear lower, while deflating the proportion of White residents, making their risk of death appear greater.
References
-
- Krieger N, Gonsalves G, Bassett MT, Hanage W, Krumholz HM The fierce urgency of now: closing glaring gaps in US surveillance data on COVID-19. Health Affairs Blog. Published April 14, 2020. Accessed July 7, 2020. doi: 10.1377/hblog20200414.238084 - DOI
-
- National Center for Health Statistics Provisional death counts for coronavirus disease (COVID-19). Published May 5, 2020. Accessed May 8, 2020. https://www.cdc.gov/nchs/nvss/vsrr/covid19/tech_notes.htm
-
- Sewell AA. The racism-race reification process: a mesolevel political economic framework for understanding racial health disparities. Sociol Race Ethnicity. 2016;2(4):402-432. doi: 10.1177/2332649215626936 - DOI
