. 2020 Aug 21;23(8):101368.
doi: 10.1016/j.isci.2020.101368. Epub 2020 Jul 15.

Succession of Bifidobacterium longum Strains in Response to a Changing Early Life Nutritional Environment Reveals Dietary Substrate Adaptations

Affiliations

Succession of Bifidobacterium longum Strains in Response to a Changing Early Life Nutritional Environment Reveals Dietary Substrate Adaptations

Magdalena Kujawska et al. iScience. .

Abstract

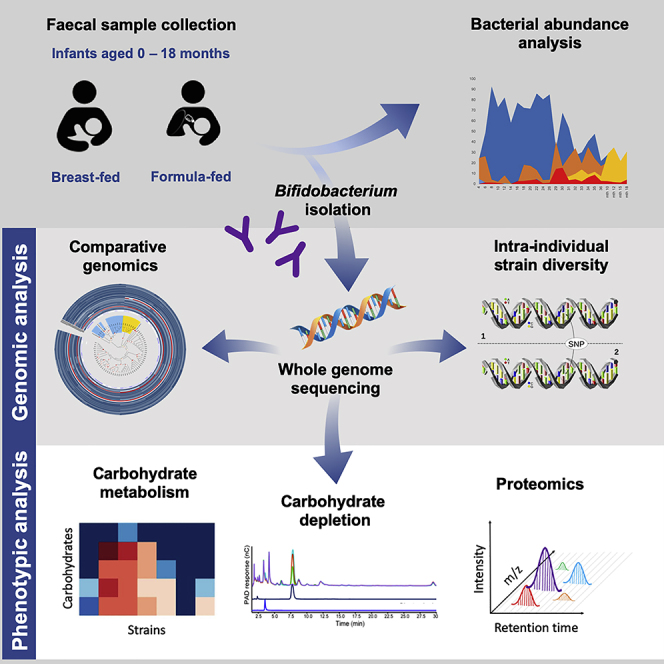
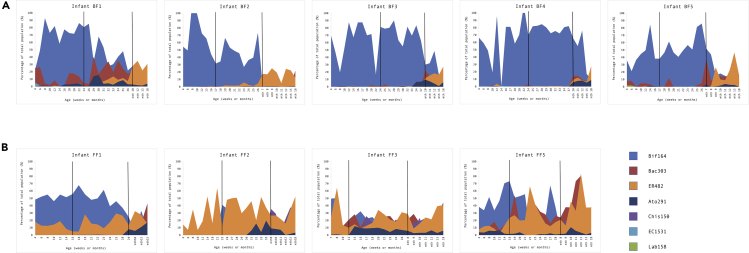
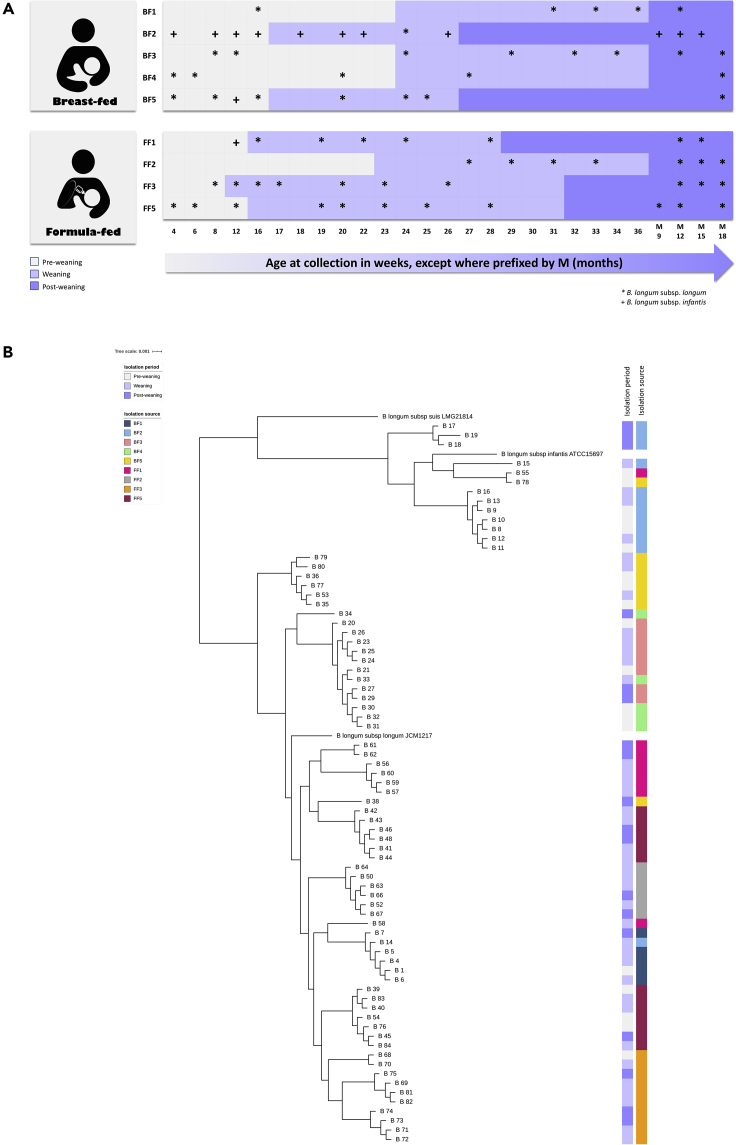
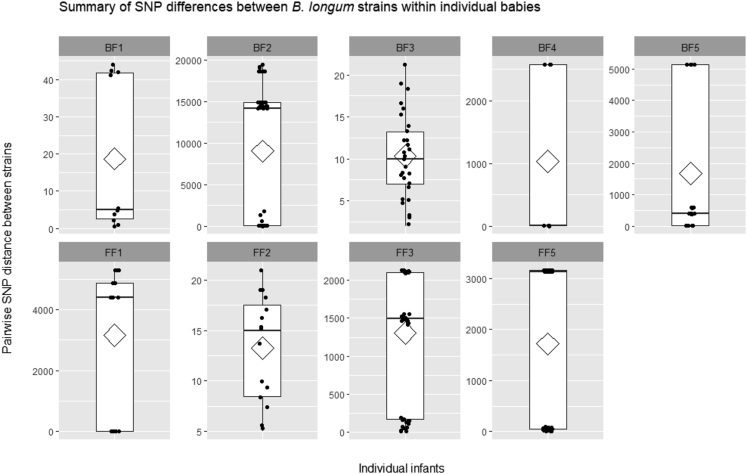
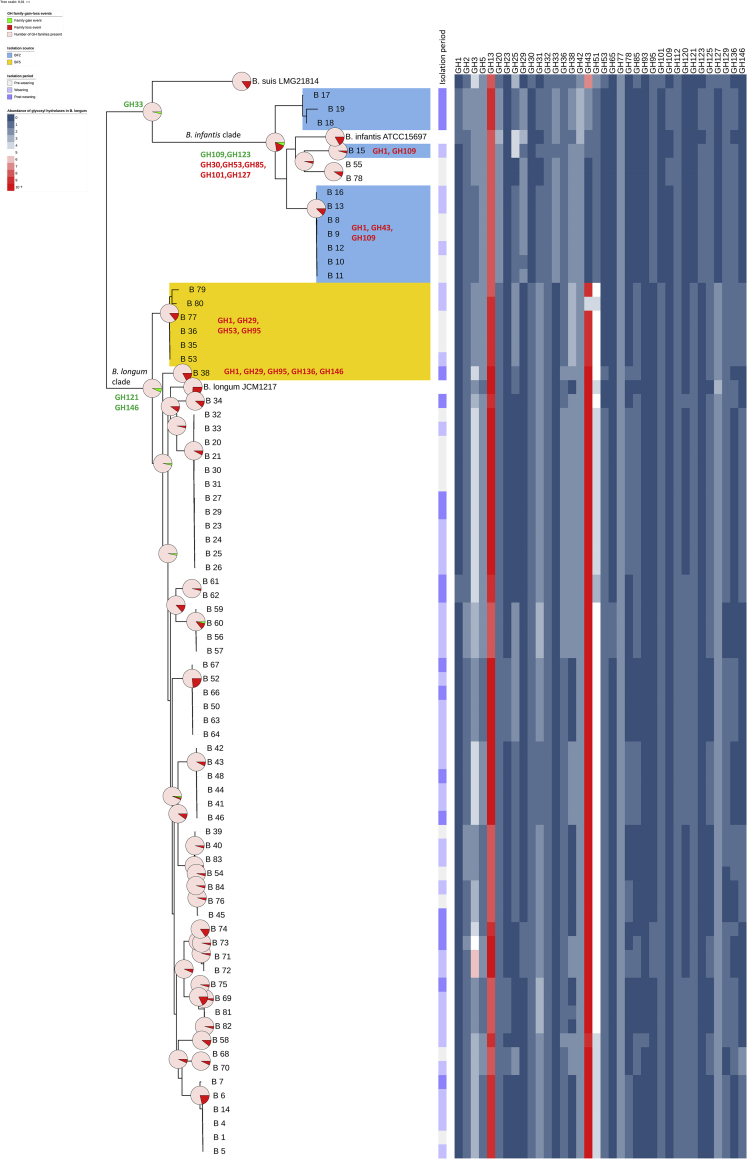
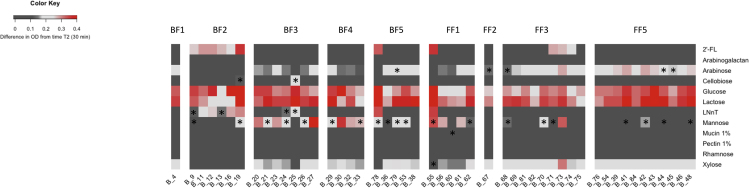
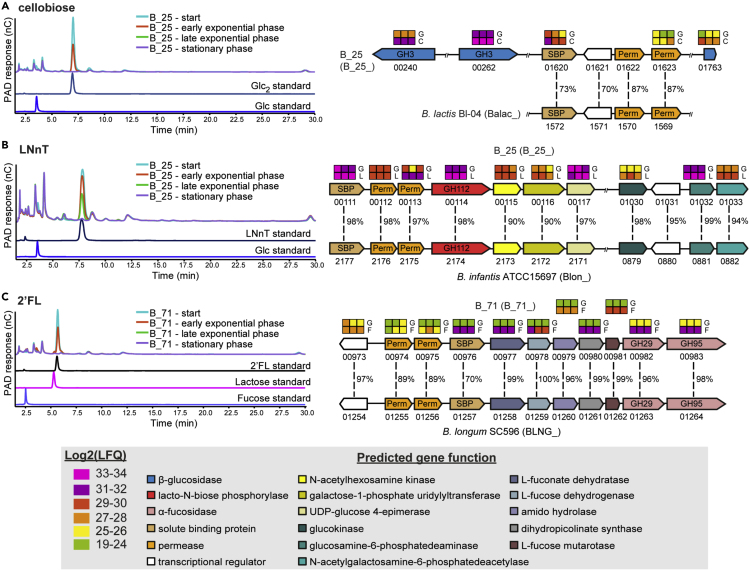
Diet-microbe interactions play a crucial role in modulation of the early life microbiota and infant health. Bifidobacterium dominates the breast-fed infant gut and may persist in individuals during transition from a milk-based to a more diversified diet. Here, we investigated adaptation of Bifidobacterium longum to the changing nutritional environment. Genomic characterization of 75 strains isolated from nine either exclusively breast- or formula-fed (pre-weaning) infants in their first 18 months revealed subspecies- and strain-specific intra-individual genomic diversity with respect to carbohydrate metabolism, which corresponded to different dietary stages. Complementary phenotypic studies indicated strain-specific differences in utilization of human milk oligosaccharides and plant carbohydrates, whereas proteomic profiling identified gene clusters involved in metabolism of selected carbohydrates. Our results indicate a strong link between infant diet and B. longum diversity and provide additional insights into possible competitive advantage mechanisms of this Bifidobacterium species and its persistence in a single host.

Keywords: Dietary Supplement; Microbiology; Microbiome.


Conflict of interest statement

Declaration of Interests The authors declare no competing interests.

Figures

None
Graphical abstract
Figure 1
Figure 1
Proportional Representation of Bacterial Populations in the Fecal Microbiota of Infants Based on FISH analysis in (A) breast-fed and (B) formula-fed infants. Numbers are expressed as percentage of the total bacterial population obtained using DAPI. The vertical solid black lines mark the different dietary phases in each infant (pre-weaning, weaning, and post-weaning). Oligonucleotide probes used to determine bacterial populations: Bif164—most Bifidobacterium species and Parascardovia denticolens; Bac303—most members of the genus Bacteroides, some Parabacteroides and Prevotella species, Paraprevotella, Xylanibacter, Barnesiella species, and Odoribacter splanchnicus; ER482—most members of Clostridium cluster XIVa; Ato291—Cryptobacterium curtum, Gordonibacter pamelaeae, Paraeggerthella hongkongensis, all Eggerthella, Collinsella, Olsenella and Atopobium species; Chis150—most members of Clostridium cluster I, all members of Clostridium cluster II; EC1531—Escherichia coli; Lab158—all Oenococcus, Vagococcus, Melissococcus, Tetragenococcus, Enterococcus, Catellicoccus, Paralactobacillus, Pediococcus and Lactococcus species, most Lactobacillus, Weissella, and Leuconostoc species. See also Table S1.
Figure 2
Figure 2
Identification and Relatedness of B. longum Strains (A) Sampling scheme and strain identification within individual breast-fed (BF1-BF5) and formula-fed (FF1-FF3 and FF5) infants based on average nucleotide identity values (ANI). The three levels of shading mark different dietary phases: pre-weaning, weaning, and post-weaning. (B) Relatedness of B. longum strains based on core proteins. Colored strips represent isolation period (pre-weaning, weaning, and post-weaning) and isolation source (individual infants), respectively. See also Tables S2, Table S3, and S4.
Figure 3
Figure 3
Pairwise SNP Distances between Blongum Strains of the Same Subspecies within Individual Infants Individual points show data distribution, diamonds indicate the group mean, box plots show group median and interquartile range. See also Table S6.
Figure 4
Figure 4
Gene-Loss Events and Abundance of GH Families within B. longum Subspecies Pie charts superimposed on the whole genome SNP tree represent predicted GH family gain-loss events within B. longum and B. infantis lineages. Due to the size of the tree, examples of detailed gain loss events have been provided for main lineages, as well as baby BF2 (strains highlighted with light blue) and BF5 (strains highlighted with yellow). Heatmap represents abundance of specific GH families predicted in analyzed B. longum strains. See also Tables S8 and S9.
Figure 5
Figure 5
Growth Performance of B. longum Strains on Different Carbon Sources Heatmap displays the difference in average growth of triplicates between T2 (30 min) and Tend (48 hr). Moderate growth is considered above 0.15 difference in OD from time T2, high growth above 0.25 difference in OD from time T2. Asterisks represent strains for which inconsistent growth was recorded (difference in OD of at least 0.15 between any of the duplicates in the triplicate experiment). See also Table S12.
Figure 6
Figure 6
Carbohydrate Uptake Analysis and Proteomics of B. longum Strains B_25 and B_71 HPAEC-PAD traces showing mono-, di-, and oligo-saccharides detected in the supernatant of either B_25 or B_71 single cultures during growth in mMRS supplemented with (A) cellobiose; (B) LNnT; (C) 2′-FL. The data are representative of biological triplicates. Abbreviations: LNnT, Lacto-N-neotetraose; Glc, glucose; Glc2, cellobiose; 2′-FL, 2′-fucosyllactose. Panel on the right shows (A) cellobiose; (B) LNnT; (C) 2′-FL utilization clusters in B_25 and B_71 and proteomic detection of the corresponding proteins during growth on HMOs. Heatmaps above genes show the LFQ detection levels for the corresponding proteins in triplicates grown on glucose (G); cellobiose (C); LNnT (L); and 2′-FL (F). Numbers between genes indicate percent identity between corresponding genes in homologous gene clusters relative to strains B_25 and B_71. Numbers below each gene show the locus tag in the corresponding genome. Locus tag numbers are abbreviated with the last numbers after the second hyphen (for example B_25_XXXXX). The locus tag prefix for each strain is indicated in parenthesis beside the organism name. See also Tables S13 and S14.

References

    1. Ahmed S., Luis A.S., Bras J.L., Ghosh A., Gautam S., Gupta M.N., Fontes C.M., Goyal A. A novel alpha-L-arabinofuranosidase of family 43 glycoside hydrolase (Ct43Araf) from Clostridium thermocellum. PLoS One. 2013;8:e73575. - PMC - PubMed
    1. Andersen J.M., Barrangou R., Abou Hachem M., Lahtinen S.J., Goh Y.J., Svensson B., Klaenhammer T.R. Transcriptional analysis of oligosaccharide utilization by Bifidobacterium lactis Bl-04. BMC Genomics. 2013;14:312. - PMC - PubMed
    1. Arboleya S., Bottacini F., O’connell-Motherway M., Ryan C.A., Ross R.P., Van Sinderen D., Stanton C. Gene-trait matching across the Bifidobacterium longum pan-genome reveals considerable diversity in carbohydrate catabolism among human infant strains. BMC Genomics. 2018;19:33. - PMC - PubMed
    1. Asnicar F., Manara S., Zolfo M., Truong D.T., Scholz M., Armanini F., Ferretti P., Gorfer V., Pedrotti A., Tett A., Segata N. Studying vertical microbiome transmission from mothers to infants by strain-level metagenomic profiling. mSystems. 2017;2 e00164–16. - PMC - PubMed
    1. Backhed F., Roswall J., Peng Y., Feng Q., Jia H., Kovatcheva-Datchary P., Li Y., Xia Y., Xie H., Zhong H. Dynamics and stabilization of the human gut microbiome during the first year of life. Cell Host Microbe. 2015;17:852. - PubMed

LinkOut - more resources