

On the True Number of COVID-19 Infections: Effect of Sensitivity, Specificity and Number of Tests on Prevalence Ratio Estimation
- PMID: 32722110
- PMCID: PMC7432803
- DOI: 10.3390/ijerph17155328
On the True Number of COVID-19 Infections: Effect of Sensitivity, Specificity and Number of Tests on Prevalence Ratio Estimation
Abstract
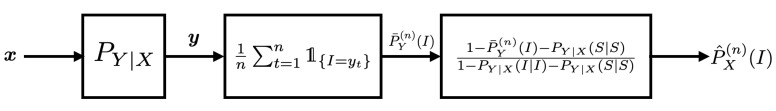
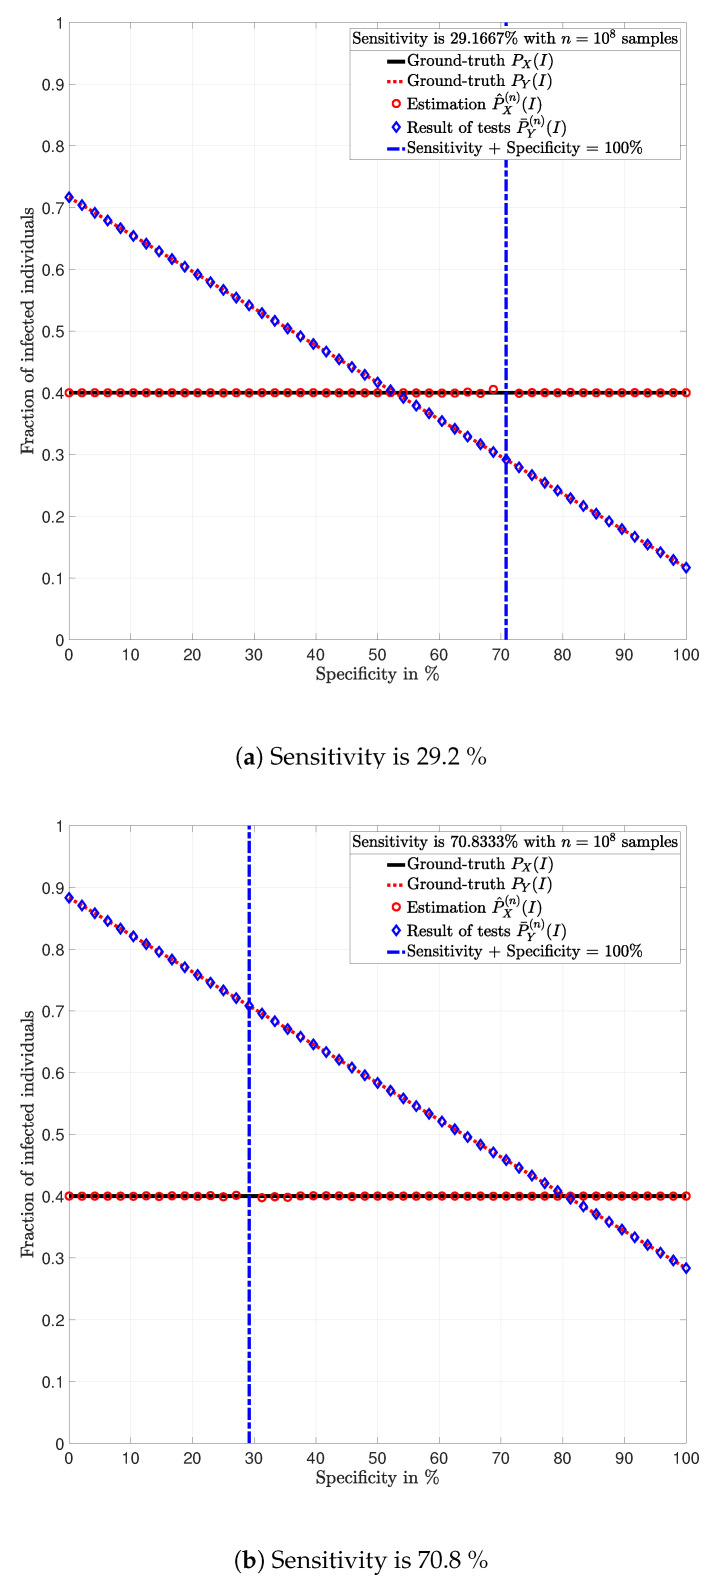
In this paper, a formula for estimating the prevalence ratio of a disease in a population that is tested with imperfect tests is given. The formula is in terms of the fraction of positive test results and test parameters, i.e., probability of true positives (sensitivity) and the probability of true negatives (specificity). The motivation of this work arises in the context of the COVID-19 pandemic in which estimating the number of infected individuals depends on the sensitivity and specificity of the tests. In this context, it is shown that approximating the prevalence ratio by the ratio between the number of positive tests and the total number of tested individuals leads to dramatically high estimation errors, and thus, unadapted public health policies. The relevance of estimating the prevalence ratio using the formula presented in this work is that precision increases with the number of tests. Two conclusions are drawn from this work. First, in order to ensure that a reliable estimation is achieved with a finite number of tests, testing campaigns must be implemented with tests for which the sum of the sensitivity and the specificity is sufficiently different than one. Second, the key parameter for reducing the estimation error is the number of tests. For a large number of tests, as long as the sum of the sensitivity and specificity is different than one, the exact values of these parameters have very little impact on the estimation error.
Keywords: Covid-19; SARS-CoV-2; cross-sectional studies; false positive and false negative probabilities; molecular, serological and medical imaging diagnostics; number of infections; policy-making and testing campaigns; prevalence ratio; sensitivity and specificity.
Conflict of interest statement
The authors declare no conflict of interest.
Figures


References
-
- Brauer F., Castillo-Chávez C., Feng Z. Mathematical Models in Epidemiology. 1st ed. Springer; New York, NY, USA: 2019.
-
- Rothman K.J., Greenland S. Modern Epidemiology. 3rd ed. Lippincott Williams & Wilkins; Philadelphia, PA, USA: 2008.
-
- Haute Autorité de Santé . Place des Tests Sérologiques Rapides (TDR, TROD, Autotests) dans la stratégie de Prise en Charge de la Maladie COVID—19. Haute Autorité de Santé (HAS); Saint-Denis La Plaine, France: 2020. Technical Report.
MeSH terms
LinkOut - more resources
Full Text Sources
Miscellaneous
