Review
. 2020 Jul 24;25(15):3374.
doi: 10.3390/molecules25153374.

Fatty Acid Allosteric Regulation of C-H Activation in Plant and Animal Lipoxygenases

Affiliations
Review

Fatty Acid Allosteric Regulation of C-H Activation in Plant and Animal Lipoxygenases

Adam R Offenbacher et al. Molecules. .

Abstract

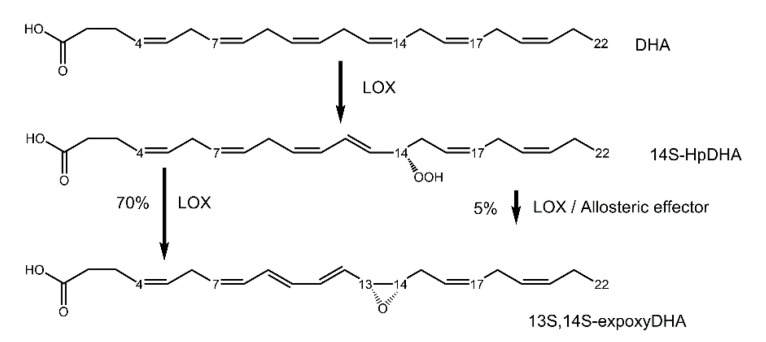
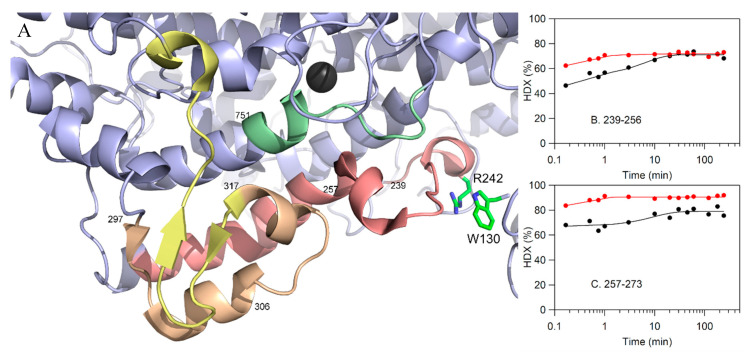
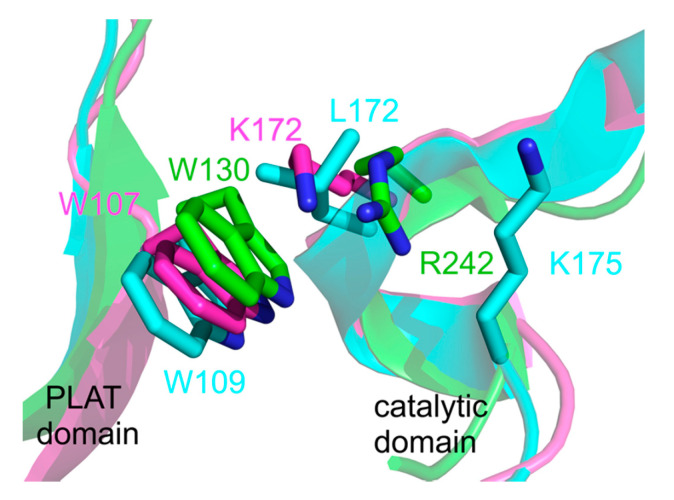
Lipoxygenases (LOXs) catalyze the (per) oxidation of fatty acids that serve as important mediators for cell signaling and inflammation. These reactions are initiated by a C-H activation step that is allosterically regulated in plant and animal enzymes. LOXs from higher eukaryotes are equipped with an N-terminal PLAT (Polycystin-1, Lipoxygenase, Alpha-Toxin) domain that has been implicated to bind to small molecule allosteric effectors, which in turn modulate substrate specificity and the rate-limiting steps of catalysis. Herein, the kinetic and structural evidence that describes the allosteric regulation of plant and animal lipoxygenase chemistry by fatty acids and their derivatives are summarized.

Keywords: C-H activation; hydrogen tunneling; kinetic isotope effects; protein allostery; substrate selectivity.


Conflict of interest statement

The authors declare no conflict of interest.

Figures

Figure 1
Figure 1
Structures of select substrates (green box) of lipoxygenase (LOX) and two relevant allosteric effectors (black box) as discussed in the text.
Figure 2
Figure 2
Structural comparison of SLO-1 (A), h15-LOX-2 (B), and h5-LOX (C). The catalytic domains are colored blue, green, and pink, respectively; the catalytic metal is represented as a black sphere. For both plants and animals, the N-terminal PLAT (Polycystin-1, Lipoxygenase, Alpha-Toxin) domain is colored in wheat. The PDB identification numbers of the structure are listed for reference. The arched helix and helix 2, discussed in text, are colored dark blue (A), split pea (B), and magenta (C), and reproduced in (D). In panel (D), the image was rotated 30° relative to (AC). The position of the invariant leucine is represented in yellow spheres. For reference, the positioning of the substrate mimic solved in h15-LOX-2 is represented as green sticks. Panels (E,F) show the coordination environment surrounding the iron water (black and red sphere, respectively) cofactor for (E) SLO-1 and (F) h15-LOX-2 active site structures. The hydrogen-bonded networks are represented as dashed lines. The SLO-1 substrate, LA (green), was modeled into the active site using electron nuclear double resonance (ENDOR) distance restraints [21]. The h15-LOX-2 structure was solved with a substrate mimic, octyltetraethylene glycol ether (C8E). There are no structures of full length h12-LOX or h15-LOX-1.
Scheme 1
Scheme 1
General mechanism of fatty acid oxidation by iron LOXs. The reaction is initiated by a hydrogen atom abstraction at carbon n and molecular oxygen insertion occurs antarafacially either at the n + 2 or n − 2 carbon. In the case of SLO-1, the pro-S hydrogen (red) is abstracted from carbon-11 (n) of linoleic acid (LA), leading to oxygen insertion at (predominantly) the n + 2 carbon, to form 13S-HpOD. For h15-LOX-2, C-H cleavage occurs at carbon-13 of AA with oxygen insertion at n + 2 carbon to form 15S-HpETE.
Figure 3
Figure 3
Homolytic C-H/C-D bond cleavage (formal H• transfer) as carried out by lipoxygenases and the determination of kinetic isotope effects (Dk). Note that C-H bonds can also be cleaved through heterolytic processes, resulting in proton (H+) and/or hydride (H) transfer. However, these enzymatic processes are often associated with modest kinetic isotope effects [78]. Isotope effects can be assessed for the first-order (Dkcat) or second-order (Dkcat/KM) rate constants.
Figure 4
Figure 4
Reaction progress diagrams (left) and Arrhenius plots (right) for the cleavage of C-H/C-D bonds. Classical transition states are indicated by ‘‡’. (A) Representation of semi-classical origins of the kinetic isotope effect (KIE). (B) Representation of a full tunneling mechanism for hydrogen transfer through the barrier.
Figure 5
Figure 5
Graphical representation of the Marcus reaction coordinate involving the heavy atom positions and defined by λ and the driving force, ΔGo. At the tunneling ready state (TRS; filled purple dot), the positioning of the hydrogenic wave function has become degenerate across the donor and acceptor wells.
Figure 6
Figure 6
Kinetic isotope effects reported for the first-order (Dkcat) and second-order (Dkcat/KM) rate constants for the reaction of SLO with substrate LA, as a function of temperature (A) [99]. (B) Schematic representation of the reaction coordinate for SLO reaction with LA at 30 °C (solid line). The ‘‡’ represents the classical transition state. The decrease in Dkcat/KM, relative to Dkcat, observed at 5 °C is associated with an increase in the kinetic barrier for substrate binding (dashed line). Note that the Dkcat values are smaller than 80, as originally reported [89]. These lower Dkcat values were attributed to slight substrate contamination, and while the magnitudes of the Dkcat are different, the trends are the same.
Figure 7
Figure 7
Effect of the concentration of oleyl sulfate (OS) on the change in Dkcat/KM (∆ KIE) for SLO-1 reaction with LA at 5 °C and pH 9 (A) [100] (Panel A was reproduced with permission from Mogul, Johansen, and Holman. Biochemistry 2000). Schematic representing the impact of effector addition upon the reaction coordinate (B) and proposed mechanism (C) in soybean lipoxygenase chemistry [102] (Panels B and C are reproduced with permission from Offenbacher, Iavarone, and Klinman. J. Biol. Chem. 2018). In (B), the solid line represents the reaction coordinate (up to the first irreversible step, k2) for SLO reaction with LA in the absence of an effector. The dashed line represents the changes to the steps in the reaction coordinate in the presence of OS determined from kinetic analysis. Keq refers to an internal reorganization from the initial enzyme-substrate complex ES to ES’ structure; the latter is the productive complex for chemistry.
Figure 8
Figure 8
The allosteric effector, 14S-HpDHA, downregulates 13S,14S-epoxyDHA production, the maresin intermediate, from approximately 70% to below 5% at micromolar concentrations.
Figure 9
Figure 9
Structure of MoLOX (PDB: 5FNO [111]) is presented in (A). Helix 2 and the arched helix are colored as salmon and pale green, respectively. The manganese cofactor is represented as a dark gray sphere. Sites of N-linked glycosylation are shown as yellow spheres. Panel (B) shows the separation between helix 2 (bottom) and the arched helix (top) covering the active site. There is an expanded opening of the entrance of the substrate portal that is not seen in plant and animal LOX structures. The protein was rotated 90° relative to (A).
Figure 10
Figure 10
In silico model of human 15-LOX-2 structure (PDB: 4NRE) docked with 13S-HODE (yellow sticks) in the proposed allosteric site at the intersection between the PLAT (wheat) and catalytic (light green) domains [81]. The structure has been rotated 180° from Figure 2B. Potential hydrogen bond interactions are depicted by dashed lines and side chains labeled.
Figure 11
Figure 11
Partial structural model of the SLO-1 catalytic domain (A) with peptides affected by the presence of OS, color-coded as follows: residues 239–256 and 257–273 (salmon), 297–305 and 306–316 (wheat), 317–334 (pale yellow), and 751–761 (pale green). The number of the N-terminal amino acid of each peptide, affected by OS, is shown in the structure for reference. The orientation of SLO-1 has been rotated by 180° relative to the structure in Figure 2A. A cation-π interaction, involving R242 (catalytic domain) and W130 (PLAT domain), plays an important role in communicating allostery (see Section 6.2). (B and C) HDX-MS traces, collected at 10 °C, for peptides encompassing helix 2 (colored salmon in (A)). The color coding of the HDX-MS traces represents SLO in the absence of OS (black) and in the presence of OS (red). Data are corrected for deuterium content and peptide-specific back-exchange [102,123].
Figure 12
Figure 12
Diagram of the putative cation-π interaction that connects the PLAT domain to helix 2 of the catalytic and that has been implicated [54] in Ca2+-dependent activation in 11R-LOX. The structural overlays represent the coral 11R-LOX (purple; PDB: 3O8Y), h15-LOX-2 (cyan; PDB: 4NRE), and SLO-1 (green; PDB: 3PZW) crystal structures.

References

    1. Brash A.R. Lipoxygenases: Occurrence, functions, catalysis, and acquisition of substrate. J. Biol. Chem. 1999;274:23679–23682. doi: 10.1074/jbc.274.34.23679. - DOI - PubMed
    1. Grechkin A.N. Recent developments in biochemistry of the plant lipoxygenase pathway. Prog. Lipid Res. 1998;37:317–352. doi: 10.1016/S0163-7827(98)00014-9. - DOI - PubMed
    1. Ivanov I., Heydeck D., Hofheinz K., Roffeis J., O’Donnell V., Kuhn H., Walther M. Molecular enzymology of lipoxygenases. Arch. Biochem. Biophys. 2010;503:161–174. doi: 10.1016/j.abb.2010.08.016. - DOI - PubMed
    1. Oliw E.H. Plant and fungal lipoxygenases. Prostag. Other Lipid Mediat. 2002;68:313–323. doi: 10.1016/S0090-6980(02)00037-0. - DOI - PubMed
    1. Kuhn H., Banthiya S., Van Leyen K. Mammalian lipoxygenases and their biological relevance. Biochim. Biophys. Acta. 2015;1851:308–330. doi: 10.1016/j.bbalip.2014.10.002. - DOI - PMC - PubMed