. 2020 Jul 26;8(8):1122.
doi: 10.3390/microorganisms8081122.

Fecal Pollution Drives Antibiotic Resistance and Class 1 Integron Abundance in Aquatic Environments of the Bolivian Andes Impacted by Mining and Wastewater

Affiliations

Fecal Pollution Drives Antibiotic Resistance and Class 1 Integron Abundance in Aquatic Environments of the Bolivian Andes Impacted by Mining and Wastewater

Jorge Agramont et al. Microorganisms. .

Abstract

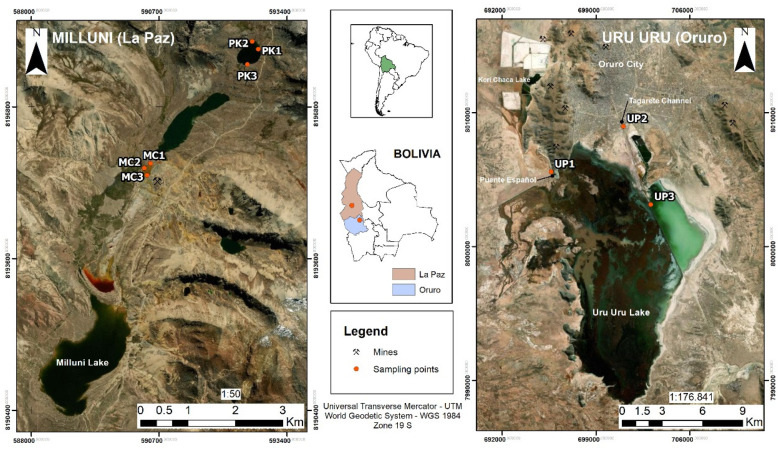
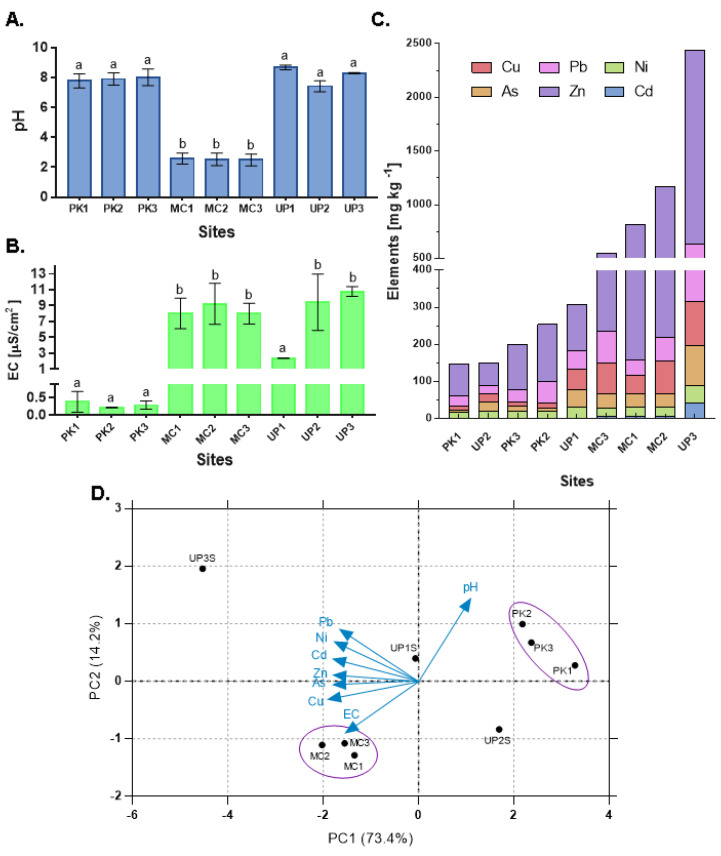
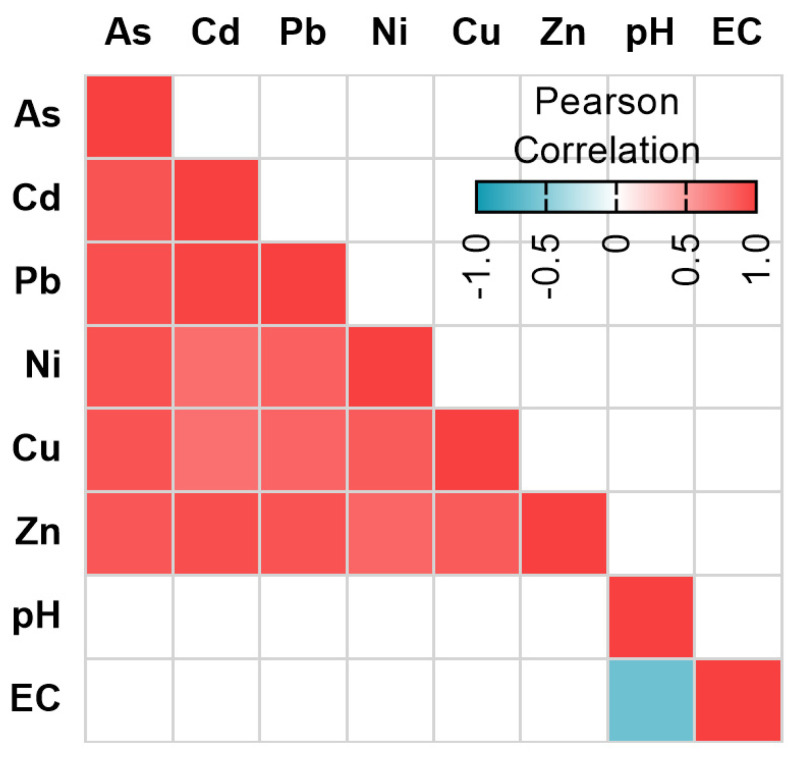
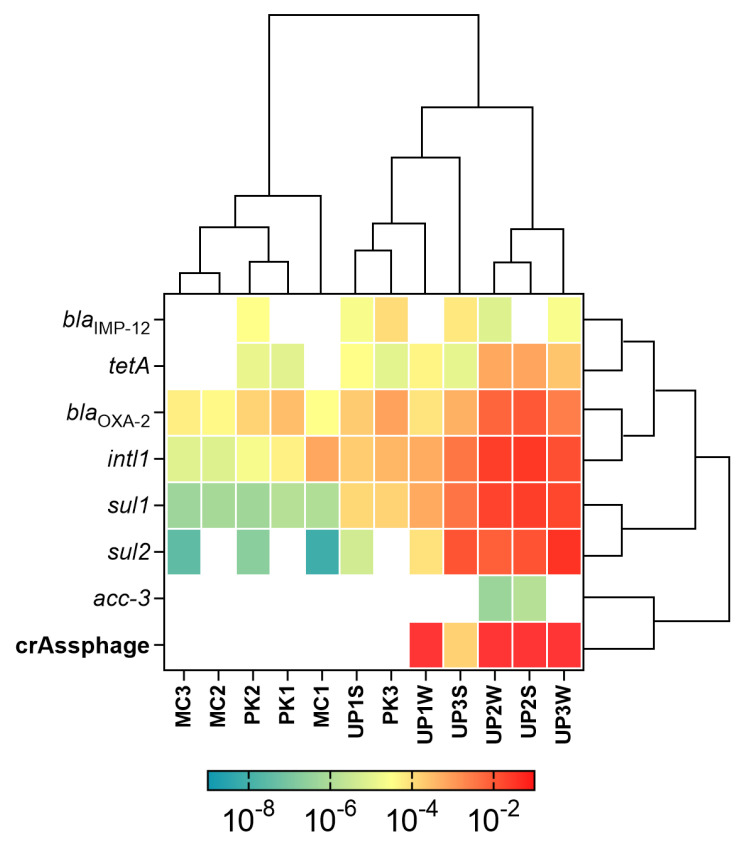
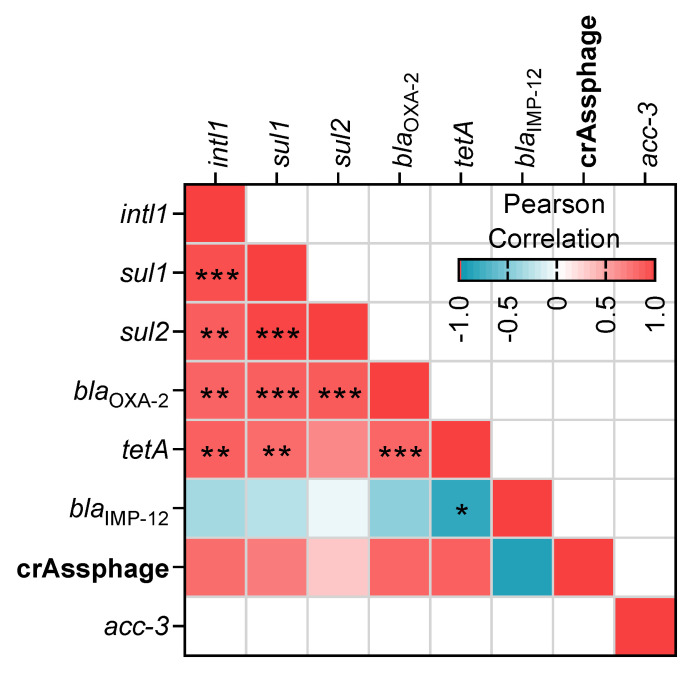
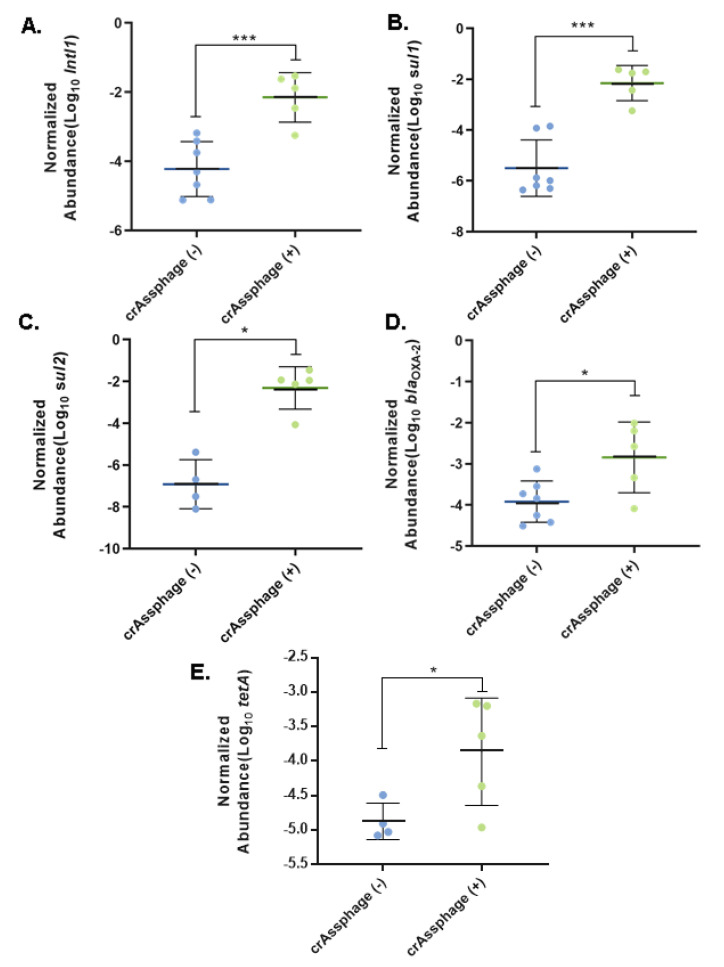
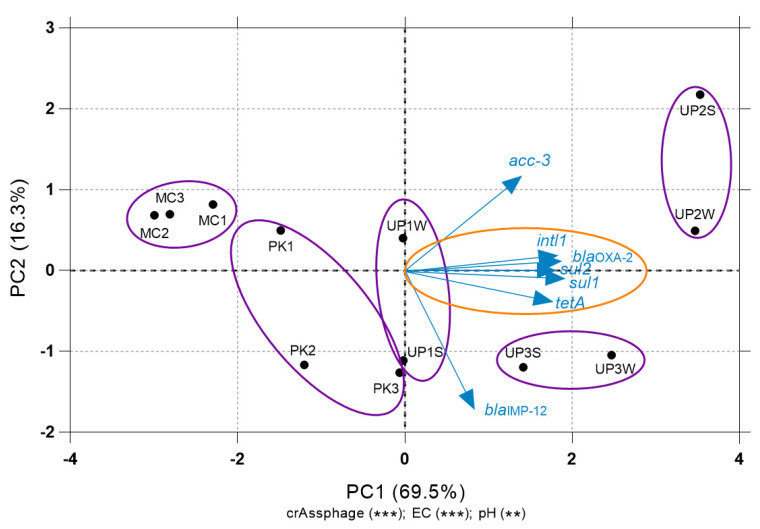
An increased abundance of antibiotic resistance genes (ARGs) in aquatic environments has been linked to environmental pollution. Mining polluted sites with high concentration of metals could favor the in situ coselection of ARGs, whereas wastewater discharges release fecal antibiotic resistant bacteria in the environment. To study the effect of human fecal contamination and mining pollution, water and sediment samples affected by mining activities and sewage discharges were collected from three lakes in Bolivia, the pristine Andean lake Pata Khota, the Milluni Chico lake directly impacted by acid mine drainage, and the Uru-Uru lake located close to Oruro city and highly polluted by mining activities and human wastewater discharges. Physicochemical parameters, including metal composition, were analyzed in water and sediment samples. ARGs were screened for and verified by quantitative polymerase chain reaction (PCR) together with the mobile element class 1 integron (intl1), as well as crAssphage, a marker of human fecal pollution. The gene intl1 was positively correlated with sul1, sul2, tetA, and blaOXA-2. CrAssphage was only detected in the Uru-Uru lake, and its tributaries and significantly higher abundance of ARGs were found in these sites. Multivariate analysis showed that crAssphage abundance, electrical conductivity, and pH were positively correlated with higher levels of intl1 and ARGs. Taken together, our results suggest that fecal pollution is the major driver of higher levels of ARGs and intl1 in environments contaminated by wastewater and mining activities.

Keywords: antibiotic resistance genes (ARGs; crAssphage; fecal pollution; metal contamination; wastewater.


Conflict of interest statement

The authors declare no conflict of interest.

Figures

Figure 1
Figure 1
Study area. The left panel shows the sampling sites in the Milluni Valley. Three samples were collected from both lakes, the pristine Pata Khota (PK) and Milluni Chico (MC). MC is located directly downstream of the Mine “La Fabulosa.” The right panel shows the sampling sites in the Uru Uru Lake, in the department of Oruro: UP1 is located at the channel that discharges the water of the meromictic lake Kori Chaca an old open-pit gold mine, UP2 is located at the Tagarete channel that carries untreated wastewater discharges from Oruro city, and UP3 is located in the northeast part of Uru Uru Lake, and receives the discharges of both mining residues and wastewater.
Figure 2
Figure 2
Physicochemical parameters and metal levels. The mean values are shown in bars, and standard deviation values are presented as the error-bars. Different letters represent statistically significant differences (p < 0.05), calculated by analysis of variance (ANOVA). (A) pH and (B) EC of water. (C) The levels of metals (mg Kg−1) measured from sediment samples. The data is shown in bars with cumulative values. (D) PCA of physicochemical parameters and metal concentrations of sampling sites.
Figure 3
Figure 3
Correlation among metals and physicochemical parameters. The R correlation coefficient is represented in colors, as indicated in the legend. Only significant correlations (p < 0.05) were included.
Figure 4
Figure 4
Normalized abundance of ARGs, intl1, and crAssphage detected on sediments and water. The abundance values of ARGs and intl1 were normalized to 16S rRNA gene abundance, and the absolute abundance of crAssphage was included. The data were transformed using Log(10) and represented in a heatmap where reddish coloration symbolizes a higher abundance. Rows and columns were ordered by similarity with hierarchical clustering. S: Sediments; W: Water.
Figure 5
Figure 5
Correlation among the detected genes. R correlation coefficient is represented as a heat map of colors. Significative correlations are depicted as follows: * p < 0.05, ** p < 0.01, *** p < 0.001.
Figure 6
Figure 6
Abundance of ARGs and intl1 in function to the presence of crAssphage. The abundance of (A) intl1, (B) sul1, (C) sul2, (D) blaOXA-2, and (E) tetA between the samples with and without detected crAssphage were compared using ANOVA. * p < 0.05, ** p < 0.01, *** p < 0.001.
Figure 7
Figure 7
Relationship between environmental variables, intl1, and ARGs abundance. The PCA was performed with the data of normalized gene abundance per site of ARGs and intl1. A multiple Lm of the PCs with environmental variables was performed. The numbers in parenthesis represent the percentage of variation explained by the axis, and the parameters that are significantly related to the axis are expressed with: * p < 0.05, ** p < 0.001, and ***p < 0.0001. Related sampling points are indicated within purple circles. The abundance of intl1 and the ARGs are represented as blue arrows. The direction of the arrow indicates an increasing abundance of the genes. The angle of the arrows with respect to the axis represents the linear relation of the abundance with the PC, and the orange circle shows the most important variables (intl1, sul1, sul2, blaOXA-2, tetA). Along the PC1, the abundance of intl1 and ARGs increased toward the right. S: Sediments; W:Water.

References

    1. Llor C., Bjerrum L. Antimicrobial resistance: Risk associated with antibiotic overuse and initiatives to reduce the problem. Ther. Adv. Drug Saf. 2014;5:229–241. doi: 10.1177/2042098614554919. - DOI - PMC - PubMed
    1. Berendonk T.U., Manaia C.M., Merlin C., Fatta-Kassinos D., Cytryn E., Walsh F., Burgmann H., Sorum H., Norstrom M., Pons M.N., et al. Tackling antibiotic resistance: The environmental framework. Nat. Rev. Microbiol. 2015;13:310–317. doi: 10.1038/nrmicro3439. - DOI - PubMed
    1. Gillings M.R., Westoby M., Ghaly T.M. Pollutants That Replicate: Xenogenetic DNAs. Trends Microbiol. 2018;26:975–977. doi: 10.1016/j.tim.2018.08.003. - DOI - PubMed
    1. Marti E., Variatza E., Balcazar J.L. The role of aquatic ecosystems as reservoirs of antibiotic resistance. Trends Microbiol. 2014;22:36–41. doi: 10.1016/j.tim.2013.11.001. - DOI - PubMed
    1. Chu B.T.T., Petrovich M.L., Chaudhary A., Wright D., Murphy B., Wells G., Poretsky R. Metagenomics Reveals the Impact of Wastewater Treatment Plants on the Dispersal of Microorganisms and Genes in Aquatic Sediments. Appl. Environ. Microbiol. 2018;84 doi: 10.1128/AEM.02168-17. - DOI - PMC - PubMed

LinkOut - more resources