

Confronting an individual-based simulation model with empirical community patterns of grasslands
- PMID: 32722690
- PMCID: PMC7386574
- DOI: 10.1371/journal.pone.0236546
Confronting an individual-based simulation model with empirical community patterns of grasslands
Abstract
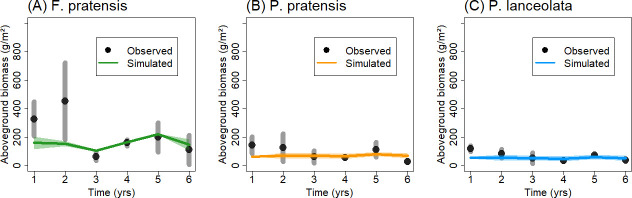
Grasslands contribute to global biogeochemical cycles and can host a high number of plant species. Both-species dynamics and biogeochemical fluxes-are influenced by abiotic and biotic environmental factors, management and natural disturbances. In order to understand and project grassland dynamics under global change, vegetation models which explicitly capture all relevant processes and drivers are required. However, the parameterization of such models is often challenging. Here, we report on testing an individual- and process-based model for simulating the dynamics and structure of a grassland experiment in temperate Europe. We parameterized the model for three species and confront simulated grassland dynamics with empirical observations of their monocultures and one two-species mixture. The model reproduces general trends of vegetation patterns (vegetation cover and height, aboveground biomass and leaf area index) for the monocultures and two-species community. For example, the model simulates well an average annual grassland cover of 70% in the species mixture (observed cover of 77%), but also shows mismatches with specific observation values (e.g. for aboveground biomass). By a sensitivity analysis of the applied inverse model parameterization method, we demonstrate that multiple vegetation attributes are important for a successful parameterization while leaf area index revealed to be of highest relevance. Results of our study pinpoint to the need of improved grassland measurements (esp. of temporally higher resolution) in close combination with advanced modelling approaches.
Conflict of interest statement
The authors have declared that no competing interests exist.
Figures


References
-
- Eurostat, European statistics, 2017.
-
- Isselstein J, Jeangros B, Pavlu V. Agronomic aspects of biodiversity targeted management of temperate grasslands in Europe–a review. Agronomy Research. 2005;3(2):139–151.
-
- Suttie JM, Reynolds SG, Batello C. Grasslands of the World (Vol. 34). Food & Agriculture Org; 2005 2005.
-
- Spehn EM, Hector A, Joshi J, Scherer-Lorenzen M, Schmid B, Bazeley-White E, et al. Ecosystem effects of biodiversity manipulations in European grasslands. Ecological Monographs. 2005;75(1):37–63.
Publication types
MeSH terms
LinkOut - more resources
Full Text Sources
