. 2020 Aug 25;324(8):772-781.
doi: 10.1001/jama.2020.12134.

Discriminative Accuracy of Plasma Phospho-tau217 for Alzheimer Disease vs Other Neurodegenerative Disorders

Affiliations

Discriminative Accuracy of Plasma Phospho-tau217 for Alzheimer Disease vs Other Neurodegenerative Disorders

Sebastian Palmqvist et al. JAMA. .

Abstract

Importance: There are limitations in current diagnostic testing approaches for Alzheimer disease (AD).

Objective: To examine plasma tau phosphorylated at threonine 217 (P-tau217) as a diagnostic biomarker for AD.

Design, setting, and participants: Three cross-sectional cohorts: an Arizona-based neuropathology cohort (cohort 1), including 34 participants with AD and 47 without AD (dates of enrollment, May 2007-January 2019); the Swedish BioFINDER-2 cohort (cohort 2), including cognitively unimpaired participants (n = 301) and clinically diagnosed patients with mild cognitive impairment (MCI) (n = 178), AD dementia (n = 121), and other neurodegenerative diseases (n = 99) (April 2017-September 2019); and a Colombian autosomal-dominant AD kindred (cohort 3), including 365 PSEN1 E280A mutation carriers and 257 mutation noncarriers (December 2013-February 2017).

Exposures: Plasma P-tau217.

Main outcomes and measures: Primary outcome was the discriminative accuracy of plasma P-tau217 for AD (clinical or neuropathological diagnosis). Secondary outcome was the association with tau pathology (determined using neuropathology or positron emission tomography [PET]).

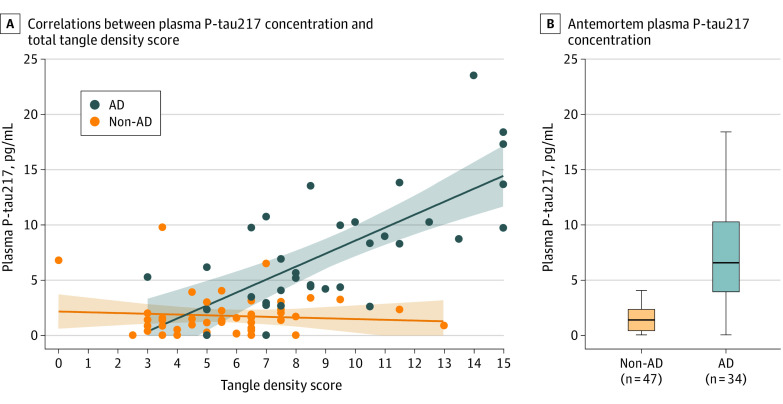
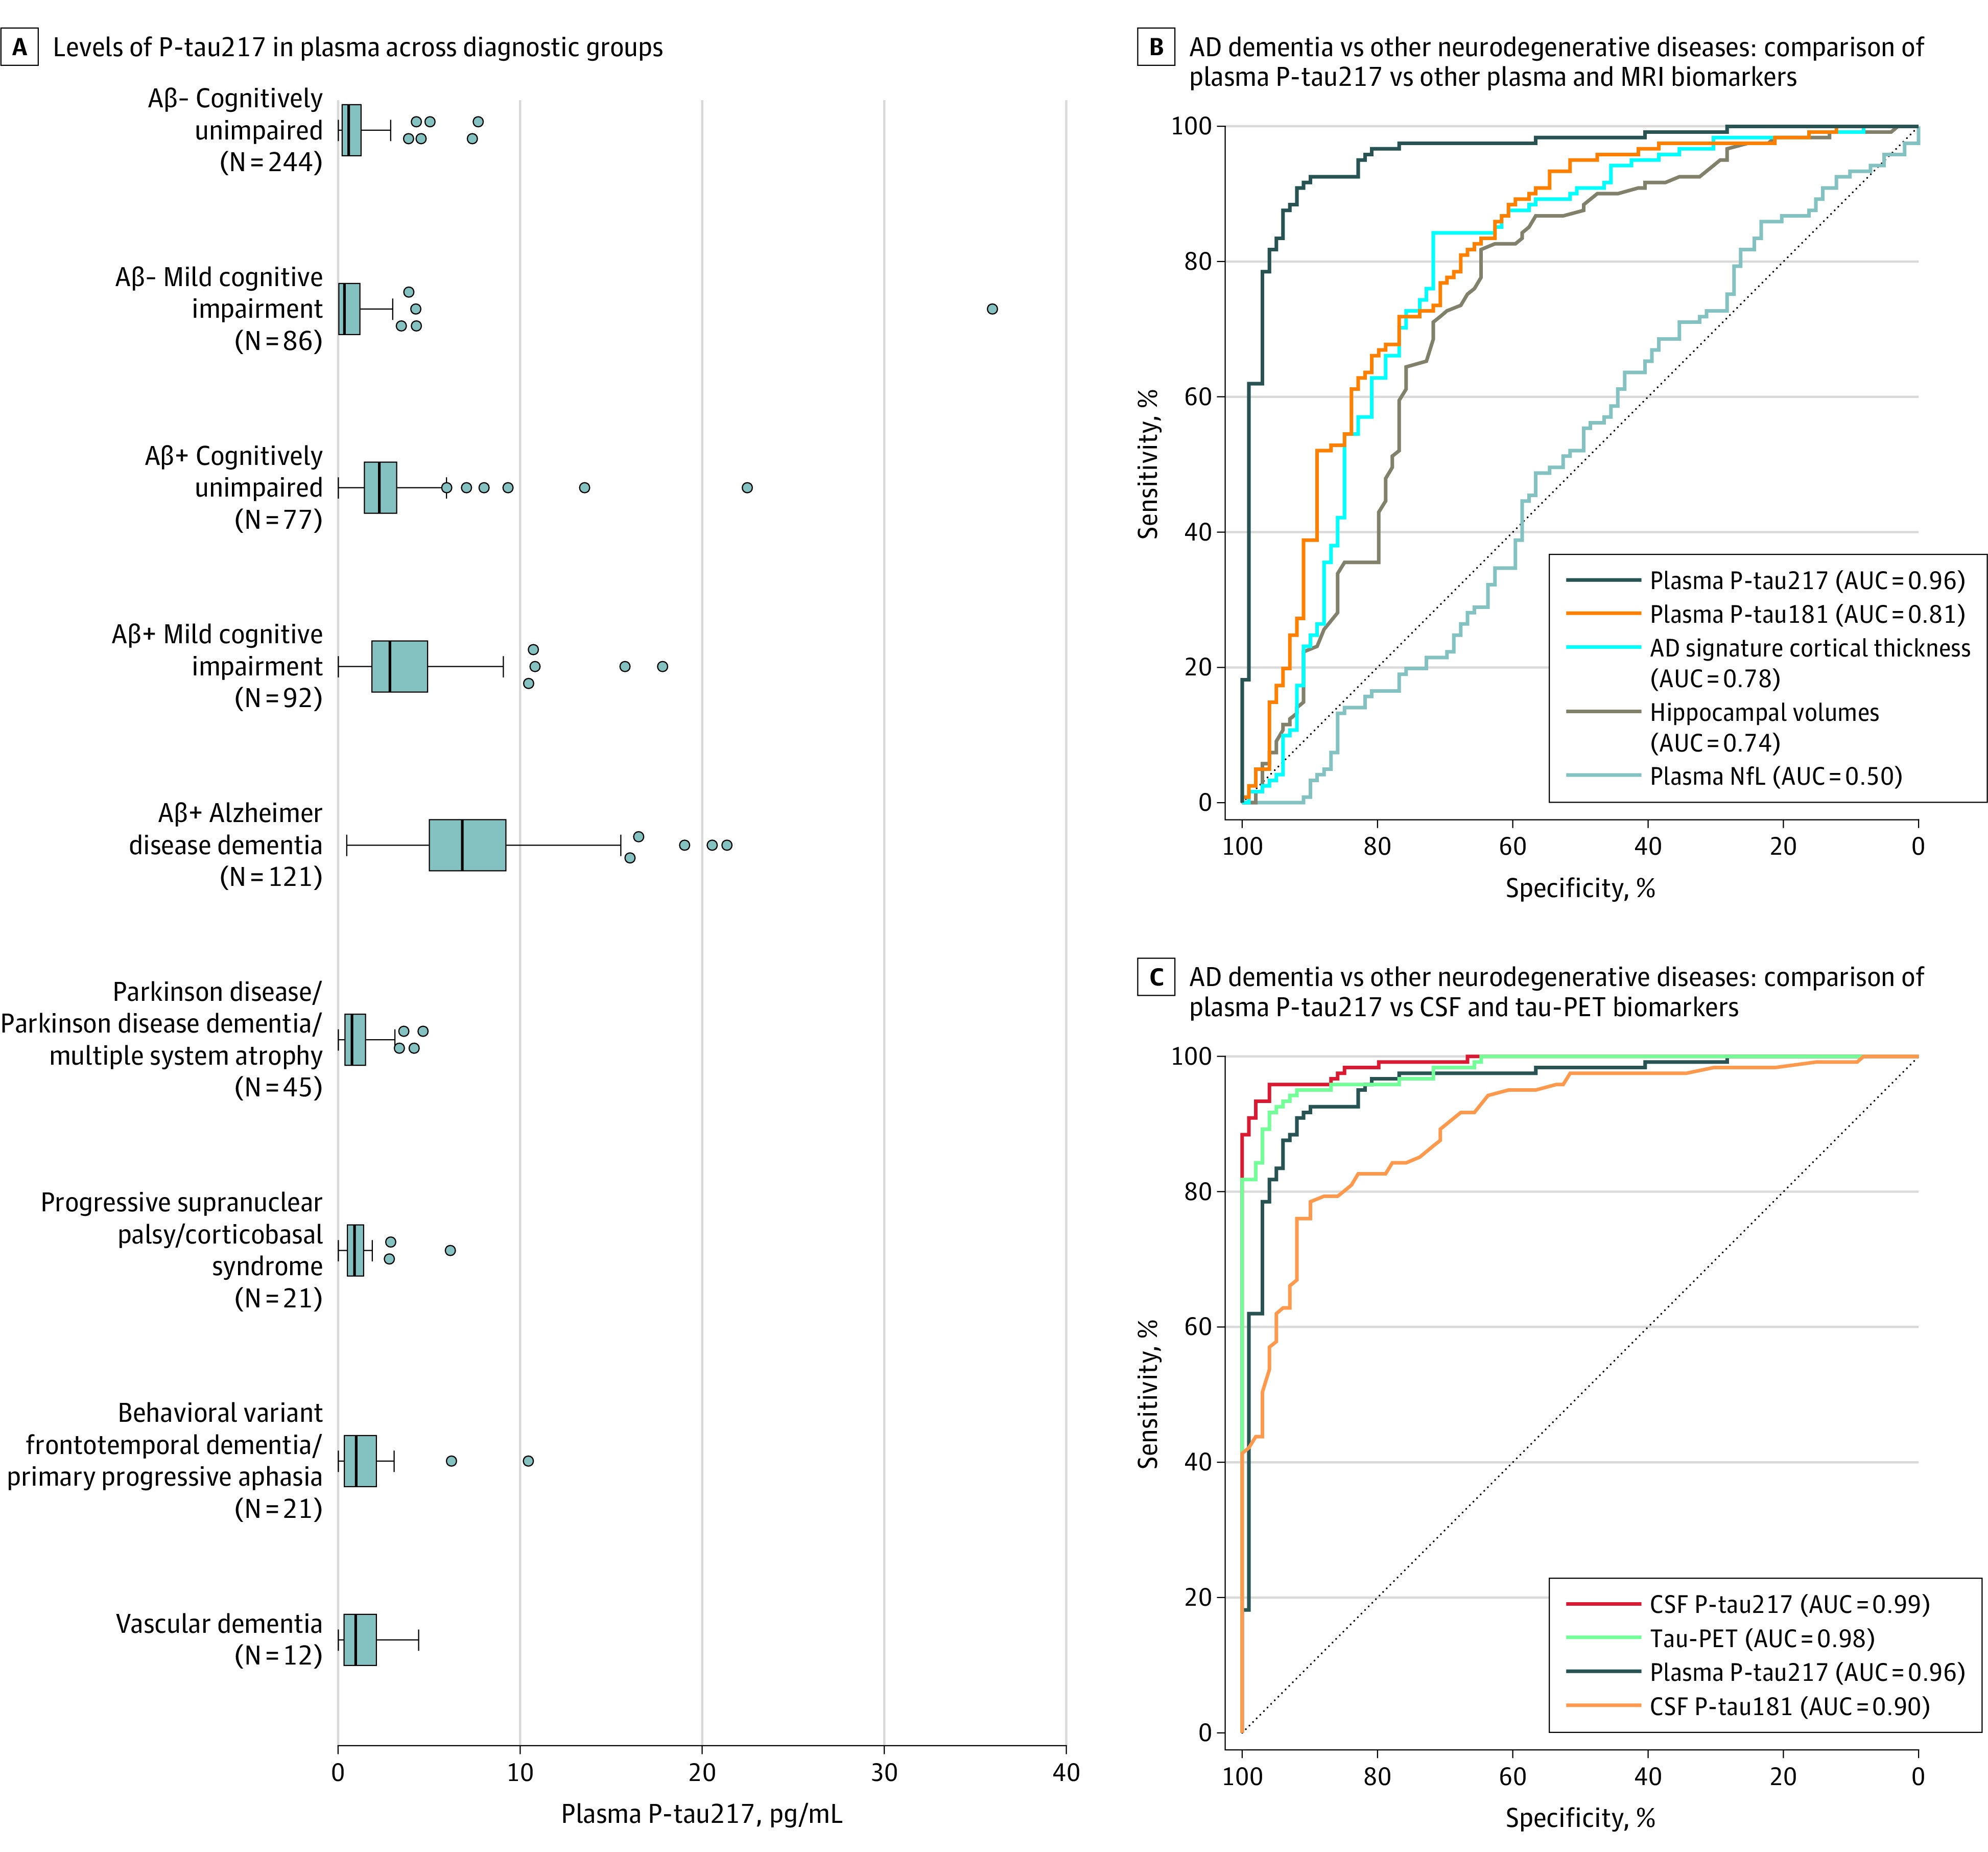
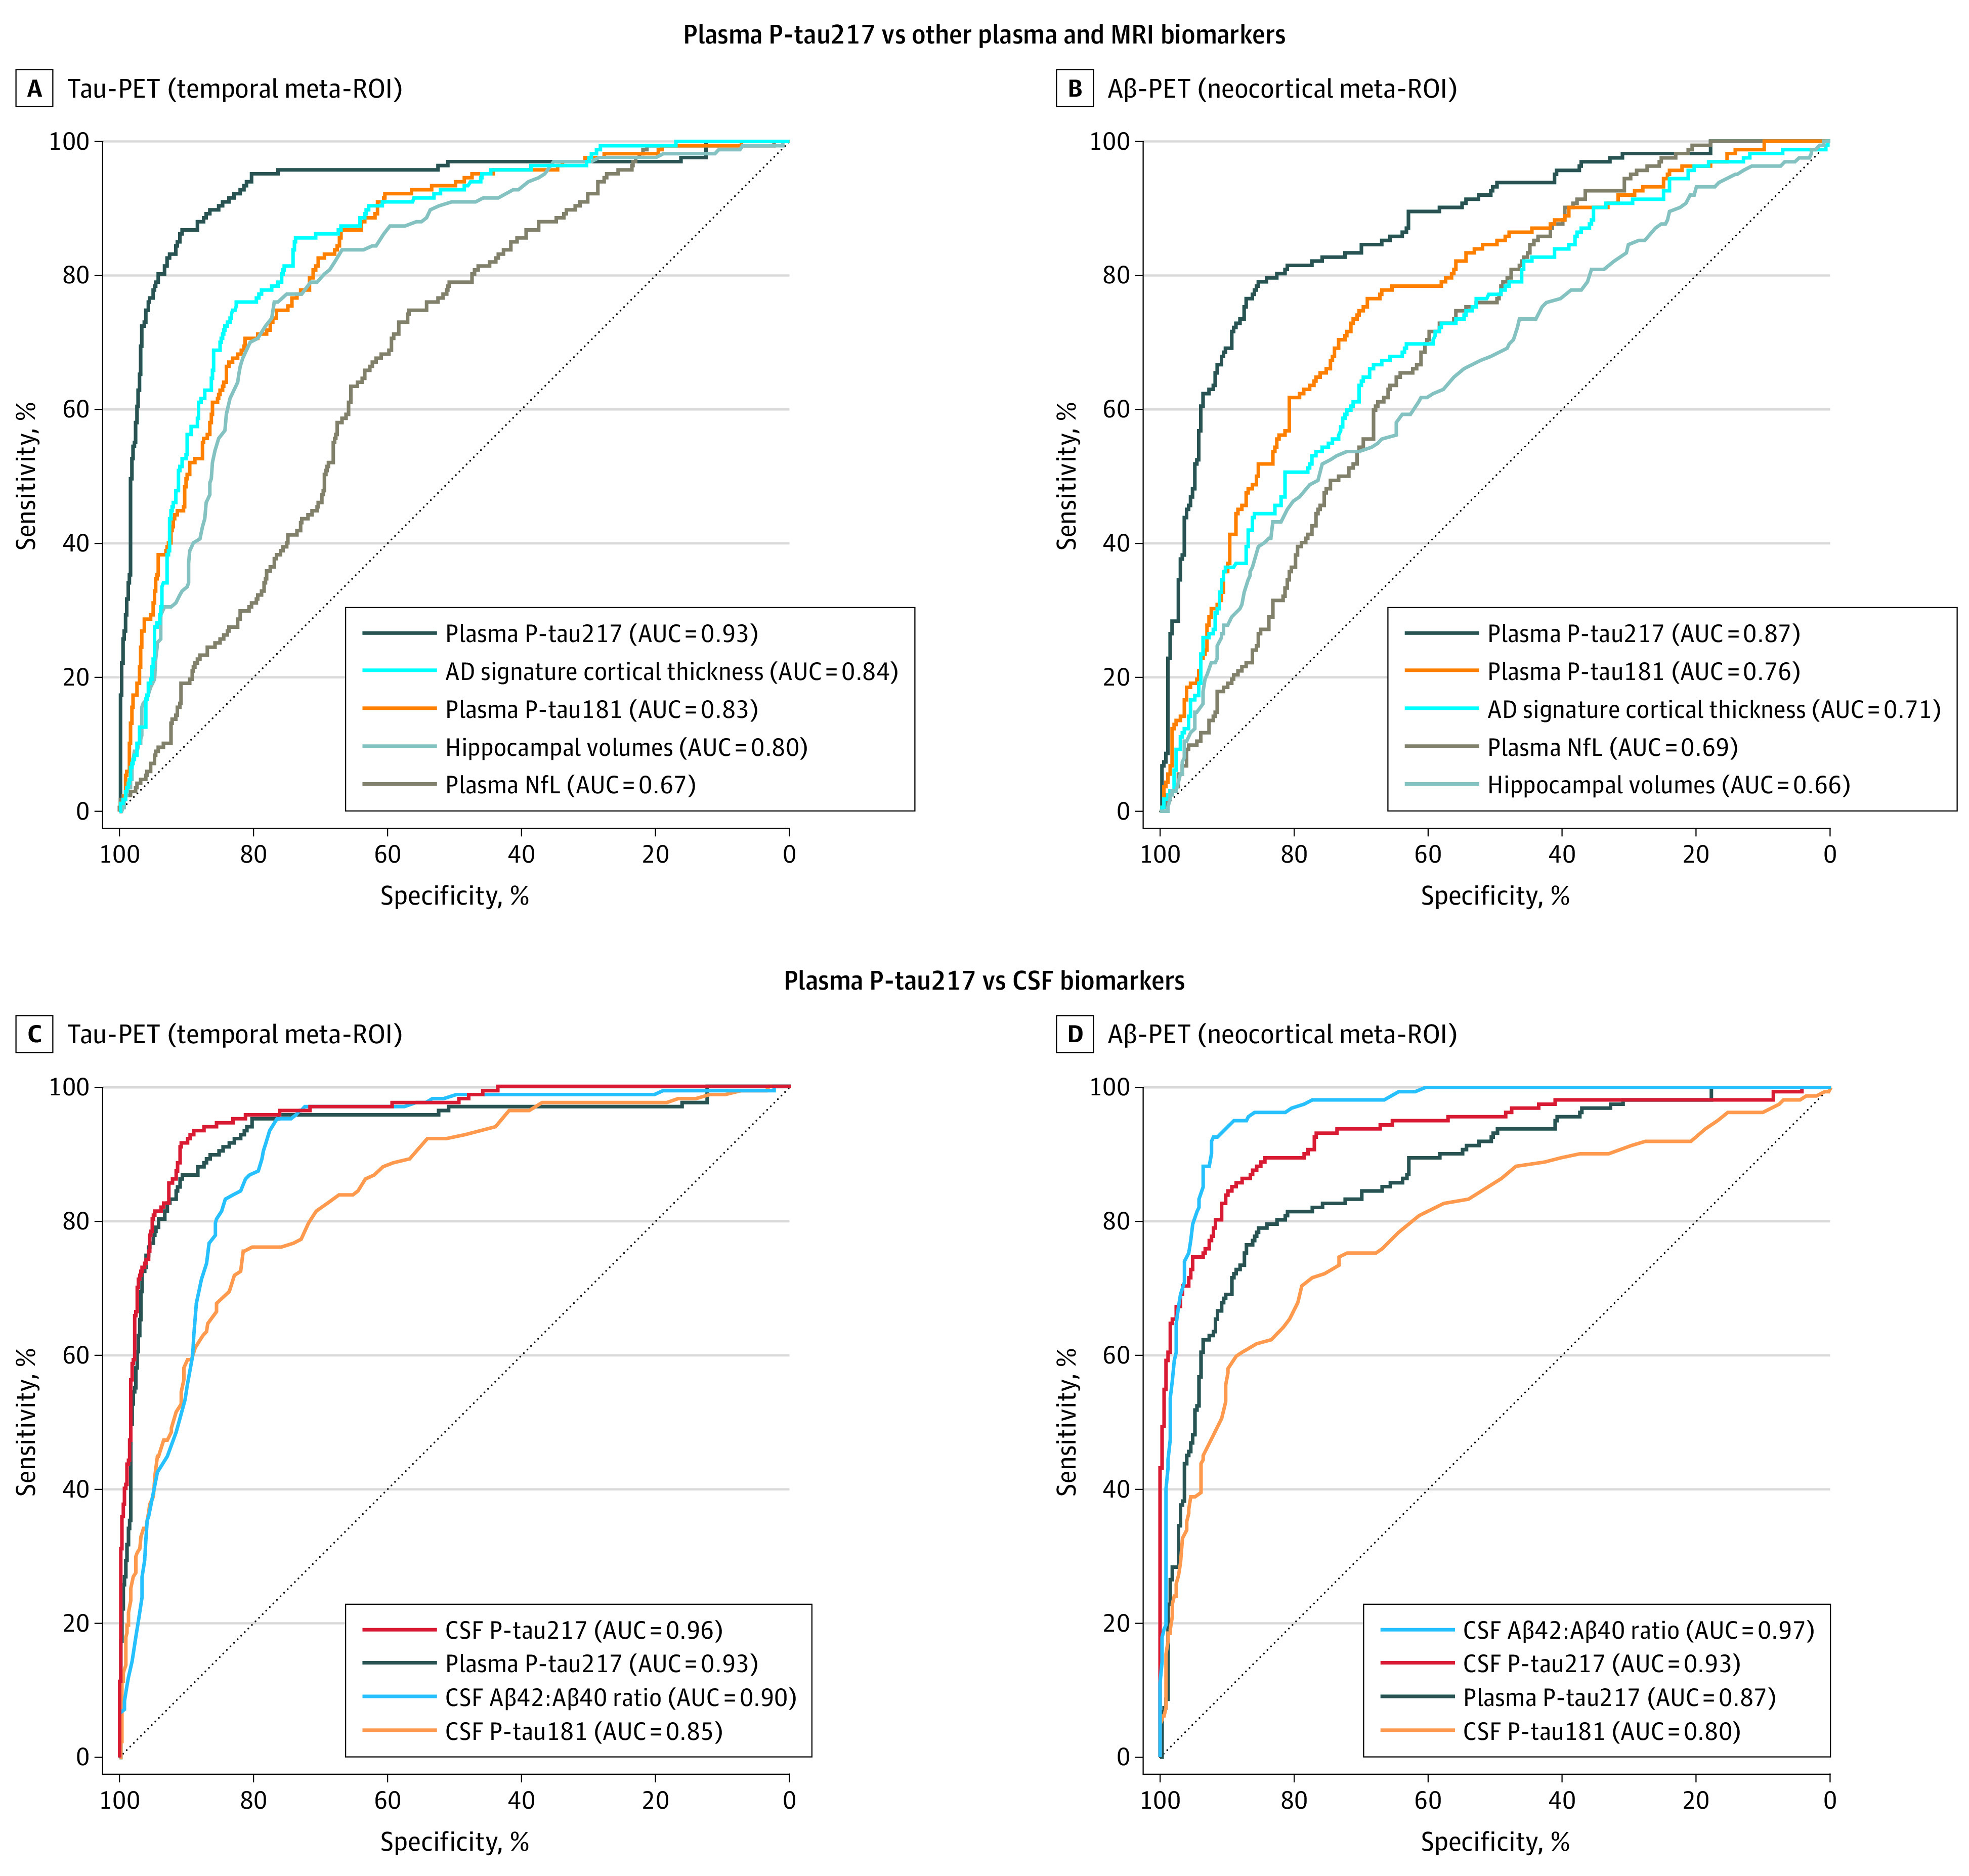
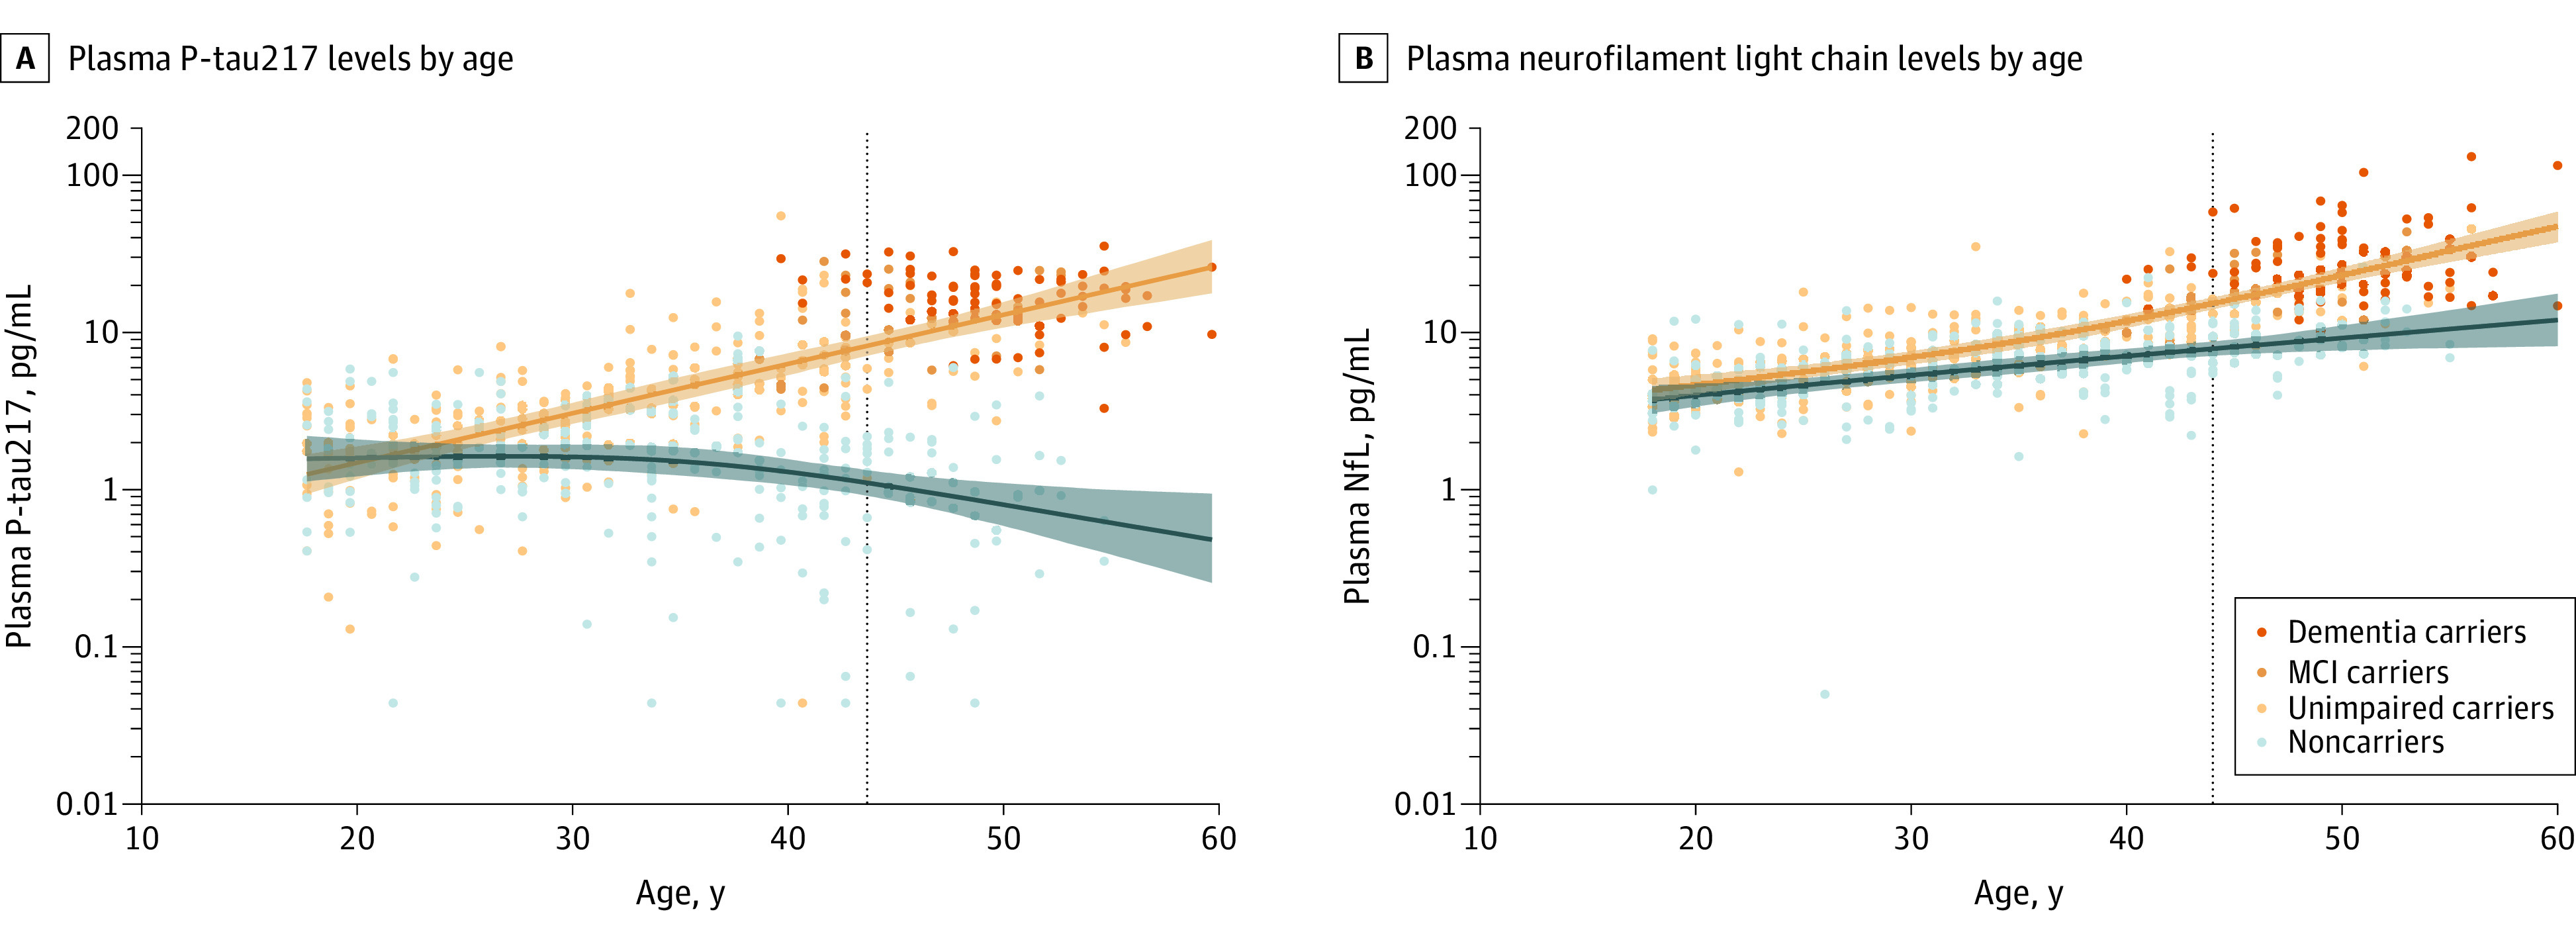
Results: Mean age was 83.5 (SD, 8.5) years in cohort 1, 69.1 (SD, 10.3) years in cohort 2, and 35.8 (SD, 10.7) years in cohort 3; 38% were women in cohort 1, 51% in cohort 2, and 57% in cohort 3. In cohort 1, antemortem plasma P-tau217 differentiated neuropathologically defined AD from non-AD (area under the curve [AUC], 0.89 [95% CI, 0.81-0.97]) with significantly higher accuracy than plasma P-tau181 and neurofilament light chain (NfL) (AUC range, 0.50-0.72; P < .05). The discriminative accuracy of plasma P-tau217 in cohort 2 for clinical AD dementia vs other neurodegenerative diseases (AUC, 0.96 [95% CI, 0.93-0.98]) was significantly higher than plasma P-tau181, plasma NfL, and MRI measures (AUC range, 0.50-0.81; P < .001) but not significantly different compared with cerebrospinal fluid (CSF) P-tau217, CSF P-tau181, and tau-PET (AUC range, 0.90-0.99; P > .15). In cohort 3, plasma P-tau217 levels were significantly greater among PSEN1 mutation carriers, compared with noncarriers, from approximately 25 years and older, which is 20 years prior to estimated onset of MCI among mutation carriers. Plasma P-tau217 levels correlated with tau tangles in participants with (Spearman ρ = 0.64; P < .001), but not without (Spearman ρ = 0.15; P = .33), β-amyloid plaques in cohort 1. In cohort 2, plasma P-tau217 discriminated abnormal vs normal tau-PET scans (AUC, 0.93 [95% CI, 0.91-0.96]) with significantly higher accuracy than plasma P-tau181, plasma NfL, CSF P-tau181, CSF Aβ42:Aβ40 ratio, and MRI measures (AUC range, 0.67-0.90; P < .05), but its performance was not significantly different compared with CSF P-tau217 (AUC, 0.96; P = .22).

Conclusions and relevance: Among 1402 participants from 3 selected cohorts, plasma P-tau217 discriminated AD from other neurodegenerative diseases, with significantly higher accuracy than established plasma- and MRI-based biomarkers, and its performance was not significantly different from key CSF- or PET-based measures. Further research is needed to optimize the assay, validate the findings in unselected and diverse populations, and determine its potential role in clinical care.


Conflict of interest statement

Conflict of Interest Disclosures: Dr Quiroz reported receiving grants from the National Institutes of Health (NIH) and Massachusetts General Hospital. Dr Zetterberg reported receiving grants from The Knut and Alice Wallenberg Foundation, European Research Council, and Swedish Research Council; receiving personal fees from Samumed, Roche Diagnostics, CogRx, Wave, Alzecure, and Biogen; and that he is cofounder of Brain Biomarker Solutions in Gothenburg AB. Dr Lopera reported receiving grants from the NIH and Genentech/Roche/Banner and receiving personal fees from the NIH. Dr Su reported receiving grants from the NIH, the State of Arizona, BrightFocus Foundation, and Alzheimer's Association and receiving personal fees from Green Valley Pharmaceutical LLC. Dr Chai reported a patent to pTau217 assay and its use, antibodies pending. Dr Beach reported receiving grants from the State of Arizona; receiving personal fees from Prothena Biosciences, Vivid Genomics, and Avid Radiopharmaceuticals; and holding stock options with Vivid Genomics. Dr Blennow reported receiving personal fees from Abcam, Axon, Biogen, Lilly, MagQu, Novartis, and Roche Diagnostics and that he is cofounder of Brain Biomarker Solutions in Gothenburg AB, a GU Ventures-based platform company at the University of Gothenburg. Dr Dage reported a patent pending for compounds and methods targeting human tau. Dr Reiman reported receiving grants from National Institute on Aging and the State of Arizona; receiving philanthropic funding from the Banner Alzheimer’s Foundation, Sun Health Foundation, and Roche/Roche Diagnostics; receiving personal fees from Alkahest, Alzheon, Aural Analytics, Denali, Green Valley, MagQ, Takeda/Zinfandel, United Neuroscience; that he has since submission of manuscript become a cofounder of AlzPath, which aims to further develop P-tau217 and fluid biomarkers and advance their use in research, drug development, and clinical settings; holding a patent owned by Banner Health for a strategy to use biomarkers to accelerate evaluation of Alzheimer prevention therapies; and that he is a principal investigator of prevention trials that include research agreements with Genentech/Roche and Novartis/Amgen, PET studies that include research agreements with Avid/Lilly, and several NIH and Foundation-supported research studies. Dr Hansson reported receiving grants from Roche, Biogen, and Pfizer and receiving nonfinancial support from GE Healthcare, AVID Radiopharmaceuticals, and Euroimmun. No other disclosures were reported.

Figures

Figure 1.
Figure 1.. Plasma P-tau217 Concentrations in the Neuropathology Cohort (Cohort 1)
A, Correlations between plasma tau phosphorylated at threonine 217 (P-tau217) concentration and total tangle density score in the Alzheimer disease (AD; National Institute on Aging–Reagan Institute [NIA-RI] intermediate or high likelihood of AD) and non-AD (no or sparse β-amyloid plaques) groups. For participants in the AD group, Spearman ρ was 0.64 (P < .001); for those in the non-AD group there was no significant correlation (Spearman ρ = 0.15, P = .33). The tangle density score (x-axis; 0-15) is the sum of neurofibrillary tau-tangle density score (0-3) in standard regions of the frontal, temporal, and parietal lobes; hippocampal CA1; and entorhinal/transentorhinal regions (eMethods in the Supplement). Shaded areas indicate 95% confidence intervals around the regression lines. B, Antemortem plasma P-tau217 concentrations in the AD (NIA-RI intermediate or high likelihood of AD) (n = 34) and non-AD (no or sparse β-amyloid plaques) (n = 47) groups according to neuropathology. Box ends denote the 25th and 75th percentiles, and the horizontal line within each box represents the median. Whiskers extend to the upper and lower adjacent values or the most extreme points within 1.5 × interquartile range of the 25th and 75th percentiles. P < .001 for comparison of non-AD and AD groups. Corresponding receiver operating characteristic curve analyses are shown in eFigure 1A in the Supplement.
Figure 2.
Figure 2.. Plasma P-tau217 in the BioFINDER-2 Study (Cohort 2)
A, Plasma tau phosphorylated at threonine 217 (P-tau217) concentrations across the different diagnostic groups. P values from group comparisons are shown in eTable 11 in the Supplement. Box ends denote the 25th and 75th percentiles, the vertical lines are medians, and the whiskers extend to the upper and lower adjacent values or the most extreme points within 1.5 × interquartile range of the 25th and 75th percentiles. B and C show receiver operating characteristic (ROC) curve analyses with clinical Alzheimer disease (AD) dementia (n = 121) vs all other neurodegenerative diseases (n = 99) as reference standard comparing plasma P-tau217 with other plasma biomarkers and magnetic resonance imaging (MRI) (B); and comparing plasma P-tau217 with cerebrospinal fluid biomarkers and tau-PET (C). Statistical comparisons between areas under the ROC curve (AUCs) are reported in eTable 12 in the Supplement. Separate ROC curve analysis for AD dementia vs other specific diagnostic groups are shown in eFigure 3 in the Supplement. Aβ+ indicates β-amyloid positive; Aβ–, β-amyloid negative; CSF, cerebrospinal fluid; NfL, neurofilament light chain; PET, positron emission tomography.
Figure 3.
Figure 3.. Discriminative Accuracy of Plasma P-tau217 for Tau-PET and Aβ-PET in the BioFINDER-2 Study (Cohort 2)
Receiver operating characteristic (ROC) curve analyses of plasma tau phosphorylated at threonine 217 (P-tau217) and other biomarkers using tau–positron emission tomography (PET) positivity in the temporal meta–region of interest (ROI) as reference standard (A and C; n = 699 [tau-PET–, n = 532; tau-PET+, n = 167]) and Aβ-PET positivity in the neocortical meta-ROI as reference standard (B and D; n = 488 [Aβ-PET–, n = 326; Aβ-PET+, n = 162]). The tau-PET and Aβ-PET cutoffs for abnormality were standardized uptake values ratio 1.36 and 0.53, respectively (eMethods in the Supplement). Plasma P-tau217 was compared with other plasma biomarkers and magnetic resonance imaging (A and B); and with cerebrospinal fluid (CSF) biomarkers (C and D). Comparisons between areas under the ROC curve (AUCs) with sensitivities and specificities are shown in eTables 17 and 18 in the Supplement. Aβ indicates β-amyloid; CSF, cerebrospinal fluid; NfL, neurofilament light chain.
Figure 4.
Figure 4.. Plasma P-tau217 and NfL Levels as a Function of Age in the Autosomal-Dominant Alzheimer Disease Kindred (Cohort 3)
A and B, Plasma tau phosphorylated at threonine 217 (P-tau217) and neurofilament light chain (NfL) levels in PSEN1 E280A mutation carriers (orange) and noncarriers (blue) and as a function of age. Shaded areas indicate the 99% credible intervals around the spline model estimates. Vertical dotted lines indicate the median onset of mild cognitive impairment in mutation carriers (at age 44 years). The plasma NfL results are included for comparison with plasma P-tau217 and have partly been included in another analysis.

Comment in

References

    1. Brookmeyer R, Johnson E, Ziegler-Graham K, Arrighi HM. Forecasting the global burden of Alzheimer’s disease. Alzheimers Dement. 2007;3(3):186-191. doi:10.1016/j.jalz.2007.04.381 - DOI - PubMed
    1. Global Action Plan on the Public Health Response to Dementia 2017-2025. World Health Organization; 2017.
    1. Abbasi J. Promising results in 18-month analysis of Alzheimer drug candidate. JAMA. 2018;320(10):965. doi:10.1001/jama.2018.13027 - DOI - PubMed
    1. Sevigny J, Chiao P, Bussière T, et al. . The antibody aducanumab reduces Aβ plaques in Alzheimer’s disease. Nature. 2016;537(7618):50-56. doi:10.1038/nature19323 - DOI - PubMed
    1. Rabinovici GD, Gatsonis C, Apgar C, et al. . Association of amyloid positron emission tomography with subsequent change in clinical management among Medicare beneficiaries with mild cognitive impairment or dementia. JAMA. 2019;321(13):1286-1294. doi:10.1001/jama.2019.2000 - DOI - PMC - PubMed

Publication types

MeSH terms